Original Article
Differences in Akt signaling
and metabolism gene expression in the right
heart, intraventricular septum and left heart of rodents
Jiyang Song1,2*, Shutong Shen2*, Min Zhang3, Kai Wang2, Yan Zhang4, Xinli Li2, Nan Wang1, Yunshan Cao1
Departments of 1Cardiology, 3Pathology, Gansu Provincial Hospital, Lanzhou 730000, Gansu, People’s Republic of China; 2Department of Cardiology, The First Affiliated Hospital with Nanjing Medical University, Nanjing 210029, Jiangsu, People’s Republic of China; 4Tianjin Medical University Eye Institute, College of Optometry and
Ophthalmology, Tianjin Medical University, Tianjin 300384, People’s Republic of China. *Equal contributors. Received August 13, 2015; Accepted September 22, 2015; Epub October 1, 2015; Published October 15, 2015
Abstract: The right heart is functionally and structurally different from the left heart; however, potential differences in Akt signaling and the expression of metabolic genes between the right heart and left heart in different rodents are still unknown. Using Western blotting and real time quantification polymerase chain reaction, we measured the levels of total Akt, phosphorylated Akt and its downstream targets as well as metabolism genes including glucose transporter 1, glucose transporter 4 (GLUT4), peroxisome activated receptor α, peroxisome proliferator-activated receptor γ, peroxisome proliferator-proliferator-activated receptor δ, peroxisome proliferator-proliferator-activated receptor gamma coactivator 1α (PGC-1α), and pyruvate dehydrogenase lipoamide kinase isozyme 4. We found that phosphorylated Akt and proline-rich Akt substrate 40 levels were significantly increased in the RV compared with the LV in rats but only had an increased trend in mice. Correspondingly, GLUT4 was significantly increased in the RV compared with the LV both in mice and rats. PGC-1α was significantly increased in the RV compared with the LV in mice but only had an increased trend in rats. Moreover, Akt signaling activity and metabolism genes’ expression in the IVS were similar to the RV in mice but to the LV in rats. There were some differences in the activity of Akt signaling and in the levels of metabolism genes among the right ventricle, interventricular septum and left ventricle. Also, the diversity of activity of Akt and metabolism genes between the right ventricle and left ventricle are different between rats and mice. In conclusion, the activity of Akt signaling and the levels of metabolism genes are different among the right ventricle, interventricular septum and left ventricle providing some potential clues for exploring the roles of Akt signaling and cardiac metabolisms in different parts of the heart. Additionally, the differences in Akt activity and metabolism genes’ levels between the right and left ventricles are different between mice and rats, to which we should pay at-tention when using different animal model in heart study.
Keywords: Right ventricle, left ventricle, Akt signaling, cardiac metabolism, rodent
Introduction
Limited information related to right heart
sug-gests that the right ventricle (RV) is an impor -tant contributor and that further understanding of these issues is of pivotal importance [1]. There are important differences in develop-mental origin and postnatal function of left and
right ventricles (LV and RV, respectively) [2, 3]. The LV originates from the first heart field pro
-genitor cells whereas the RV from the second heart field progenitor cells. Functionally, the tol
-erance of the RV for pressure-overload is weak
-er than that of LV. Conv-ersely, the RV can tol-er
-ate more volume-overload than LV. Accordingly, the RV cannot be understood simply by extrapo
-lating data and experience from the LV [2, 3].
Protein kinase B (Akt) is a key molecule in ener-gy metabolism and has been reported to be involved in cardiac hypertrophy, remodeling and
cardiomyocyte proliferation in the LV [4, 5]. A
recent study showed that Akt signaling plays a very important role in the development of the
RV [6]. However, it is still unknown whether
there are differences in Akt activity between
the RV and LV. The relative expression of metab
Rodents are extensively used as human dis-ease models, including for many types of heart disease [7]. Therefore, it is important to know the characteristics of distribution of Akt signal-ing pathway and metabolism genes’ expression
in RV and LV between rat and mouse.
In the present study, we measured the activity of Akt signaling and the levels of metabolic
genes in the RV and LV of mice and rats. We
found the Akt activity and metabolism genes’
levels are different between the RV and LV. The
differences themselves differed between mice and rats.
Materials and methods
Animal model
Male Sprague Dawley rats (200-250 g) fed a
standard diet were anesthetized with sodium
pentobarbital (50 mg/kg) i.p. The hearts were
excised and the RV, interventricular septum (IVS) and LV were dissected on ice. Male mice
(20-25 g) on a C57BL/6 genetic background were housed in groups with 12 h dark/light cycles and free access to food. After
anestheti-zation (sodium pentobarbital 70-80 mg/kg), the RV, IVS and LV were dissected. All experi -ments were in accordance with the Guide for
peptin, pH=8.0). Samples were resolved on 10% SDS-PAGE gels and transferred to PVDF
membranes (Millipore). Membranes were block- ed with 5% non-fat milk in TBST (50 mM Tris,
150 mM NaCl, 0.5 mM Tween-20, pH=7.5) and
then incubated with primary antibodies over-night. Antibodies used in this study were pur-chased from Cell Signaling Technology (CST), BioWorld: total Akt (CST #4691), phospho-Akt (Ser308) (CST #4060), phospho-Akt (Thr473)
(CST #13038), phospho-GSK3β (Ser9) (CST
#5558), LC3A/B (CST #12741), PRAS40 (CST #2691), phospho-PRAS40 (Thr246) (CST #13175), PTEN (CST #9188), phospho-PTEN
(Ser380) (CST #9551), GAPDH (#AP0063), Anti-rabbit IgG, (HRP-linked Antibody) (CST #7074). Image J software (NIH) was used to
perform densitometric analysis (http://rsb.info. nih.gov/ij/).
Quantitative real-time PCR for metabolism re-lated genes and fetal genes
Total RNA was extracted from the LV, IVS and RV using TRIZOL reagent (Invitrogen), according
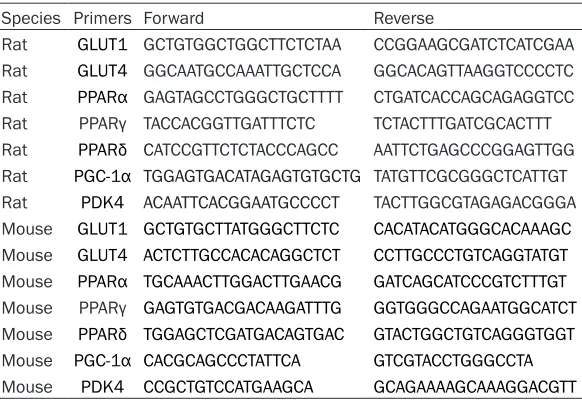
[image:2.612.92.383.83.283.2]to the manufacturer’s protocol. One micro- gram of total RNA from each specimen was reverse transcribed to cDNA using SuperScript Reverse Transcriptase and random hexamers as primers (Invitrogen). Quantitative real-time PCR (qRT-PCR) was performed with an ABI Table 1. Primer sequences of metabolism genes in rat and mouse
Species Primers Forward Reverse
Rat GLUT1 GCTGTGGCTGGCTTCTCTAA CCGGAAGCGATCTCATCGAA Rat GLUT4 GGCAATGCCAAATTGCTCCA GGCACAGTTAAGGTCCCCTC Rat PPARα GAGTAGCCTGGGCTGCTTTT CTGATCACCAGCAGAGGTCC Rat PPARγ TACCACGGTTGATTTCTC TCTACTTTGATCGCACTTT Rat PPARδ CATCCGTTCTCTACCCAGCC AATTCTGAGCCCGGAGTTGG Rat PGC-1α TGGAGTGACATAGAGTGTGCTG TATGTTCGCGGGCTCATTGT Rat PDK4 ACAATTCACGGAATGCCCCT TACTTGGCGTAGAGACGGGA Mouse GLUT1 GCTGTGCTTATGGGCTTCTC CACATACATGGGCACAAAGC Mouse GLUT4 ACTCTTGCCACACAGGCTCT CCTTGCCCTGTCAGGTATGT Mouse PPARα TGCAAACTTGGACTTGAACG GATCAGCATCCCGTCTTTGT Mouse PPARγ GAGTGTGACGACAAGATTTG GGTGGGCCAGAATGGCATCT Mouse PPARδ TGGAGCTCGATGACAGTGAC GTACTGGCTGTCAGGGTGGT Mouse PGC-1α CACGCAGCCCTATTCA GTCGTACCTGGGCCTA Mouse PDK4 CCGCTGTCCATGAAGCA GCAGAAAAGCAAAGGACGTT
Abbreviation: GLUT1, glucose transporter 1; GLUT4, glucose transporter 4; PPARα, peroxisome proliferator-activated receptor α; PPARγ, peroxisome proliferator-activated receptor γ; PPARδ, peroxisome proliferator-activated receptor δ; PGC-1α, peroxisome
proliferator-activated receptor gamma coactivator 1α; PDK4, Pyruvate dehydrogenase lipoamide kinase isozyme.
the Care and Use of Laboratory Animals pub-lished by the US National
Institutes of Health (NIH pub -lication no. 85-23, revised in 1996) and the regulations on mouse welfare and ethics
of Gansu Provincial
Hospit-al. All procedures were app- roved by the Ethics Com- mittee of Gansu Provincial
Hospital (Lanzhou, China).
Western blotting analysis
Heart lysates of mice and
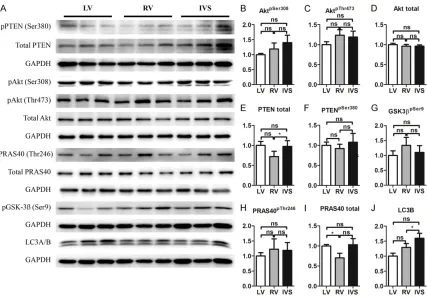
-Figure 1. Akt signaling in LV, RV and IVS in mice. A. Representative Western blot. B-J. Quantifications of A (n=6). Note: Akt, protein kinase B; PTEN, phosphatase and tensin homolog; GSK3β, Glycogen synthase kinase 3β; PRAS40, proline-rich Akt substrate 40 kDa; LC3B, Autophagy marker Light Chain 3B; *P<0.05, versus LV.
Figure 2. Metabolism genes in LV, RV and IVS in mice (n=6). Note: GLUT1, glucose transporter 1; GLUT4, glucose transporter 4; PPARα, peroxisome proliferator-activated receptor α; PPARγ, peroxisome proliferator-activated receptor γ; PPARδ, peroxisome proliferator-activated receptor δ; PGC-1α, peroxisome proliferator-activated receptor gamma coactivator 1α; PDK4, Pyruvate dehydrogenase lipoamide kinase isozyme 4; *P<0.05, **P<0.01, versus LV.
Stepone plus instrument (App- lied Biosystems) using 1 ×I TaQ SYBR green Supermix Kit
(Bio-Bad, Reinach, Switzerland) and
300 nmol/l for forward and reverse primers in a total
vol-ume of 20 μl. The mRNA level
was based on the critical thre- shold (Ct) value. Primer sequ- ences for quantitative real-time PCR were showed in Table 1. Gapdh was used as internal control.
Statistics
[image:3.612.91.367.429.633.2]Diego, CA, USA). p values of <0.05 were
consid-ered statistically significant.
Results
Akt activity is slightly stronger in the RV and
IVS than in the LV in mice
Compared with the LV, phosphorylation of Akt
was slightly higher at both sites 473 and 308 in
the RV and IVS (Figure 1A-C). Total Akt had no
significant differences between the LV, RV and IVS (Figure 1A, 1D). Correspondingly, total PTEN, an upstream inhibitor of Akt activation,
was slightly lower in the RV and IVS than in the LV. Phosphorylated PTEN was a little increased in the IVS but not in the RV compared with the LV (Figure 1A, 1E, 1F). PRAS40, an indicator of Akt activity, had an increasing trend in
phos-phorylated form but not in total form in the RV and IVS compared with the LV (Figure 1A, 1H, 1I). Phosphorylated GSK3β, another down -stream target of Akt, had a similar trend as phosphorylated PRAS40 (Figure 1A, 1G).
Furthermore, LC3B also had an increased trend in the RV and IVS compared with the LV (Figure
1A, 1J). Taken together, there is an increasing trend in Akt signaling indicated by its
phosphor-ylated form and downstreams in the RV and IVS compared with the LV.
Glucose transporter 4 (GLUT4) and peroxi -some proliferator-activated receptor gamma
coactivator 1α (PGC-1α) are more highly ex
-pressed in the RV and IVS than in the LV in
mice
Compared with the LV, GLUT4 was significantly increased in the RV and IVS. The difference in PGC-1α levels between the RV and LV was a trend that was not statistically significant, but the difference between the IVS and LV was sta
-tistically significant. There were no significant
differences in glucose transporter 1 (GLUT1),
peroxisome proliferator-activated receptor α (PPARα), peroxisome proliferator-activated re-ceptor γ (PPARγ), peroxisome proliferator-acti
-vated receptor δ (PPARδ), pyruvate dehydroge
-nase lipoamide ki-nase isozyme 4 (PDK4) between the LV, RV and IVS. However, com
[image:4.612.99.523.73.361.2]-pared with the LV, PPARα, PPARγ, PPARδ and PDK4 had an obvious increasing trend in the RV
and IVS (Figure 2). Taken together, several
met-abolic genes including GLUT4 in the RV and IVS and PGC-1α in the IVS had significantly higher expression than in the LV.
Akt activity is significantly stronger in the RV than in the LV and IVS in rats
Compared with the LV, phosphorylation of Akt was significantly stronger at site 308 but not at 473 in the RV and IVS (Figure 3A-C). Compared
with LV, total Akt had no significant differences in the LV, RV and IVS but it was significantly increased in IVS than in RV (Figure 3A, 3D). Correspondingly, PRAS40, an indicator of Akt
activity, was significantly increased in phos
-phorylation but not total level in the RV com
-pared with the LV. Com-pared with RV, phos -phorylated PRAS40 had a decreasing trend in
the IVS (Figure 3A, 3H, 3I). Also,
phosphorylat-ed GSK3β, another downstream target of Akt, was significantly increased in the IVS but not in the RV compared with the LV (Figure 3A, 3G).
However, both phosphorylated PTEN and total PTEN, upstream of Akt, had no significantly dif
-ferences among the LV, RV and IVS (Figure 3A, 3E, 3F). As in mice, LC3B was a little but not
significantly increased in the RV and IVS com
-pared with the LV (Figure 3A, 3J). Taken
togeth-postnatal physiologic function from the LV. The IVS has the same embryonic origin as the RV, but is more functionally similar to the LV [2, 3].
Mounting evidence has shown that Akt
signal-ing plays a vital role in LV remodelsignal-ing through
effects on energy metabolism [5]. Recently, altered Akt signaling has been reported to
affect RV development [6]. However, it still
unclear that the differences in Akt signaling and the expression of metabolism genes
between the LV, RV and IVS in mice and rats. Here we report that there are differences in Akt
signaling and the expression of metabolism
genes between the LV, RV and IVS in mice and
rats.
Compared with the LV, Akt signaling has an increased trend but not significantly in the RV and IVS of mice. However, in rats, Akt signaling is significantly stronger in the RV but not in the IVS than the LV. Meanwhile, metabolism genes including GLUT4 and PGC-1α are consistently increased in the RV compared with the LV.
Previous studies have shown that the oxygen
demand of the RV is physiologically different from the LV [8] and that the energy metabolism of the RV is different from the LV under some
[image:5.612.92.367.72.271.2]pathological conditions. In view of the fact that Akt plays a central role in regulating heart Figure 4. Metabolism genes in LV, RV and IVS in rats (n=5). Note: GLUT1,
glucose transporter 1; GLUT4, glucose transporter 4; PPARα, peroxisome proliferator-activated receptor α; PPARγ, peroxisome proliferator-activated receptor γ; PPARδ, peroxisome proliferator-activated receptor δ; PGC-1α, peroxisome proliferator-activated receptor gamma coactivator 1α; PDK4, Pyruvate dehydrogenase lipoamide kinase isozyme 4; *P<0.05, **P<0.01, versus LV; #P<0.05, versus RV.
er, Akt activity indicated by its phosphorylated form and
down-stream targets was significantly stronger in the RV than in the IVS and LV.
Higher expression of metabo -lism genes in the RV than in the
LV and IVS in rats
Compared with the LV and IVS, GLUT4 was significantly increased in the RV. There was a
strong trend towards increased
GLUT1, PPARα, PPARγ, PPARδ, PGC-1α and PDK4 in the RV compared with the LV and IVS.
In a word, there were some dif-ferences in the expression of
metabolism genes among LV, RV and IVS (Figure 4).
Discussion
The RV is very different in
metabolism by directly or indirectly controlling GLUT4 [9], GSK-3β [10], and mitochondrial function [11, 12], it could be reasonable that increased Akt signaling is responsible for
increased GLUT4 and PGC-1α in the RV com
-pared with the LV. Collectively, the RV relies more on Akt signaling than LV under physiologi -cal status which may be related to its physiolog-ical features [3].
Although both mice and rats are rodents, there are really some differences in some signaling molecules including G protein-coupled receptor
78 (GPR78), inositol-requiring enzyme 1 (IRE1),
sterol regulatory element-binding protein 1 (SREBP-1) and sodium-glucose cotransporter-2 (SGLT2) et al. between rats and mice [13-18]. In
this study, we found that the IVS has Akt activity similar to the LV in rats whereas it is more simi
-lar to the RV in mice. Rats also differed from
mice in the relative levels of several
metabo-lism genes including GLUT4 and PGC-1α between the RV, IVS and LV. One of the possible
reasons leading to these differences is genetic discrepancy between rats and mice [19, 20].
These findings suggest that we should pay
attention to the diversity of these two species which are frequently used as an experimental models in heart study [7].
In conclusion, the present study shows differ-ences in Akt signaling activity and metabolism
genes levels between the LV, RV and IVS, as well as between mice and rats. Our findings
may be useful for future heart studies in rodent models.
Acknowledgements
This work was supported by the National
Natural Science Foundation of China
(8146-0072) grants to Yunshan Cao. Thanks to Colin Platt from Cardiovascular Division of
Massachusetts General Hospital (MGH) and Harvard Medical School for providing language
help and proof reading the article. Disclosure of conflict of interest
None.
Address correspondence to: Drs. Yunshan Cao and Nan Wang, Department of Cardiology, Gansu Provincial Hospital, 204 Donggangxilu, Lanzhou 730000, China. Tel: 15715161787; Fax:
+86-931-8281921; E-mail: [email protected] (YSC); Tel: +86-13893127771; Fax: +86-931-8281651; [email protected] (NW)
References
[1] Mehra MR, Park MH, Landzberg MJ, Lala A and Waxman AB. Right heart failure: toward a com-mon language. Pulm Circ 2013; 3: 963-967. [2] Haddad F, Doyle R, Murphy DJ and Hunt SA.
Right ventricular function in cardiovascular disease, part II: pathophysiology, clinical im-portance, and management of right ventricular failure. Circulation 2008; 117: 1717-1731. [3] Haddad F, Hunt SA, Rosenthal DN and Murphy
DJ. Right ventricular function in cardiovascular disease, part I: Anatomy, physiology, aging, and functional assessment of the right ventri-cle. Circulation 2008; 117: 1436-1448. [4] Altomare DA and Khaled AR. Homeostasis and
the importance for a balance between AKT/ mTOR activity and intracellular signaling. Curr Med Chem 2012; 19: 3748-3762.
[5] Sussman MA, Volkers M, Fischer K, Bailey B, Cottage CT, Din S, Gude N, Avitabile D, Alvarez R, Sundararaman B, Quijada P, Mason M, Konstandin MH, Malhowski A, Cheng Z, Khan M and McGregor M. Myocardial AKT: the omni-present nexus. Physiol Rev 2011; 91: 1023-1070.
[6] Luo W, Zhao X, Jin H, Tao L, Zhu J, Wang H, Hemmings BA and Yang Z. Akt1 signaling coor-dinates BMP signaling and beta-catenin activi-ty to regulate second heart field progenitor de-velopment. Development 2015; 142: 732-742. [7] Zaragoza C, Gomez-Guerrero C, Martin-Ventura
JL, Blanco-Colio L, Lavin B, Mallavia B, Tarin C, Mas S, Ortiz A and Egido J. Animal models of cardiovascular diseases. J Biomed Biotechnol 2011; 2011: 497841.
[8] Zong P, Tune JD and Downey HF. Mechanisms of oxygen demand/supply balance in the right ventricle. Exp Biol Med (Maywood) 2005; 230: 507-519.
[9] Brownsey RW, Boone AN and Allard MF. Actions of insulin on the mammalian heart: metabo-lism, pathology and biochemical mechanisms. Cardiovasc Res 1997; 34: 3-24.
[10] Markou T, Cullingford TE, Giraldo A, Weiss SC, Alsafi A, Fuller SJ, Clerk A and Sugden PH. Glycogen synthase kinases 3alpha and 3beta in cardiac myocytes: regulation and conse-quences of their inhibition. Cell Signal 2008; 20: 206-218.
[12] Sussman MA. Mitochondrial integrity: preser-vation through Akt/Pim-1 kinase signaling in the cardiomyocyte. Expert Rev Cardiovasc Ther 2009; 7: 929-938.
[13] Bai Y and Sanderson MJ. The contribution of Ca2+ signaling and Ca2+ sensitivity to the regulation of airway smooth muscle contrac-tion is different in rats and mice. Am J Physiol Lung Cell Mol Physiol 2009; 296: L947-958. [14] Francis C, Natarajan S, Lee MT, Khaladkar M,
Buckley PT, Sul JY, Eberwine J and Kim J. Divergence of RNA localization between rat and mouse neurons reveals the potential for rapid brain evolution. BMC Genomics 2014; 15: 883.
[15] Swindell WR. Dietary restriction in rats and mice: a meta-analysis and review of the evi-dence for genotype-dependent effects on lifes-pan. Ageing Res Rev 2012; 11: 254-270. [16] Shinohara M, Ji C and Kaplowitz N. Differences
in betaine-homocysteine methyltransferase ex-pression, endoplasmic reticulum stress re-sponse, and liver injury between alcohol-fed mice and rats. Hepatology 2010; 51: 796-805.
[17] Downs SM. Mouse versus rat: Profound differ-ences in meiotic regulation at the level of the isolated oocyte. Mol Reprod Dev 2011; 78: 778-794.
[18] Sabolic I, Vrhovac I, Eror DB, Gerasimova M, Rose M, Breljak D, Ljubojevic M, Brzica H, Sebastiani A, Thal SC, Sauvant C, Kipp H, Vallon V and Koepsell H. Expression of Na+-D-glucose cotransporter SGLT2 in rodents is kid-ney-specific and exhibits sex and species dif-ferences. Am J Physiol Cell Physiol 2012; 302: C1174-1188.
[19] Jensen-Seaman MI, Furey TS, Payseur BA, Lu Y, Roskin KM, Chen CF, Thomas MA, Haussler D and Jacob HJ. Comparative recombination rates in the rat, mouse, and human genomes. Genome Res 2004; 14: 528-538.