Original Article
Expression of metabolism-related proteins in
triple-negative breast cancer
Min-Ju Kim, Do-Hee Kim, Woo-Hee Jung, Ja-Seung Koo
Department of Pathology, Severance Hospital, Brain Korea 21 PLUS Project for Medical Science, Yonsei University College of Medicine, Seoul, South Korea
Received November 18, 2013; Accepted December 12, 2013;Epub December 15, 2013; Published January 1, 2014
Abstract: To investigate the dominant metabolic type of triple-negative breast cancer (TNBC) and evaluate its clinical implication through analysis of protein expression related to glycolysis, glutaminolysis, and mitochondrial oxidative phosphorylation. Tissue samples from 129 patients with TNBC who underwent mastectomy due to invasive breast cancer from 2000 to 2005 were prepared for tissue microarray. By immunohistochemical staining of the tissue microarrays, the markers of glycolysis-related proteins (Glut-1, CAIX, MCT4), glutaminolysis-related proteins (GLS1, GDH, ASCT2), and mitochondrial enzymes (ATP synthase, SDHA and SDHB) were analyzed. Based on the results, the
metabolic phenotypes were defined based on positivity for more than two of three markers for each phenotype as
follows: glycolysis type (Glut-1, CAIX and MCT4), glutaminolysis type (GLS1, GDH and ASCT2) and mitochondrial type (ATP synthase, SDHA and SDHB). The percentages of samples with metabolic phenotypes of tumor and stroma of TNBC were as follows: for tumor, mitochondrial type (85.3%) > glutaminolysis type (67.4%) > glycolysis type (63.0%); and for stroma, glutaminolysis type (37.2%) > glycolysis type (16.3%) > mitochondrial type (14.0%). The most com-mon metabolic phenotype of TNBC was glycolysis type for basal-like type and non-glycolysis type for non-basal-like
type (p=0.047). The correlation between glutaminolysis and mitochondrial type was statistically significant in both
tumor and stroma (p<0.001). In conclusion, tumor cells of TNBC express glycolysis and mitochondrial metabolism-related proteins. Glycolysis type is the most common phenotype of basal-like type, and reversely, non-glycolysis type is the most common phenotype of non basal-like type.
Keywords: Breast, glycolysis, glutaminolysis, mitochondria, triple-negative breast cancer
Introduction
Breast cancer is one of the most heteroge-neous tumors in terms of clinical behavior, out-come and treatment response. Consistent efforts are necessary to classify heteroge-neous breast cancer. One approach has been gene profiling studies, which classify breast cancer into five subtypes with distinct molecu-lar signatures and clinical implications: normal breast-like, luminal A, luminal B, HER-2, and basal-like phenotypes [1, 2]. Aside from these five subtypes, breast cancer negative for estro-gen receptor (ER), progesterone receptor (PR) and HER-2 is defined as triple-negative breast cancer (TNBC) [3]. As TNBC is negative for these receptors, there is no effective targeted therapy, and the tumor is heterogeneous. TNBC can be classified into basal-like (39-54%),
analy-sis of protein expression associated with glycolysis, glutaminolysis and mitochondrial oxidative phosphorylation and to elucidate the implications of our findings.
Materials and methods
Patient selection
The subjects of this study included patients with TNBC who underwent mastectomy after the diagnosis of breast cancer in Yonsei University Severance Hospital from January 2000 to December 2005. The patients who received hormone therapy or chemotherapy prior to the surgery were excluded. This study was approved by the Institutional Review Board of Yonsei University Severance Hospital. TNBC was defined as ER-, PR- and HER-2-negative as determined by immunohistochemistry (IHC) and by fluorescence in situ hybridization (FISH). A cut-off value of 1% or more positively stained nuclei was used to define ER and PR positivity [11]. HER-2 staining was analyzed according to the American Society of Clinical Oncology (ASCO)/College of American Pathologists (CAP) guidelines using the following categories: 0=no immunostaining; 1+=weak incomplete
membra-nous staining, less than 10% of tumor cells; 2+=complete membranous staining, either
uni-form or weak in at least 10% of tumor cells; and 3+=uniform intense membranous staining in at
least 30% of tumor cells [12]. HER-2 immunos-taining was considered positive when strong
(3+) membranous staining was observed,
whereas cases with 0 to 1+ were regarded as
negative. The cases showing 2+ HER-2
expres-sion were evaluated for HER-2 amplification by FISH. All the cases were retrospectively revi-ewed by a breast pathologist (Koo JS), and his-tological analysis was conducted with hema-toxylin and eosin (H&E)-stained slides. The histological grade was assessed using the Nottingham grading system [13]. Clinicopa-thologic parameters evaluated in each case included patient age at initial diagnosis, lymph node metastasis, tumor recurrence, distant metastasis, and patient survival.
Tissue microarray
On H&E-stained slides of tumors, a representa-tive area was selected, and the corresponding spot was marked on the surface of the paraffin block. Using a biopsy needle, the selected area was punched out, and a 3-mm tissue core was placed into a 6 × 5 recipient block. The tissue of the invasive tumor was extracted. More than two tissue cores were extracted to minimize the extraction bias. Each tissue core was assigned with a unique tissue microarray location num-ber that was linked to a database containing other clinicopathologic data.
Immunohistochemistry
The antibodies used for immunohistochemistry in this study are shown in Table 2. All the immu-Table 1. Key proteins in cancer metabolism
Category Function
Glycolysis-related
Glut-1 Transports glucose into cells
CAIX Neutralizes lactate-induced acidification during glycolysis
MCT4 Transports lactate produced by glycolysis out of cells Glutaminolysis-related
GLS1 Converts glutamine to glutamate GDH Converts glutamate to α-ketoglutarate
ASCT2 Transports glutamine into cells Mitochondrial metabolism-related
ATP synthase Synthesizes ATP from ADP in mitochondria
SDHA A component of respiratory complex II in mitochondria; oxidates succinate to fumarate during the citric acid cycle
SDHB A component of respiratory complex II in mitochondria; oxidates succinate to fumarate during the citric acid cycle
[image:2.612.90.528.82.280.2]nohistochemical assays were conducted with formalin-fixed, paraffin-embedded tissue sec-tions. Briefly, 5-μm-thick sections were obtained with a microtome, transferred onto adhesive slides, and dried at 62°C for 30 minutes. After incubation with primary antibodies, immunode-tection was performed with biotinylated anti-mouse immunoglobulin, followed by peroxi-dase-labeled streptavidin using a labeled streptavidin biotin kit with 3,3’-diaminobenzi-dine chromogen as the substrate. The primary antibody incubation step was omitted in the negative control. Slides were counterstained with Harris hematoxylin.
Interpretation of immunohistochemical stain-ing
[image:3.612.93.516.86.498.2]All immunohistochemical markers were asse-ssed by light microscopy. The IHC stain results for androgen receptor (AR), cytokeratin (CK) 5/6, interleukin (IL)-8, signal transducer and activator of transcription (STAT)-1 and gamma-glutamyltransferase (GGT)-1 were considered positive when more than 10% of the tumor cells were stained. The IHC stain results for epider-mal growth factor receptor (EGFR), claudin-3, claudin-4, claudin-7 and E-cadherin were clas-sified into negative, weak, moderate and Table 2. Clone, dilution, and source of antibodies used
Antibody Clone Dilution Company
Molecular phenotype-related
Basal-like-related
Cytokeratin 5/6 D5/16B4 1:50 DAKO, Glostrup, Denmark
EGFR EGFR.25 1:50 Novocastra, Newcastle, UK
Claudin-low-related
Claudin 3 Polyclonal 1:50 Abcam, Cambridge, UK
Claudin 4 Polyclonal 1:100 Abcam, Cambridge, UK
Claudin 7 Polyclonal 1:100 Abcam, Cambridge, UK
E-cadherin 36B5 1:100 Novocastra, Newcastle, UK
Molecular apocrine-related
Androgen receptor AR441 1:50 DAKO, Glostrup, Denmark
GGT1 IgG2A 1:50 Abcam, Cambridge, UK
Immune-related
STAT1 Polyclonal 1:100 Abcam, Cambridge, UK
IL-8 807 1:50 Abcam, Cambridge, UK
Proliferation-related
Ki-67 MIB-1 1:150 DAKO, Glostrup, Denmark
Metabolic phenotype-related
Glycolysis-related
Glut-1 SPM498 1:200 Abcam, Cambridge, UK
CAIX Polyclonal 1:100 Abcam, Cambridge, UK
MCT4 Polyclonal 1:100 Santa Cruz, CA, USA
Glutaminolysis-related
GLS1 Polyclonal 1:50 Abcam, Cambridge, UK
GDH Polyclonal 1:100 Abcam, Cambridge, UK
ASCT2 Polyclonal 1:100 Abcam, Cambridge, UK
Mitochondrial metabolism-related
ATP synthase 15H4C4 1:100 Abcam, Cambridge, UK
SDHA 2E3GC12FB2AE2 1:100 Abcam, Cambridge, UK
SDHB 21A11AE7 1:100 Abcam, Cambridge, UK
Table 3. Clinicopathologic features according to subtype of TNBC
Parameter Total N=129 (%) Basal-like type n=54 (%) Molecular apocrine type n=11 (%) Claudin-low type n=8 (%) Immune-related type n=6 (%) Mixed type n=28 (%) n=22 (%)Null type P-value
Age (years, mean±SD) 48.5±12.5 47.0±11.3 51.3±15.4 49.8±8.2 52.3±18.7 49.3±12.9 48.4±13.4 0.843
Histologic grade 0.396
I 3 (2.3) 0 (0.0) 0 (0.0) 0 (0.0) 0 (0.0) 2 (7.1) 1 (4.5) II 37 (28.7) 16 (29.6) 6 (54.5) 3 (37.5) 1 (16.7) 7 (25.0) 4 (18.2) III 89 (69.0) 38 (70.4) 5 (45.5) 5 (62.5) 5 (83.3) 19 (67.9) 17 (77.3)
Tumor stage 0.550
T1 49 (38.0) 24 (44.4) 5 (45.5) 3 (37.5) 1 (16.7) 9 (32.1) 7 (31.8) T2 78 (60.5) 29 (53.7) 5 (45.5) 5 (62.5) 5 (83.3) 19 (67.9) 15 (68.2) T3 2 (1.6) 1 (1.9) 1 (9.1) 0 (0.0) 0 (0.0) 0 (0.0) 0 (0.0)
Nodal stage 0.950
N0 85 (65.9) 40 (74.1) 6 (54.5) 5 (83.3) 5 (83.3) 17 (60.7) 12 (54.5) N1 34 (26.4) 10 (18.5) 4 (36.4) 3 (37.5) 1 (16.7) 8 (28.6) 8 (36.4) N2 7 (5.4) 3 (5.6) 1 (9.1) 0 (0.0) 0 (0.0) 2 (7.1) 1 (4.5) N3 3 (2.3) 1 (1.9) 0 (0.0) 0 (0.0) 0 (0.0) 1 (3.6) 1 (4.5)
Central acellular zone 0.216
No 98 (76.0) 37 (68.5) 11 (100.0) 6 (75.0) 6 (100.0) 21 (75.0) 17 (77.3) Yes 31 (24.0) 17 (31.5) 0 (0.0) 2 (25.0) 0 (0.0) 7 (25.0) 5 (22.7)
Central necrotic zone 0.874
No 120 (93.0) 50 (92.6) 11 (100.0) 7 (87.5) 6 (100.0) 26 (92.9) 20 (90.9) Yes 9 (7.0) 4 (7.4) 0 (0.0) 1 (12.5) 0 (0.0) 2 (7.1) 2 (9.1)
Central fibrotic zone 0.346
No 103 (79.8) 40 (74.1) 11 (100.0) 6 (75.0) 6 (100.0) 22 (78.6) 18 (81.8) Yes 26 (20.2) 14 (25.9) 0 (0.0) 2 (25.0) 0 (0.0) 6 (21.4) 4 (18.2)
Lymphocytic infiltration 0.035
No 97 (75.2) 40 (74.1) 8 (72.7) 7 (87.5) 2 (33.3) 19 (67.9) 21 (95.5) Yes 32 (24.8) 14 (25.9) 3 (27.3) 1 (12.5) 4 (66.7) 9 (32.1) 1 (4.5)
Tumor cell discohesiveness 0.096
No 120 (93.0) 52 (96.3) 8 (72.7) 7 (87.5) 6 (100.0) 27 (96.4) 20 (90.9) Yes 9 (7.0) 2 (3.7) 3 (27.3) 1 (12.5) 0 (0.0) 1 (3.6) 2 (9.1)
Tumor margin 0.294
Expanding 110 (85.3) 48 (88.9) 8 (72.7) 7 (87.5) 6 (100.0) 25 (89.3) 16 (72.7)
Infiltrative 19 (14.7) 6 (11.1) 3 (27.3) 1 (12.5) 0 (0.0) 3 (10.7) 6 (27.3)
Apocrine differentiation 0.031
No 105 (81.4) 46 (85.2) 5 (45.5) 7 (87.5) 4 (66.7) 23 (82.1) 20 (90.9) Yes 24 (18.6) 8 (14.8) 6 (54.5) 1 (12.5) 2 (33.3) 5 (17.9) 2 (9.1)
Ki-67 LI (%, mean±SD) 28.1±23.4 33.5±24.8 6.0±4.8 27.3±27.8 38.6±27.5 29.5±22.1 21.6±17.3 0.006
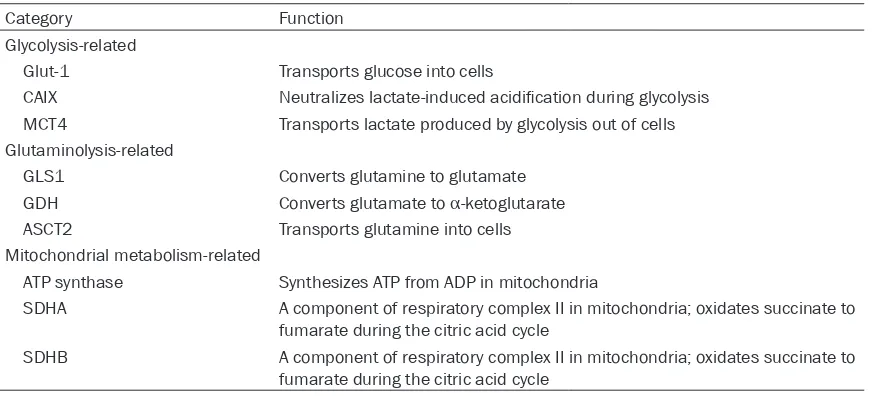
Table 4. Metabolic phenotypes according to subtype of TNBC
Parameter Total N=129 (%) Basal-like type n=54 (%) Molecular apocrine type n=11 (%) Claudin-low type n=8 (%) Immune-related type n=6 (%) Mixed type n=28 (%) nNull type =22 (%) P-value
Tumoral phenotype 0.301
Glycolysis type 69 (53.5) 34 (63.0) 4 (36.4) 4 (50.0) 3 (50.0) 16 (57.1) 8 (36.4)
Non-glycolysis type 60 (46.5) 20 (37.0) 7 (63.6) 4 (50.0) 3 (50.0) 12 (42.9) 14 (63.6)
Stromal phenotype 0.385
Glycolysis type 21 (16.3) 10 (18.5) 0 (0.0) 1 (12.5) 0 (0.0) 7 (25.0) 3 (13.6)
Non-glycolysis type 108 (83.7) 44 (81.5) 11 (100.0) 7 (87.5) 6 (100.0) 21 (75.0) 19 (86.4)
Tumoral phenotype 0.496
Glutaminolysis type 87 (67.4) 37 (68.5) 5 (45.5) 5 (65.5) 3 (50.0) 21 (75.0) 16 (72.7) Non-glutaminolysis type 42 (32.6) 17 (31.5) 6 (54.5) 3 (37.5) 3 (50.0) 7 (25.0) 6 (27.3)
Stromal phenotype 0.545
Glutaminolysis type 48 (37.2) 17 (31.5) 4 (36.4) 5 (62.5) 3 (50.0) 12 (42.9) 7 (31.8) Non-glutaminolysis type 81 (62.8) 37 (68.5) 7 (63.6) 3 (37.5) 3 (50.0) 16 (57.1) 15 (68.2)
Tumoral phenotype 0.303
Mitochondrial type 110 (85.3) 48 (88.9) 8 (72.7) 7 (87.5) 4 (66.7) 26 (92.9) 17 (77.3) Non-mitochondrial type 19 (14.7) 6 (11.1) 3 (27.3) 1 (12.5) 2 (33.3) 2 (7.1) 5 (22.7)
Stromal phenotype 0.577
Mitochondrial type 18 (14.0) 10 (18.5) 2 (18.2) 0 (0.0) 0 (0.0) 4 (14.3) 2 (9.1)
Non-mitochondrial type 111 (86.0) 44 (81.5) 9 (81.8) 8 (100.0) 6 (100.0) 24 (85.7) 20 (90.9)
intense expression. The cases with moderate or intense expression were considered posi-tive. The assessment of immunohistochemical staining of metabolism-related proteins was based on the product of the proportion of stained cells and the immunostaining intensity. The grades of the proportion of stained cells were 0: negative, 1: <30% of positive cells, and 2: ≥30% of positive cells, while the grades of immunostaining intensity were 0: negative, 1: weak, 2: moderate, and 3, strong. The product of the proportion of stained cells and the immu-nostaining intensity was judged as negative for 0-1, weakly positive for 2-4, and highly positive for 5-6. Results for Ki-67 were scored by count-ing the positively stained nuclei and expresscount-ing this number as a percentage of the total tumor cell number [Ki-67 labeling index (LI)].
Molecular classification of TNBC according to IHC
According to the results of IHC, TNBC was sub-classified into basal-like type (CK5/6-positive and/or EGFR-positive), molecular apocrine type
(AR-positive and/or GGT-1-positive), claudin-low
type (claudin 3-, claudin 4-, claudin 7-negative
and/or E-cadherin-negative), immune-related type (IL-8-negative and stromal STAT1-positive),
mixed type (two or more types), and null type
(none of these).
Metabolic classification of TNBC according to IHC
Metabolic phenotypes were classified as fol-lows, based on the expression of metabolism-related proteins: glycolysis type (positive for two or more of Glut-1, CAIX and MCT-4),
gluta-minolysis type (positive for two or more of
GLS1, GDH and ASCT2), and mitochondrial type
(positive for two or more of ATP synthase, SDHA and SDHB).
Statistical analysis
Data were processed using SPSS for Windows, version 12.0 (SPSS Inc., Chicago, IL, USA). Student’s t and Fisher’s exact tests were used to examine any difference in continuous and categorical variables, respectively. The limit for statistical significance was set at P=0.05. Kaplan-Meier survival curves and log-rank sta-tistics were employed to evaluate time to tumor metastasis and time to survival. Multivariate regression analysis was performed using Cox proportional hazards model.
Results
Clinicopathologic characteristics of TNBC
[image:6.612.95.520.76.289.2]ed type (6%). In addition, there was mixed type
[image:7.612.98.520.69.332.2](28%) and null type (22%). Lymphocytic infiltra- immunohistochemical results formetabolism-related proteins is shown in Figure 1. Figure 2. Immunohistochemical expression of metabolism-related proteins in basal-like and non-basal-like TNBC. The expression of glycolysis-related proteins is high in basal-like type, while the expression is low in non-basal-like type.
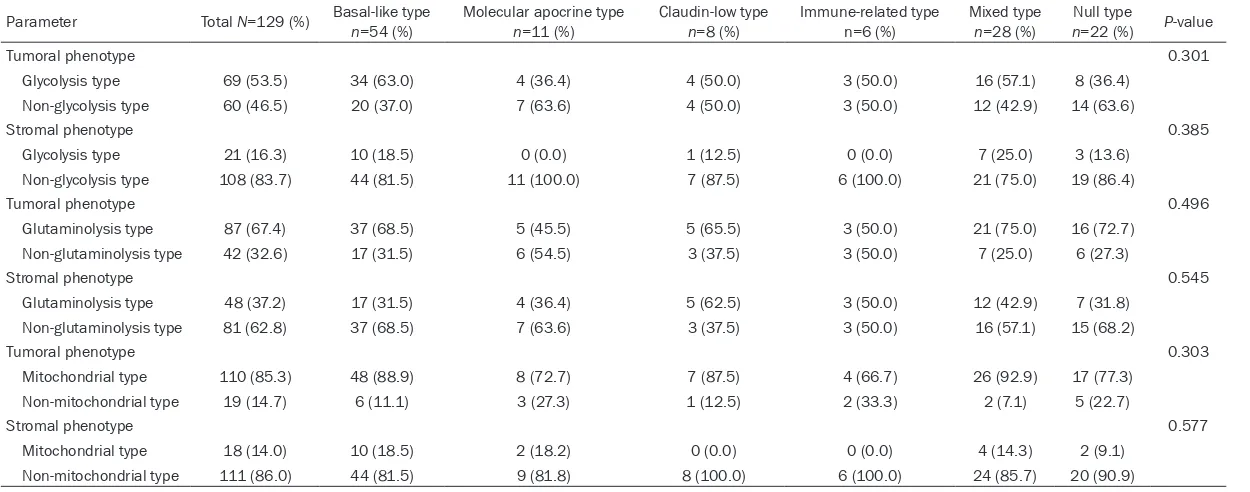
Table 5. Comparison of metabolic phenotypes between basal-like type and non-basal-basal-like type
Parameter Basal-like type n=79 (%) Non-basal-like type n=50 (%) p-value
Tumoral phenotype 0.047
Glycolysis type 48 (60.8) 21 (42.0) Non-glycolysis type 31 (39.2) 29 (58.0)
Stromal phenotype 0.148
Glycolysis type 16 (20.3) 5 (10.0) Non-glycolysis type 63 (79.7) 45 (90.0)
Tumoral phenotype 0.565
Glutaminolysis type 55 (69.6) 32 (64.0) Non-glutaminolysis type 24 (30.4) 18 (36.0)
Stromal phenotype 0.455
Glutaminolysis type 27 (34.2) 21 (42.0) Non-glutaminolysis type 52 (65.8) 29 (58.0)
Tumoral phenotype 0.077
Mitochondrial type 71 (89.9) 39 (78.0) Non-mitochondrial type 8 (10.1) 11 (22.0)
Stromal phenotype 0.191
Mitochondrial type 14 (17.7) 4 (8.0) Non-mitochondrial type 65 (82.3) 46 (92.0)
tion was highest in the immune-related type and lowest in the null type (p=0.035), while apocrine dif-ferentiation was most commonly observed in the molecular apocrine type but rarely in the null type (p=0.031). Ki-67 labeling index was highest in immune-related type and lowest in molecular apocrine type (p=0.006, Table 3).
Metabolic phenotypes according to molecular subtype of TNBC
[image:7.612.88.352.418.681.2]Table 6. Clinicopathologic characteristics according to the metabolic phenotype in tumor and stroma
Parameter
Tumoral phenotype Stromal phenotype Tumoral phenotype Stromal phenotype Tumoral phenotype Stromal phenotype
Glycoly-sis type n=69 (%)
Non- glyco-lysis type n=60 (%)
P-val-ue*
Glycoly-sis type Non-gly-colysis type
P-val-ue*
Glutami-nolysis type
Non- glutami-nolysis type
P-val-ue*
Glutami-nolysis type
Non- glutami-nolysis type
P-val-ue*
Mito-chondrial type
Non- mito-chondrial type
P-val-ue*
Mito-chondrial type
Non- mitoch-ondrial type
P-val-ue*
Age (years) 4.926 2.166 2.838 1.452 3.144 4.464
≤35 12 (17.4) 12 (20.0) 2 (9.5) 22 (20.4) 18 (20.7) 6 (14.3) 6 (12.5) 18 (22.2) 22 (20.0) 2 (10.5) 4 (22.2) 20 (18.0) >35 57 (82.6) 48 (80.0) 19 (90.5) 86 (79.6) 69 (79.3) 36 (85.7) 42 (87.5) 63 (77.8) 88 (80.0) 17 (89.5) 14 (77.8) 91 (82.0) Histologic
grade
0.120 4.806 2.550 6.000 1.074 2.550
I/II 15 (21.7) 25 (41.7) 7 (33.3) 33 (30.6) 25 (28.7) 15 (35.7) 15 (31.3) 25 (30.9) 37 (33.6) 3 (15.8) 7 (38.9) 33 (29.7) III 54 (78.3) 35 (58.3) 14 (66.7) 75 (69.4) 62 (71.3) 27 (64.3) 33 (68.8) 56 (69.1) 73 (66.4) 16 (84.2) 11 (61.1) 78 (70.3)
Tumor stage 5.136 0.894 2.670 0.234 0.054 0.222
T1 27 (39.1) 22 (36.7) 11 (52.4) 38 (35.2) 31 (35.6) 18 (42.9) 24 (50.0) 25 (30.9) 47 (42.7) 2 (10.5) 11 (61.1) 38 (34.2) T2/T3 42 (60.9) 38 (63.3) 10 (47.6) 70 (64.8) 56 (64.4) 24 (57.1) 24 (50.0) 56 (69.1) 63 (57.3) 17 (89.5) 7 (38.9) 73 (65.8)
Nodal stage 0.102 4.812 1.416 3.408 3.612 4.734
N0 52 (75.4) 33 (55.0) 13 (61.9) 72 (66.7) 54 (62.1) 31 (73.8) 30 (62.5) 55 (67.9) 71 (64.5) 14 (73.7) 11 (61.1) 74 (66.7) N1/N2/N3 17 (24.6) 27 (45.0) 8 (38.1) 36 (33.3) 33 (37.9) 11 (26.2) 18 (37.5) 26 (32.1) 39 (35.5) 5 (26.3) 7 (38.9) 37 (33.3) Lymphocytic
infiltration
5.034 1.676 0.792 5.004 6.000 1.428
Absent 51 (73.9) 46 (76.7) 18 (85.7) 79 (73.1) 69 (79.3) 28 (66.7) 37 (77.1) 60 (74.1) 83 (75.5) 14 (73.7) 16 (88.9) 81 (73.0) Present 18 (26.1) 14 (23.3) 3 (14.3) 29 (26.9) 18 (20.7) 14 (33.3) 11 (22.9) 21 (25.9) 27 (24.5) 5 (26.3) 2 (11.1) 30 (27.0) Tumor cell
discohesive-ness
0.072 2.124 2.826 4.356 6.000 6.000
No 68 (98.6) 52 (86.7) 21 (100) 99 (91.7) 82 (94.3) 38 (90.5) 44 (91.7) 76 (93.8) 102 (92.7) 18 (94.7) 17 (94.4) 103 (92.8) Yes 1 (1.4) 8 (13.3) 0 (0.0) 9 (8.3) 5 (5.7) 4 (9.5) 4 (8.3) 5 (6.2) 8 (7.3) 1 (5.3) 1 (5.6) 8 (7.2) Tumor
margin
0.282 4.422 2.562 6.000 6.000 1.824
Expanding 63 (91.3) 47 (78.3) 19 (90.5) 91 (84.3) 76 (87.4) 34 (81.0) 41 (85.4) 69 (85.2) 94 (85.5) 16 (84.2) 14 (77.8) 96 (86.5)
Infiltrative 6 (8.7) 13 (21.7) 2 (9.5) 17 (15.7) 11 (12.6) 8 (19.0) 7 (14.6) 12 (14.8) 16 (14.5) 3 (15.8) 4 (22.2) 15 (13.5) Apocrine
dif-ferentiation
4.926 3.252 3.786 3.870 4.524 6.000
No 57 (82.6) 48 (80.0) 16 (76.2) 89 (82.4) 72 (82.8) 33 (78.6) 38 (79.2) 67 (82.7) 90 (81.8) 15 (78.9) 15 (83.3) 90 (81.1) Yes 12 (17.4) 12 (20.0) 5 (23.8) 19 (17.6) 15 (17.2) 9 (21.4) 10 (20.8) 14 (17.3) 20 (18.2) 4 (21.1) 3 (16.7) 21 (18.9) Ki-67 LI (%,
mean±SD) 29.9±23.6 26.1±23.1 2.142 31.7±19.1 27.4±24.1 2.664 26.6±22.9 31.2±24.3 1.812 33.8±25.6 24.8±21.4 0.204 29.2±23.4 21.9±22.8 1.272 29.9±23.1 27.8±23.5 4.374
When the metabolic phenotype of TNBC was investigated between basal-like type and non-basal-like type, a difference in glycolysis status was observed; the glycolysis type was higher in the basal-like type of tumor, while non-glycoly-sis type was higher in the non-basal-like type (p=0.047). In the mitochondrial type of tumor, basal-like type was more frequent than non-basal-like type (p=0.077, Table 5).
Correlation of metabolic phenotypes in tumor and stroma
The analysis of metabolic phenotypes of tumor and stroma suggested significant correlation between glycolysis and mitochondrial type of stroma (p<0.001), glutaminolysis and mito-chondrial type of stroma (p<0.001), and gluta-minolysis and mitochondrial type of tumor (p<0.001) (Figure 2).
Clinicopathologic characteristics according to the metabolic phenotype in tumor and stroma
The analysis of correlation between metabolic phenotypes of tumor and stroma and clinico-pathologic characteristics suggested that tumor cell discohesiveness was increased, though not statistically significant, in
non-gly-colysis type (p=0.072), and the mitochondrial type of tumor showed lower T stage (p=0.054, Table 6).
The analysis of correlation between metabolic phenotypes and disease-free survival (DFS) and overall survival (OS) found no statistically significant factors (Table 7).
Discussion
[image:9.612.92.523.96.371.2]In this study, we investigated the expression patterns of proteins related to cancer metabo-lism including glycolysis, glutaminolysis and mitochondrial metabolism. The analysis of met-abolic phenotypes based on surrogate IHC sug-gested that the most common metabolic phe-notype of TNBC are mitochondrial type (85.3%), followed by glutaminolysis type (67.4%), and glycolysis type (63.0%). The well-known Warburg effect [14] involves a metabolic shift from mitochondrial oxidative phosphorylation to aerobic glycolysis. In this study, cancer cells of TNBC showed a higher ratio of mitochondrial type to glycolysis type. A previous study report-ed that the prreport-edominant energy metabolism takes different forms such as glycolysis or oxi-dative phosphorylation depending on tumor Table 7. Univariate analysis of the metabolic phenotypes in TNBC and disease-free survival or overall survival by log-rank test
Parameter Number of patients/recurrence/death
Disease-free survival Overall survival Mean survival
(95% CI) months P-value (95% CI) monthsMean survival P-value
Tumoral phenotype 0.636 0.126
Glycolysis type 69/6/4 94 (89-100) 97 (93-102)
Non-glycolysis type 60/7/9 91 (84-98) 89 (81-96)
Stromal phenotype 0.421 0.463
Glycolysis type 21/1/1 63 (59-66) 64 (62-65)
Non-glycolysis type 108/12/12 92 (87-98) 93 (88-98)
Tumoral phenotype 0.377 0.721
Glutaminolysis type 87/10/9 91 (85-98) 92 (86-98)
Non-glutaminolysis type 42/3/4 95 (89-101) 93 (86-100)
Stromal phenotype 0.144 0.470
Glutaminolysis type 48/2/3 94 (89-99) 92 (87-98)
Non-glutaminolysis type 81/11/10 91 (84-97) 92 (87-98)
Tumoral phenotype 0.435 0.455
Mitochondrial type 110/10/10 94 (89-99) 94 (89-99)
Non-mitochondrial type 19/3/3 84 (71-98) 86 (74-97)
Stromal phenotype 0.847 0.774
Mitochondrial type 18/2/2 73 (63-82) 74 (65-82)
cell type [9]. As for breast cancer, there have been varying reports on the predominant ener-gy metabolism, from oxidative phosphorylation [15] to glycolysis and oxidative phosphorylation [16]. A gene signature study also reported a high correlation between glycolysis- and oxida-tive-phosphorylation-related signature and pro-liferation [17]. As TNBC is a representative of highly aggressive tumors with proliferative activity, both glycolysis and oxidative phosphor-ylation of cancer cell metabolism could be expected, which is supported by the results of this study. In this study, there was no significant difference in metabolic phenotype based on molecular subtype by surrogate IHC. However, this could result from the difficulties in accu-rate analysis due to the limited numbers of each subtype, suggesting that an extended study is required with larger numbers of sam-ples. When TNBC is classified into basal-like type and non-basal-like type, however, the ratio of glycolysis type was higher in basal-like type of tumor, while that of non-glycolysis type was higher in non-basal-like type. It was reported that the expression of glycolysis-related pro-teins such as Glut-1, CAIX and MCT4 was higher in the basal-like phenotype of breast cancer [18-20], which is consistent with the results of this study. It should be noted that the metabolic phenotype was observed in the stroma and was not limited to the tumor. The most common metabolic phenotype of stroma was glutami-nolysis type (37.2%), followed by glycolysis type (16.3%) and mitochondrial type (14.0%). Based on the molecular subtypes, non-glycolysis type was observed in all stroma of molecular apo-crine type, while non-mitochondrial type was observed in those of claudin-low type, and non-glycolysis type and non-mitochondrial type were observed in those of immune-related type. These results imply that there are differ-ent profiles for the molecular subtypes, but this finding should be interpreted with caution due to the limited numbers of each subtype. The interaction between tumor and stroma plays an important role in the growth and progression of tumors. The interaction can also be important in view of metabolism. One of the hypotheses about metabolic interaction between tumor and stroma in breast cancer is the reverse Warburg effect [21]. This theory can be sum-marized as follow: breast cancer cells generate reactive oxygen species (ROS) such as nitric oxide (NO), which serve as oxidative stress to
stromal cells through HIF-1α and NF-κB, lead-ing to glycolysis, autophagy (mitophagy), and mitochondrial dysfunction. The ketone bodies and lactate produced by glycolysis in stromal cells enter the cancer cells and effectively pro-duce ATP by oxidative phosphorylation in the mitochondria, contributing to the survival and growth of the cancer cells. Therefore, stromal cells show glycolysis type, while tumor cells show mitochondrial type in the reverse Warburg effect theory. In addition, a metabolic interac-tion for glutamine metabolism in the tumor and stroma is suggested. This vicious cycle can be described as follows: ammonia, a byproduct of tumor cell glutaminolysis, diffuses into the stro-ma where it induces autophagy, followed by generation of glutamine as a product of autoph-agy activity, which is transported back to tumor cells [22-26]. Glutamine uptake molecules and glutaminase are mainly expressed in cancer cells, while the expression of glutamine synthe-tase is mostly observed in stromal cells [26]. We also found various metabolic phenotypes of the stroma as well as tumor, which require fur-ther studies. In the analysis of correlation between metabolic phenotypes of tumor and stroma, we found significant correlation between glutaminolysis type and mitochondrial type of both tumor and stroma. As α-ketoglutarate generated by glutaminolysis can be used as a mitochondrial substrate, a relationship between glutaminolysis and mito-chondrial enzymes could be expected [27] and was demonstrated in this study.
shows the expression of both glycolysis- and mitochondrial metabolism-related proteins in tumor cells with higher ratios of glycolysis type in basal-like type tumors and non-glycolysis type in non-basal-like type tumors.
Acknowledgements
This research was supported by the Basic Science Research Program through the National Research Foundation of Korea (NRF), funded by the Ministry of Education, Science and Technology (2012R1A1A1002886); and by a faculty research grant from Yonsei University College of Medicine for 2013 (6-2013-0146). Disclosure of conflict of interest
The authors declare that they have no compet-ing interests.
Address correspondence to: Dr. Ja Seung Koo, Department of Pathology, Yonsei University College of Medicine, Severance Hospital, 50 Yonsei-Ro, Seodaemun-Gu, Seoul, 120-752, South Korea. Tel: 82-2-2228-1772; Fax: 82-2-362-0860; E-mail: kjs1976@yuhs.ac
References
[1] Perou CM, Sorlie T, Eisen MB, van de Rijn M, Jeffrey SS, Rees CA, Pollack JR, Ross DT, John-sen H, Akslen LA, Fluge O, Pergamenschikov A, Williams C, Zhu SX, Lonning PE, Borresen-Dale AL, Brown PO and Botstein D. Molecular por-traits of human breast tumours. Nature 2000; 406: 747-752.
[2] Sørlie T, Perou CM, Tibshirani R, Aas T, Geisler S, Johnsen H, Hastie T, Eisen MB, van de Rijn M, Jeffrey SS, Thorsen T, Quist H, Matese JC, Brown PO, Botstein D, Lønning PE, Børresen-Dale AL. Gene expression patterns of breast carcinomas distinguish tumor subclasses with clinical implications. Proc Natl Acad Sci U S A 2001; 98: 10869-10874.
[3] Dent R, Trudeau M, Pritchard KI, Hanna WM, Kahn HK, Sawka CA, Lickley LA, Rawlinson E, Sun P and Narod SA. Triple-negative breast cancer: clinical features and patterns of recur-rence. Clin Cancer Res 2007; 13: 4429-4434. [4] Perou CM. Molecular stratification of
triple-negative breast cancers. Oncologist 2011; 16 Suppl 1: 61-70.
[5] Reis-Filho JS and Tutt AN. Triple negative tu-mours: a critical review. Histopathology 2008; 52: 108-118.
[6] Foulkes WD, Smith IE and Reis-Filho JS. Triple-negative breast cancer. N Engl J Med 2010; 363: 1938-1948.
[7] Pollard PJ, Wortham NC and Tomlinson IP. The TCA cycle and tumorigenesis: the examples of fumarate hydratase and succinate dehydroge-nase. Ann Med 2003; 35: 632-639.
[8] Rakha EA and Ellis IO. Triple-negative/basal-like breast cancer: review. Pathology 2009; 41: 40-47.
[9] Korpershoek E, Favier J, Gaal J, Burnichon N, van Gessel B, Oudijk L, Badoual C, Gadessaud N, Venisse A, Bayley JP, van Dooren MF, de Herder WW, Tissier F, Plouin PF, van Nederveen FH, Dinjens WN, Gimenez-Roqueplo AP and de Krijger RR. SDHA immunohistochemistry de-tects germline SDHA gene mutations in appar-ently sporadic paragangliomas and pheochro-mocytomas. J Clin Endocrinol Metab 2011; 96: E1472-1476.
[10] Hamele-Bena D, Cranor ML and Rosen PP. Mammary mucocele-like lesions. Benign and malignant. Am J Surg Pathol 1996; 20: 1081-1085.
[11] Hammond ME, Hayes DF, Dowsett M, Allred DC, Hagerty KL, Badve S, Fitzgibbons PL, Fran-cis G, Goldstein NS, Hayes M, Hicks DG, Lester S, Love R, Mangu PB, McShane L, Miller K, Os-borne CK, Paik S, Perlmutter J, Rhodes A, Sa-sano H, Schwartz JN, Sweep FC, Taube S, Tor-lakovic EE, Valenstein P, Viale G, Visscher D, Wheeler T, Williams RB, Wittliff JL and Wolff AC. American Society of Clinical Oncology/Col-lege Of American Pathologists guideline rec-ommendations for immunohistochemical test-ing of estrogen and progesterone receptors in breast cancer. J Clin Oncol 2010; 28: 2784-2795.
[12] Wolff AC, Hammond ME, Schwartz JN, Hagerty KL, Allred DC, Cote RJ, Dowsett M, Fitzgibbons PL, Hanna WM, Langer A, McShane LM, Paik S, Pegram MD, Perez EA, Press MF, Rhodes A, Sturgeon C, Taube SE, Tubbs R, Vance GH, van de Vijver M, Wheeler TM and Hayes DF. Ameri-can Society of Clinical Oncology/College of American Pathologists guideline recommenda-tions for human epidermal growth factor re-ceptor 2 testing in breast cancer. J Clin Oncol 2007; 25: 118-145.
[13] Elston CW and Ellis IO. Pathological prognostic factors in breast cancer. I. The value of histo-logical grade in breast cancer: experience from a large study with long-term follow-up. Histopa-thology 1991; 19: 403-410.
[14] Warburg O. On the origin of cancer cells. Sci-ence 1956; 123: 309-314.
[16] Hanski C, Hofmeier M, Schmitt-Graff A, Riede E, Hanski ML, Borchard F, Sieber E, Niedobitek F, Foss HD, Stein H and Riecken EO. Overex-pression or ectopic exOverex-pression of MUC2 is the common property of mucinous carcinomas of the colon, pancreas, breast, and ovary. J Pathol 1997; 182: 385-391.
[17] Harris JR, Lippman ME, Morrow M and Os-borne KC. Diseases of the breast. In: editors. Philadelphia: Lippincott Williams & Wilkin; 2004. pp: 253.
[18] Gomez I, Pena C, Herrera M, Munoz C, Larriba MJ, Garcia V, Dominguez G, Silva J, Rodriguez R, Garcia de Herreros A, Bonilla F and Garcia JM. TWIST1 is expressed in colorectal carcino-mas and predicts patient survival. PLoS One 2011; 6: e18023.
[19] Pinheiro C, Sousa B, Albergaria A, Paredes J,
Dufloth R, Vieira D, Schmitt F and Baltazar F. GLUT1 and CAIX expression profiles in breast
cancer correlate with adverse prognostic fac-tors and MCT1 overexpression. Histol Histo-pathol 2011; 26: 1279-1286.
[20] Tan EY, Yan M, Campo L, Han C, Takano E, Tur-ley H, Candiloro I, Pezzella F, Gatter KC, Millar EK, O’Toole SA, McNeil CM, Crea P, Segara D, Sutherland RL, Harris AL and Fox SB. The key hypoxia regulated gene CAIX is upregulated in basal-like breast tumours and is associated with resistance to chemotherapy. Br J Cancer 2009; 100: 405-411.
[21] Pavlides S, Whitaker-Menezes D, Castello-Cros R, Flomenberg N, Witkiewicz AK, Frank PG, Ca-simiro MC, Wang C, Fortina P, Addya S, Pestell RG, Martinez-Outschoorn UE, Sotgia F and Lisanti MP. The reverse Warburg effect:
aero-bic glycolysis in cancer associated fibroblasts
and the tumor stroma. Cell Cycle 2009; 8: 3984-4001.
[22] Kang Y and Massague J. Epithelial-mesenchy-mal transitions: twist in development and me-tastasis. Cell 2004; 118: 277-279.
[23] Lee TK, Poon RT, Yuen AP, Ling MT, Kwok WK, Wang XH, Wong YC, Guan XY, Man K, Chau KL and Fan ST. Twist overexpression correlates with hepatocellular carcinoma metastasis through induction of epithelial-mesenchymal transition. Clin Cancer Res 2006; 12: 5369-5376.
[24] Li A, Goto M, Horinouchi M, Tanaka S, Imai K, Kim YS, Sato E and Yonezawa S. Expression of MUC1 and MUC2 mucins and relationship with cell proliferative activity in human colorectal neoplasia. Pathol Int 2001; 51: 853-860. [25] Libura J, Drukala J, Majka M, Tomescu O,
Navenot JM, Kucia M, Marquez L, Peiper SC, Barr FG, Janowska-Wieczorek A and Ratajczak MZ. CXCR4-SDF-1 signaling is active in rhabdo-myosarcoma cells and regulates locomotion, chemotaxis, and adhesion. Blood 2002; 100: 2597-2606.
[26] Ko YH, Lin Z, Flomenberg N, Pestell RG, Howell A, Sotgia F, Lisanti MP and Martinez-Outschoo-rn UE. Glutamine fuels a vicious cycle of au-tophagy in the tumor stroma and oxidative mi-tochondrial metabolism in epithelial cancer cells: Implications for preventing chemothera-py resistance. Cancer Biol Ther 2011; 12: 1085-1097.
[27] Kovacevic Z. The pathway of glutamine and glutamate oxidation in isolated mitochondria from mammalian cells. Biochem J 1971; 125: 757-763.
[28] Dang CV, Hamaker M, Sun P, Le A and Gao P. Therapeutic targeting of cancer cell metabo-lism. J Mol Med (Berl) 2011; 89: 205-212. [29] Wise DR and Thompson CB. Glutamine