RESEARCH ARTICLE
Membranes as a possible pacemaker of metabolism in cypriniform
fish: does phylogeny matter?
Alex Gonzalez, Benoît Pagé and Jean-Michel Weber*
ABSTRACT
The ‘membrane pacemaker theory of metabolism’ proposes that membranes set metabolic rate by modulating protein activity, and thus purports to explain membrane fatty acid allometry. This relationship has never been tested across species in ectotherms. After accounting for phylogeny, recent analyses have failed to support this theory based on correlations between muscle membrane composition and body mass across mammals. Therefore, the goal of this study was to seek phylogenetically corrected correlations between membrane composition, body mass and calcium-ATPase activity, using 12 species of closely related cypriniform fish (4–5500 g) covering a much narrower genetic scale than in previous tests. The results show that fish membrane unsaturation decreases with mass, but through different mechanisms from those in endotherms: 16:0 replacing 22:6 in muscle and 18:0 replacing 16:1, 18:1 and 18:2 in liver. This shows that allometric patterns differ between endotherms and ectotherms as well as between tissues. After accounting for phylogeny, however, almost all these relationships lose significance except for overall unsaturation. No relationship between calcium-ATPase activity and mass or phospholipid composition was detected. This study shows that membrane unsaturation of cypriniforms decreases with mass, but that genetic cues unrelated to size account for differences in the relative abundance of individual fatty acids. The membrane pacemaker concept accurately predicts general membrane properties such as unsaturation, but fails to explain finer scale allometric patterns. Future examinations of the membrane pacemaker hypothesis will have to take into account that allometric patterns vary between endotherms and ectotherms and between tissues of the same animal class.
KEY WORDS: Membrane composition, Ectotherm metabolism, Allometry, Fatty acids, SERCA, Cypriniform phylogeny
INTRODUCTION
Membranes are the boundaries of every cell compartment. They are dynamic structures that include proteins serving numerous transport, catalytic and sensory functions (Hulbert and Else, 1999). Their phospholipid composition impacts the activity of many enzymes of energy metabolism, ATPases, hormone receptors and ion channels by determining local molecular environment (Yilmaz et al., 2006). On an evolutionary scale, it has been shown that phospholipid composition varies with body size in mammals and birds: larger species having membranes with more oleate (>%18:1) and less docosahexaenoate (<%22:6) (Couture and Hulbert, 1995; Hulbert et al., 2002a). Mass-specific metabolic rate also decreases allometrically (Schmidt-Nielsen, 1990), and is highly dependent
upon membrane processes like oxidative phosphorylation, cellular fuel intake and ion transport (Rolfe and Brown, 1997). For fish, the
size–metabolic rate relationship was established by surveying 69
species from 12 orders (Clarke and Johnston, 1999) and was later confirmed in a smaller number of species (White et al., 2006). Temperature acclimation of ectotherms involves altering membrane composition to maintain membrane function, changing membrane unsaturation to compensate for loss of protein activity with changing temperature (Guderley et al., 1997; Hazel, 1995; Ibarz et al., 2005; Kraffe et al., 2007; Raynard and Cossins, 1991). Hulbert and Else
(1999) combined all these observations to formulate the‘membrane
pacemaker theory of metabolism’. They postulated that the relative
abundance of polyunsaturated fatty acids in membrane phospholipids sets metabolic rate by modulating the activity of membrane proteins. Support for this comes not only from multispecies correlations between membrane composition and metabolism but also from experimental manipulations of phospholipids. In accordance with the
theory, the activity of Na+/K+-ATPase from ectotherms is increased
by replacing native phospholipids with those from endotherms (Else and Wu, 1999; Wu et al., 2004), and the activity of succinic dehydrogenase from warm-acclimated goldfish is increased by replacing the native phospholipids with those of cold-acclimated goldfish (Hazel, 1972). Similarly, membrane composition can affect intracellular calcium concentration (Yilmaz et al., 2006), but it is unclear whether this response is mediated by changes in the activity of sarco/endoplasmic reticulum calcium-ATPase (SERCA), a major protein of the sarcolemma.
By contrast, several recent studies using intraspecific selection or interspecific correlations corrected for phylogeny fail to support the theory. Artificially selecting mice for higher metabolic rate caused an
increase in membrane saturation, the opposite of the theory’s
predictions (Brze¸k et al., 2007), and similar studies show a weak relationship with palmitate only (Haggerty et al., 2008) or a mix of mostly inconsistent shifts in relative fatty acid composition (Wone et al., 2013). Several studies show that increasing trout membrane unsaturation via diet has little to no effect on the activity of major mitochondrial enzymes, despite sometimes affecting oxidative capacity and/or the proportions of rare fatty acids (Guderley et al., 2008; Martin et al., 2013, 2015). Phylogeny gives species shared genetic inheritance that affects their physiology and prevents their trait values from being statistically independent (Díaz-Uriarte and Garland, 1996; Felsenstein, 1985; Garland et al., 1992). This phylogenetic signal can be detected and corrected for when making multispecies comparisons. With that in mind, Valencak and Ruf
(2007) re-examined the membrane–metabolic rate relationship using
30 species of mammals. After correcting for phylogeny and body mass, they found no link between metabolic rate and any membrane parameter, including percentage 22:6, percentage polyunsaturated fatty acids and overall unsaturation. With or without correction for phylogeny, the relationship between metabolism and membrane composition has never been characterized for ectotherms, possibly Received 27 November 2014; Accepted 28 May 2015
Biology Department, University of Ottawa, Ottawa, Ontario, Canada K1N 6N5.
*Author for correspondence ( jmweber@uOttawa.ca)
The
Journal
of
Experimental
because homeoviscous adjustments would obscure potential correlations (Cossins, 1976; Gonzalez et al., 2013). Also, seemingly contradicting the theory, fish have higher relative levels of polyunsaturated fatty acids in their phospholipids than mammals (in part because of diet) (Hazel, 1984; Stubbs and Smith, 1984), and a higher rate of proton leak (Brookes et al., 1998), but lower metabolic rates (Schmidt-Nielsen, 1984).
The goal of this study was to determine whether the membrane pacemaker theory of metabolism applies to ectotherms, using fish as a model. Cypriniforms were selected for this purpose because: (1) the allometric relationship between fish size and metabolic rate is well established (Clarke and Johnston, 1999; White et al., 2006) and cypriniforms may show the same pattern; (2) locally available species cover a 10,000-fold range in body mass; (3) detailed information about genetic relatedness is readily available for this order, making phylogenetic correction possible; and (4) by
including closely related species (and cypriniforms are
particularly so), this model enables a test of the theory on a much narrower genetic scale than previously done across all mammals or birds. More specifically, our aim was: (1) to test whether the fatty acid composition of muscle and liver membranes changes with body mass in cypriniforms; (2) to determine whether phylogeny affects membrane composition; and (3) to quantify whether the activity of a key muscle enzyme, SERCA, varies with body mass and membrane composition in a manner consistent with the theory. We hypothesized that larger cypriniforms would
have more saturated membranes and lower muscle Ca2+-ATPase
activities than smaller ones, in keeping with their lower mass-specific metabolic rates.
RESULTS
Double bond index
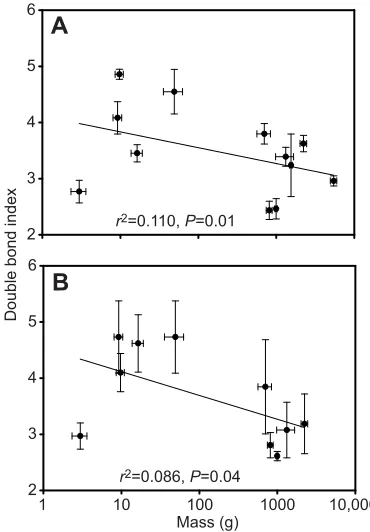
Fig. 1 shows the level of unsaturation of membrane phospholipids in muscle and liver expressed as the double bond index. In both tissues,
double bond index decreased significantly with body mass (P<0.05).
Fatty acid composition of membranes
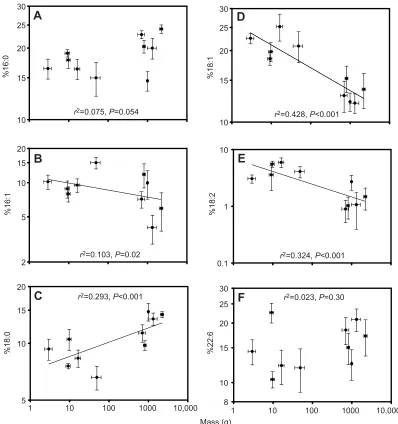
The relative abundance of individual fatty acids in membrane phospholipids is shown in Table 1 for muscle and Table 2 for liver. Figs 2 and 3 show the relationship between six specific phospholipid fatty acids and body mass for both tissues. These six fatty acids were selected because they showed significant changes with body mass in at least one of the tissues examined. They include 18:1 and 22:6, the two fatty acids that were identified in previous membrane pacemaker studies. In muscle, palmitate
(16:0) increased and docosahexaenoate (22:6) decreased
significantly with mass (P<0.05, Fig. 2). In liver, palmitoleate
(16:1), oleate (18:1) and linoleate (18:2) decreased and stearate
(18:0) increased significantly with mass (P<0.05, Fig. 3). All other
membrane fatty acids showed no significant relationship with mass
(P>0.05).
SERCA activity
Ca2+-ATPase (SERCA) activity is related to body mass in Fig. 4A,
to phospholipid double bond index in Fig. 4B, to percentage docosahexaenoate in Fig. 4C and to percentage linoleate in
Fig. 4D. None of these relationships was significant (P>0.05).
Phylogenetic analysis
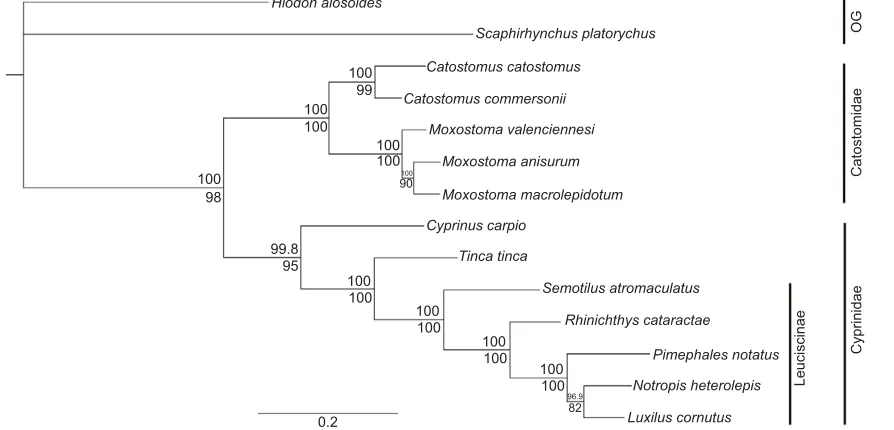
The phylogenetic tree derived for all the fish species of this experiment is shown in Fig. 5, based on the sequences of
cytochrome oxidase I (COI), cytochrome B (CytB),
interphotoreceptor retinoid-binding protein 2 (IRBP2) and
NADH dehydrogenase subunit 4 (ND4) genes (see Table 4 for
accession numbers). We used this tree to check for the presence of a phylogenetic signal in the relationships between tissue parameters
and body mass using Pagel’s lambda (Garland et al., 1992). These
parameters were the relative abundance of all the fatty acids reported in Figs 2 and 3 (selected because they showed significant changes with size in at least one of the tissues), double bond index
in both tissues and muscle Ca2+-ATPase activity. A significant
phylogenetic signal was only identified for muscle palmitate, oleate and docosahexaenoate, as well as for liver stearate, oleate
and linoleate (P<0.05). All other membrane fatty acids, double
bond indices and Ca2+-ATPase activity showed no significant
relationship with phylogeny (P>0.05). Those fatty acids showing a
phylogenetic signal and body mass were used to generate phylogenetically independent contrasts (PIC). These PIC values for percentage fatty acid and body mass were plotted against each other in Fig. 6 to reveal corrected relationships between the two quantities when the contribution of phylogeny is removed. Therefore, a loss of significance between uncorrected and corrected correlations indicates that the relationship is only based on phylogenetic relatedness. None of the fatty acid contrasts showed a significant relationship with body mass contrasts (Fig. 6). Therefore, the significant relationships identified in Figs 2 and 3 (except for 16:1 in Fig. 3) were based on phylogeny.
DISCUSSION
This study demonstrates that key parameters of membrane composition are correlated with body mass across multiple species of ectotherms. We show that the membranes of cypriniform fish decrease unsaturation with body mass, as seen in endotherms, but through different mechanisms in muscle and
Double bond index
2 3 4 5 6
Mass (g) 1
2 3 4 5 6
A
B
r2=0.110, P=0.01
10,000 1000
100 10
[image:2.612.343.528.58.324.2]r2=0.086, P=0.04
Fig. 1. Relationship between the double bond index of membrane
phospholipids and body mass of cypriniform species.Data are for
(A) white muscle and (B) liver. Lines were fitted by linear regression and values are means±s.e.m. (N=5).
The
Journal
of
Experimental
liver. For muscle, docosahexaenoate (a polyunsaturated fatty acid) is replaced with palmitate (a saturated fatty acid). By contrast, several different unsaturates ( palmitoleate, oleate and linoleate) are replaced with stearate (saturated) in liver membranes. These patterns of allometric changes are consistent with the membrane pacemaker theory of metabolism, despite involving different fatty acids from those previously characterized in birds and mammals (Hulbert and Else, 2005), and in rainbow trout (Martin et al., 2013). After correcting for phylogeny, however, all these correlations lose significance except for overall unsaturation in both tissues and for liver palmitoleate. In addition, no relationship between muscle
Ca2+-ATPase activity and body mass could be demonstrated, even
though the theory posits that membrane composition should set metabolic rate by modulating the activity of membrane proteins. In this fish model, therefore, the membrane pacemaker concept provides useful predictions for broad-scale membrane parameters like overall unsaturation, but fails to account for finer membrane properties.
Allometric changes in cypriniform membranes
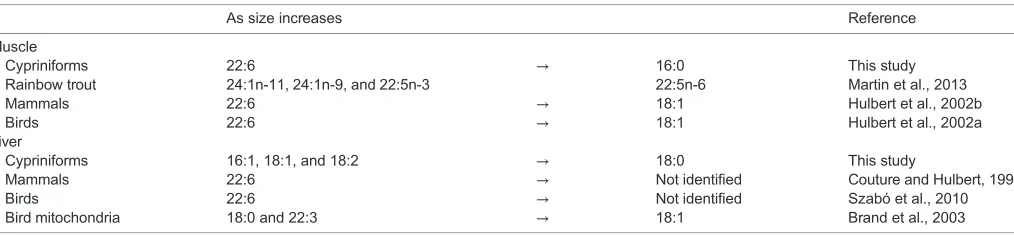
This test of the allometry of membrane composition in fish shows that cypriniforms decrease phospholipid unsaturation with increasing body size. In both muscle and liver, double bond index decreases with mass (Fig. 1), following the change observed in endotherm muscles across similar ranges in size (Couture and Hulbert, 1995; Hulbert et al., 2002a,b). This observation is consistent with the assumption that the metabolic rate of cypriniforms scales with body size as it does in other fish orders (Clarke and Johnston, 1999; White et al., 2006). However, cypriniforms exhibit tissue-specific patterns of allometric changes in membrane fatty acids that are different from those of endotherms (Figs 2, 3). Currently known changes in membrane composition with increasing body size are summarized in Table 5. In nearly all vertebrate muscles measured to date, docosahexaenoate (22:6) is replaced with a more saturated fatty acid as size increases. Rainbow
trout of 200–800 g show a much less pronounced pattern, replacing
24:1n11, 24:1n9 and 22:5n3 with 22:5n6 (Martin et al., 2013).
%16:0
15 20 30
%16:1
1 5 10 15 20
%18:1
5 10 15 20 25
%18:2
0.1 1 3 6 9
Mass (g)
%18:0
5 10 15
%22:6
3 5 10 15 20 25 30
A
D
C
B
E
F
r2=0.081, P=0.03
r2=0.005, P=0.60
r2=0.063, P=0.054
r2=0.009, P=0.47
r2=0.001, P=0.785
r2=0.167, P=0.001
1 10 100 1000 10,000
[image:4.612.104.503.55.481.2]1 10 100 1000 10,000
Fig. 2. Relationships between body mass and the relative abundance of selected fatty acids in muscle membrane phospholipids.Fatty acid abundance
is given as a percentage of total fatty acids for 12 cypriniform species on log–log plots. (A) Palmitate, 16:0; (B) palmitoleate, 16:1; (C) stearate, 18:0; (D) oleate, 18:1; (E) linoleate, 18:2; and (F) docosahexaenoate, 22:6. Fatty acids were selected because they showed a significant relationship with body mass in either liver or muscle. Lines fitted by linear regression are indicated when the slope is different from 0 (P<0.05) in muscle. Values are means±s.e.m. (N=5).
The
Journal
of
Experimental
Cypriniforms are unusual in using palmitate (16:0) rather than oleate (18:1) like endotherms. It is worth noting, however, that this difference may be driven by the unusual fatty acid profile of the market-purchased common carp; when the carp data are excluded, the relationship between 18:1 and size becomes highly significant
(P<0.001). This may be related to diet, as farmed fish often have far
more saturated diets than wild fish. The more limited information available for liver shows that 22:6 decreases with body mass in endotherms, but does not change significantly with size in cypriniforms. Instead, these fish decrease membrane unsaturation of liver membranes by reducing levels of 16:1, 18:1 and 18:2, and replacing them with 18:0 (Fig. 3). The specific fatty acids replacing 22:6 in hepatic membranes of large endotherms have not been identified (Table 5). It is also worth noting that none of these correlation studies takes into account the possibility that different membrane types within a single tissue may show different allometric changes. Two separate studies of avian livers suggest that this might be the case because different fatty acids were
identified in whole tissue samples in one study and in isolated mitochondria in the other (Brand et al., 2003; Szabó et al., 2010) (see Table 5). Therefore, future examinations of the membrane pacemaker hypothesis will have to consider that allometric patterns can vary between endotherms and ectotherms, between tissues, and even possibly between membrane types of the same tissue.
Correcting allometric relationships for phylogeny
A novel phylogenetic tree of the cypriniform species of this study was created (Fig. 5) and it was used to assess whether phylogeny plays a role in determining allometric patterns of membrane composition. No phylogenetic signal was detected for the double bond index of either tissue, revealing that the general pattern for membrane unsaturation holds across taxa despite differences in genetic heritage, activity level, diet and habitat. This robust pattern and its pervasiveness are consistent with the predictions of the membrane pacemaker theory. By contrast, the other apparent allometric changes in the abundance of specific fatty acids nearly all disappear when the data are corrected
%16:0
10 15 20 25 30
%16:1
2 5 10 15 20
%18:0
5 10 15 20
%18:1
10 15 20 25 30
%18:2
0.1 1 10
Mass (g)
%22:6
8 10 15 20 25 30
A
D
C
B
E
F
r2=0.075, P=0.054
1 10 100 1000 10,000
1 10 100 1000 10,000
r2=0.428, P<0.001
r2=0.103, P=0.02
r2=0.324, P<0.001
[image:5.612.105.503.56.480.2]r2=0.293, P<0.001 r2=0.023, P=0.30
Fig. 3. Relationships between body mass and the relative abundance of selected fatty acids in the liver membrane phospholipids.Fatty acid abundance
is given as a percentage of total fatty acids for 10 cypriniform species on log–log plots. (A) Palmitate, 16:0; (B) palmitoleate, 16:1; (C) stearate, 18:0; (D) oleate, 18:1; (E) linoleate, 18:2; and (F) docosahexaenoate, 22:6. Fatty acids were selected because they showed a significant relationship with body mass in either liver or muscle. Lines fitted by linear regression are indicated when the slope is different from 0 (P<0.05) in liver. Values are means±s.e.m. (N=5).
The
Journal
of
Experimental
for cypriniform phylogeny (Fig. 6). This corroborates earlier studies of phylogenetic signals in fatty acid composition of muscle membranes (Ruf et al., 2006; Turner et al., 2006; Valencak and Ruf, 2007), but support is now provided on a much narrower genetic scale and in an additional tissue: the liver. Interestingly, 22:6 in muscle remains significant when corrected for phylogeny if only the Cyprinidae species are considered, but this relationship vanishes
when the additional five, more distantly related Catostomidae species are included. Put together, our results reveal that the observed relationships between relative fatty acid abundance and body mass are mostly based on kinship rather than size. These patterns are
adaptations to ecological factors or inherited legacies of a species’
evolutionary history. We could find no evidence for an association with metabolic challenges that are similar across taxa, despite a weak
C
% 22:6 in phospholipids 0
5 10 15 20 25
A
Mass (g) 1
5 10 15 20 25
B
Double bond index 2
SERCA
activity (
μ
mol NADH g protein
–1
min
–1
)
0 5 10 15 20 25
D
%18:2 in phospholipids 0
5 10 15 20 25
r2=0.0003, P=0.89
r2=0.022, P=0.27
r2=0.006, P=0.58
r2=0.0007, P=0.84
10,000 1000
100
10 5 10 15 20 25
5 4
[image:6.612.112.502.57.346.2]3 0 1 2 3 4 5 6 7
Fig. 4. Ca2+-ATPase (SERCA) activity in 12 cypriniform species.Activity is shown in relation to (A) body mass, (B) double bond index, (C) percentage
docosahexaenoate (22:6) and (D) percentage linoleate of muscle membranes. Values are means±s.e.m. (N=5).
Scaphirhynchus platorychus
Catostomus catostomus
Catostomus commersonii
Moxostoma valenciennesi
Moxostoma anisurum
Moxostoma macrolepidotum
Cyprinus carpio
Tinca tinca
Semotilus atromaculatus
Rhinichthys cataractae
Pimephales notatus
Notropis heterolepis
Luxilus cornutus
OG
Catostomidae
Cyprinidae
Leuciscinae
0.2
100
100
100
100 100 100
100 Hiodon alosoides
99
98
90
99.8 95
96.9 82
100 100
100 100
100 100 100
100
Fig. 5. Phylogenetic tree hypothesized for 12 cypriniform species based onCOI,CytB,IRBP2andND4sequences and inferred using a Bayesian
method.Bayesian posterior probabilities and PhyML bootstrap values as percentages are reported above and below each node, respectively. Accession
numbers for these genes are listed in Table 4. Bars on the right indicate classification following Bufalino and Mayden (2010) and Chen and Mayden (2012) for the
families Catostomidae and Cyprinidae and the cyprinid subfamily Leuciscinae. OG, outgroups.
The
Journal
of
Experimental
[image:6.612.89.536.478.693.2]but non-phylogenetic relationship between liver palmitoleate and size. Genetic constraints prevent the membrane pacemaker concept from being useful to predict the finer properties of membrane phospholipids (i.e. variation in the relative abundance of individual fatty acids). Interestingly, the fact that a phylogenetic signal explains part of the natural variation in phospholipids suggests that membrane composition could be used in future evaluations of phylogenies (Moser et al., 2011).
Ca2+-ATPase activity shows no allometric pattern
Ca2+-ATPase is a highly abundant protein pump that is vital for
muscle function. In addition to being itself a transmembrane protein of the sarcoplasmic reticulum, it is regulated by several membrane-bound proteins that include sarcolipin and phospholamban (Cerra and Imbrogno, 2012; Gorski et al., 2013).
If the membrane pacemaker concept accurately predicts
cypriniform biochemistry, Ca2+-ATPase activity should vary
%16:0 contrast
–0.3 0 0.3
%18:1 contrast
–0.5 0 0.5
0
%22:6 contrast
–1.2 –0.8 –0.4 0 0.4 0.8
A
C
B
%18:0 contrast
–0.4 –0.2 0 0.2 0.4
D
%18:1 contrast
–0.4 –0.2 0 0.2 0.4
E
Mass contrast 0
%18:2 contrast
–0.8 –0.4 0 0.4 0.8
F
r2=0.070, P=0.65 r2=0.044, P=0.72
r2=0.025, P=0.69
r2=0.089, P=0.53
r2=0.157, P=0.09 r2=0.027, P=0.93
4.0 3.2 2.4 1.6
[image:7.612.51.434.57.451.2]0.8 0.4 0.8 1.2 1.6
Fig. 6. Relationship between body mass and percentage phospholipid fatty acid independent contrasts obtained for white muscle and liver. Data are fromCOI,CytB,IRBP2and
ND4phylogeny (Fig. 5) for white muscle (A, palmitate; B, oleate; C, docosahexaenoate) and liver (D, stearate; E, oleate; F, linoleate), showing the shape of each relationship with the contribution of phylogeny removed. No significant correlation was found.
Table 3. Cypriniform species used in this study
Species Common name Mass (g) Source Temperature (°C)
Catostomidae
Catostomus catostomus Longnose sucker 813.2±70.1 Pont Champlain, St Lawrence River, QC 16
Catostomus commersonii White sucker 703.2±138.7 Rideau Canal, Ottawa, ON 20
Moxostoma anisurum Silver redhorse 2233.0±215.3 Rideau Canal, Ottawa, ON 20
Moxostoma macrolepidotum Shorthead redhorse 995.8±32.7 Pont Champlain, St Lawrence River, QC 16
Moxostoma valenciennesi Greater redhorse 1322.6±342.3 Rideau Canal, Ottawa, ON 20 Cyprinidae
Cyprinus carpio Common carp 5453.5±424.4 Lapointe Fish Market, Orleans, ON 15
Luxilus cornutus Common shiner 16.4±2.7 Hoople Creek, Ottawa, ON 28
Notropis heterolepis Blacknose shiner 9.7±1.2 Lac Lannigan, Déléage, QC 21
Pimephales notatus Bluntnose minnow 4.2±0.9 Watts Creek, Ottawa, ON 15
Rhinichthys cataractae Longnose dace 9.2±1.2 Watts Creek, Ottawa, ON 15
Semotilus atromaculatus Creek chub 49.1±13.5 Richelieu River, St-Paul-de-l’île-aux-Noix, QC 17
Tinca tinca Tench 1545.6±41.9 Richelieu River, St-Paul-de-l’île-aux-Noix, QC 17
Mean (±s.e.m.) body mass (N=5), source and water temperature are given.
The
Journal
of
Experimental
[image:7.612.46.570.575.727.2]with body mass and/or membrane composition. For example,
a relationship with percentage linoleate or percentage
docosahexaenoate should be detectable because these two fatty acids have been shown to affect the enzyme in mammals (Giroud
et al., 2013). The cypriniform Ca2+-ATPase exhibits no such
variation because its activity is not correlated with body mass, double bond index or the abundance of any specific fatty acid (Fig. 5). In addition, the activity of the enzyme fails to show a phylogenetic signal. In our multispecies comparison, neither body size nor membrane composition exerted detectable effects on
Ca2+-ATPase activity, contrary to the theory’s prediction that
these parameters should be tightly correlated and in keeping with earlier findings on mitochondrial enzymes in trout (Martin et al., 2013, 2015). The method used here cannot distinguish between a change in enzyme number and a change in the activity of each enzyme molecule, so we cannot exclude the possibility that
Ca2+-ATPase enzyme number changes with size or with the
relative amount of particular fatty acids. Therefore, the network of
regulatory proteins that controls cypriniform Ca2+-ATPase
appears to do so without being affected by membrane composition in any consistent way.
Conclusions
This study shows that the membrane composition of ectotherms can vary with body mass, but also greatly with phylogeny. Cypriniform fish decrease membrane unsaturation with increasing body mass, as previously observed in endotherms, but through different mechanisms that also vary among tissues. The specific fatty acids showing an allometric change are different between muscle and liver, and do not match those previously identified in endotherm membranes (Hulbert and Else, 2005) or in rainbow trout (Martin et al., 2013). When ignoring the effects of phylogeny in
cypriniforms, the mass-related patterns of change in unsaturation and in relative abundance of specific fatty acids are all consistent with the predictions from the membrane pacemaker theory of metabolism. These results are comparable to those from the intraspecific study of Martin et al. (2013) wherein a phylogenetic contribution to the pattern was impossible to detect. However, accounting for the contribution of phylogeny in cypriniforms renders almost all these relationships non-significant except for overall unsaturation. Specific membrane components are set by genetic attributes that vary over evolutionary time rather than by size-based signals. Previous studies on endotherm muscle had come to similar conclusions (Ruf et al., 2006; Turner et al., 2006; Valencak and Ruf, 2007), but this effect of phylogeny is demonstrated here on a much narrower genetic scale, and in ectotherm liver as well as muscle. In addition, no relationship
between Ca2+-ATPase activity and body mass or phospholipid
composition could be demonstrated, even though the theory proposes that membranes set metabolic rate by modulating the activity of their proteins. We conclude that the membrane
pacemaker concept accurately predicts general membrane
properties like unsaturation, but does not explain allometric patterns of fatty acid composition.
MATERIALS AND METHODS Animals and experimental design
Adult wild cypriniform fish of 12 species were collected from eastern Ontario and southwestern Quebec by electrofishing, nets or traps, and they were killed via a blow to the head. Carp were acquired from a fish market. Juvenile fish were avoided because of potential ontogenetic differences in fatty acid composition. Details about the species, size, provenance and water temperature are presented in Table 3. The species selected are mostly omnivorous, eating variable mixes of insects, detritus, algae, crustaceans
Species COI CytB IRBP2 ND4
Catostomus catostomus 186884210 28201351 325112634 260766555
Catostomus commersonii 324023510 347949515 172050603 N/A
Cyprinus carpio 460418872 115490837 217069416 N/A
Luxilus cornutus 324024172 1519414 N/A N/A
Moxostoma anisurum 186884978 347949545 325112680 260766624
Moxostoma macrolepidotum 186885074 347949591 325112698 260766657
Moxostoma valenciennesi 186885092 347949615 325112712 260766678
Notropis heterolepis 339771397 186885264 N/A N/A
Pimephales notatus 407232072 336317785 N/A N/A
Rhicichthys cataractae 324023472 442559611 384369807 N/A
Semotilus atromaculatus 324024188 299893141 172050643 N/A
Tinca tinca 460421432 307090444 217069456 N/A Outgroups
Hiodon alosoides 186884570 46391328 N/A N/A
[image:8.612.46.572.69.231.2]Scaphirhynchus platorhynchus 339773117 4204893 N/A N/A COI, cytochrome oxidase I; CytB, cytochrome B; IRBP2, interphotoreceptor retinoid-binding protein 2; ND4, NADH dehydrogenase subunit 4.
Table 5. Summary of changes in membrane composition associated with size in bird, mammal and cypriniform muscle and liver
As size increases Reference
Muscle
Cypriniforms 22:6 → 16:0 This study
Rainbow trout 24:1n-11, 24:1n-9, and 22:5n-3 22:5n-6 Martin et al., 2013
Mammals 22:6 → 18:1 Hulbert et al., 2002b
Birds 22:6 → 18:1 Hulbert et al., 2002a
Liver
Cypriniforms 16:1, 18:1, and 18:2 → 18:0 This study
Mammals 22:6 → Not identified Couture and Hulbert, 1995
Birds 22:6 → Not identified Szabó et al., 2010
Bird mitochondria 18:0 and 22:3 → 18:1 Brand et al., 2003
The
Journal
of
Experimental
[image:8.612.53.560.619.737.2]and plant matter, with a handful of more carnivorous species, and they include a mix of fast-water and slow-water species. Diet and water speed preference are not associated with each other or with size among these species (Froese and Pauly, 2014; Roberts et al., 2006). Temperature was not significantly correlated with size, membrane composition or Ca2+-ATPase activity (P>0.05). White muscle and liver samples were taken and stored at −80°C until analyses. Liver samples were not collected for the carp
(Cyprinus carpio) and tench (Tinca tinca). All procedures were approved by
the Animal Care Committee of the University of Ottawa and adhered to the guidelines established by the Canadian Council on Animal Care for the use of animals in research.
Phospholipid composition
Total lipids were extracted from∼30 mg of tissue using chloroform:methanol (2:1 v/v). Samples were homogenised (Polytron, Kinematica, Littau, Switzerland) and centrifuged (10 min at 2000g). Supernatants were filtered and 0.25% KCl added to separate aqueous and organic phases. The organic phase was evaporated and the lipids resuspended in chloroform before loading on solid-phase extraction columns (Supelclean 3 ml 500 mg LC-NH2; Sigma-Aldrich, St Louis, MO, USA) to separate the phospholipids. Separation was achieved by sequential elution of lipid classes using solvents of increasing polarity: isopropyl ether:acetic acid (98:2 v/v), chloroform: isopropanol (3:2 v/v) and methanol, respectively (Maillet and Weber, 2006). The fatty acid composition of phospholipids was measured after acid transesterification. Fatty acid methyl esters were analysed on an Agilent Technologies 6890N gas chromatograph (Mississauga, ON, Canada) equipped with a fused silica capillary column (Supelco DB-23, 60 m, 0.25 mm i.d., 0.25μm film thickness; Sigma-Aldrich) using hydrogen as the carrier gas as previously described (Magnoni and Weber, 2007). Only the fatty acids accounting for >1% of total fatty acids in phospholipids are reported in this study, although traces of myristoleate (14:1), gondoate (20:1), eicosatrienoate (20:3) and docosatrienoate (22:3) were also detected.
SERCA activity
Ca2+-ATPase (SERCA) activity was assayed using a method modified
from Tupling et al. (2011; Duhamel et al., 2007). Muscle samples (∼20 mg) were homogenised (Polytron, Kinematica, Littau, Switzerland) in a buffer solution containing 250 mmol l−1 sucrose, 5 mmol l−1 Hepes,
0.2 mmol l−1PMSF and 2 g l−1NaN
3. A 20 µl sample of homogenate
was added to 1 ml of assay cocktail containing 200 mmol l−1 KCl,
20 mmol l−1Hepes, 10 mmol l−1NaN
3, 1 mmol l−1EGTA, 15 mmol l−1
MgCl2, 10 mmol l−1 PEP, 5 mmol l−1 ATP, 5.73 nmol l−1 calcium
ionophore A23187, 11.47 U ml−1 lactate dehydrogenase, 3.95 U ml−1
pyruvate kinase and 0.93 mmol l−1CaCl
2. This master mix was aliquoted
into two Eppendorf tubes, one of which additionally received 1 µl of 40 mmol l−1 cyclopiazonic acid (CPA) to block SERCA activity and
provide a measurement of basal ATPase activity. Ca2+-ATPase activity was
initiated with 2 µl of 19 mg ml−1NADH and measured as a 340 nm kinetic
assay for 30 min at room temperature on a spectrophotometer (SpectraMax Gemini XS, Molecular Devices, Sunnyvale, CA, USA) to determine Ca2+-ATPase activity.
Phylogenetic reconstruction
A phylogenetic tree of all 12 species (Fig. 5) was obtained from cytochrome oxidase I, cytochrome B, interphotoreceptor retinoid-binding protein 2 and NADH dehydrogenase subunit four gene sequences from GenBank as shown in Table 4. The analysis was based on earlier phylogenetic reconstructions of the Catostomidae and Cyprinidae (Bufalino and Mayden, 2010; Chen and Mayden, 2012). We included two out-group species in the analysis (Hiodon alosoides and
Scaphirhynchus platorhynchus). We then aligned the four sets of
sequences independently using the MUSCLE software (Edgar, 2004). We determined the best fit model using the MrModel software (Nylander et al., 2004). The aligned sequences were concatenated into a single long sequence with the help of a Perl script, substituting a‘?’for any missing data. We used MrBayes 3.1.2 to reconstruct the phylogeny with an averaged gamma-distributed Generalized Time Reversible (GTR) model with invariant sites (Ronquist and Huelsenbeck, 2003). Through an
MCMC method, 4.5 million trees were generated, keeping every thousandth generation, giving a total of 4500 trees. PhyML was used to confirm the results of MrBayes via 10,000 bootstraps, using the same model as for the Bayesian analysis (Guindon et al., 2010).
Calculations and statistics
All statistical analyses were performed using SigmaPlot 12 (Systat, San Jose, CA, USA). The relative abundance of each fatty acid (expressed as a percentage) in the phospholipid fraction was plotted against species body mass. All values were log-transformed to achieve linearity (Hulbert, 2007). All values presented are means±s.e.m. Double bond index was calculated as the average number of double bonds divided by the fraction of saturated fatty acids. This index was chosen because it is more sensitive to changes in membrane composition than the degree of unsaturation (Gonzalez et al., 2013; Maillet and Weber, 2006). Dependent and independent variables were first tested for normality using the Shapiro–Wilk test. Linear regressions were used to test for relationships between relative fatty acid abundance and body mass. To assess and correct for the degree of relatedness between species, we analysed the data using phylogenetic comparative methods in two steps. We used the phylosig function (v0.2) included in the phytools package in the R environment (R Development Core Team, 2014) to evaluate the presence of a phylogenetic signal in the data, using 10 randomly selected trees from the set of 4500 (Revell, 2012). The results did not differ for any of the 10 trees. We then conducted an analysis of PIC using the PDAP module in Mesquite (Garland et al., 1999; Maddison and Maddison, 2011) for each parameter where the phylosig function indicated the presence of a signal (P<0.05). We obtained standardized independent contrasts from the log-transformed character data. These contrasts show the relationship between the data points when the effect of the fishes’phylogenetic relatedness is removed.
Acknowledgements
We thank Steve Cooke, Shireen Bliss, Jessie Nault and Keith Stamplecoskie for their assistance in procuring the experimental fish and in forming hypotheses; Eric Bombardier and Paul Craig for assistance with the Ca2+-ATPase/SERCA assay; Antoine Morin for assistance with statistics; two anonymous reviewers for detailed and constructive comments; and the kind soul at the other end of the line at Boreal Foods Limited (Vars, ON, Canada) for sharing their knowledge of the conditions in which captive carp are maintained.
Competing interests
The authors declare no competing or financial interests.
Author contributions
A.G. and J.-M.W. designed this study, analysed the data and wrote the manuscript. A.G. executed the experiments. B.P. developed and verified the cypriniform phylogeny.
Funding
This work was supported by grants from the Natural Sciences and Engineering Research Council of Canada (NSERC) to Jean-Michel Weber [NSERC discovery grant no. 105639-2012 and NSERC research tools and instruments grant no. 315429-05].
References
Brand, M. D., Turner, N., Ocloo, A., Else, P. L. and Hulbert, A. J.(2003). Proton conductance and fatty acyl composition of liver mitochondria correlates with body mass in birds.Biochem. J.376, 741-748.
Brookes, P. S., Buckingham, J. A., Tenreiro, A. M., Hulbert, A. J. and Brand, M. D.(1998). The proton permeability of the inner membrane of liver mitochondria from ectothermic and endothermic vertebrates and from obese rats: correlations with standard metabolic rate and phospholipid fatty acid composition.Comp.
Biochem. Physiol. B Biochem. Mol. Biol.119, 325-334.
Brze¸k, P., Bielawska, K., Ksia¸z˙ek, A. and Konarzewski, M.(2007). Anatomic and molecular correlates of divergent selection for basal metabolic rate in laboratory mice.Physiol. Biochem. Zool.80, 491-499.
Bufalino, A. P. and Mayden, R. L.(2010). Phylogenetic relationships of North American phoxinins (Actinopterygii: Cypriniformes: Leuciscidae) as inferred from S7 nuclear DNA sequences.Mol. Phylogenet. Evol.55, 143-152.
Cerra, M. C. and Imbrogno, S.(2012). Phospholamban and cardiac function: a comparative perspective in vertebrates.Acta Physiol.205, 9-25.
Chen, W. J. and Mayden, R. L. (2012). Phylogeny of suckers (Teleostei: Cypriniformes: Catostomidae): further evidence of relationships provided by the single-copy nuclear gene IRBP2.Zootaxa, 195-210.
The
Journal
of
Experimental
and temperature in teleost fish.J. Anim. Ecol.68, 893-905.
Cossins, A. R.(1976). Homeoviscous adaptation of goldfish brain membranes.
J. Gen. Physiol.68, A3.
Couture, P. and Hulbert, A. J.(1995). Membrane fatty acid composition of tissues is related to body mass of mammals.J. Membr. Biol.148, 27-39.
Dı́az-Uriarte, R. and Garland, T. Jr. (1996). Testing hypotheses of correlated evolution using phylogenetically independent contrasts: sensitivity to deviations from Brownian motion.Syst. Biol.45, 27-47.
Duhamel, T. A., Green, H. J., Stewart, R. D., Foley, K. P., Smith, I. C. and Ouyang, J.(2007). Muscle metabolic, SR Ca2+-cycling responses to prolonged cycling, with and without glucose supplementation. J. Appl. Physiol. 103, 1986-1998.
Edgar, R. C.(2004). MUSCLE: a multiple sequence alignment method with reduced time and space complexity.BMC Bioinformatics5, 113.
Else, P. L. and Wu, B. J.(1999). What role for membranes in determining the higher sodium pump molecular activity of mammals compared to ectotherms?J. Comp.
Physiol. Biochem. Syst. Environ. Physiol.169, 296-302.
Felsenstein, J.(1985). Phylogenies and the comparative method.Am. Nat.125, 1-15. Froese, R. and Pauly, D.(2014). FishBase. www.fishbase.org.
Garland, T., Jr., Harvey, P. H. and Ives, A. R.(1992). Procedures for the analysis of comparative data using phylogenetically independent contrasts.Syst. Biol.41, 18-32.
Garland, T., Midford, P. E. and Ives, A. R. (1999). An introduction to phylogenetically based statistical methods, with a new method for confidence intervals on ancestral values.Am. Zool.39, 374-388.
Giroud, S., Frare, C., Strijkstra, A., Boerema, A., Arnold, W. and Ruf, T.(2013). Membrane phospholipid fatty acid composition regulates cardiac SERCA activity in a Hibernator, the Syrian Hamster (Mesocricetus auratus). PLoS ONE8, e63111.
Gonzalez, A., Odjélé, A. and Weber, J.-M.(2013). PCB-153 and temperature cause restructuring of goldfish membranes: homeoviscous response to a chemical fluidiser.Aquat. Toxicol.144-145, 11-18.
Gorski, P. A., Glaves, J. P., Vangheluwe, P. and Young, H. S.(2013). Sarco(endo) plasmic reticulum calcium ATPase (SERCA) inhibition by sarcolipin is encoded in its luminal tail.J. Biol. Chem.288, 8456-8467.
Guderley, H., St. Pierre, J., Couture, P. and Hulbert, A. J.(1997). Plasticity of the properties of mitochondria from rainbow trout red muscle with seasonal acclimatization.Fish Physiol. Biochem.16, 531-541.
Guderley, H., Kraffe, E., Bureau, W. and Bureau, D. P.(2008). Dietary fatty acid composition changes mitochondrial phospholipids and oxidative capacities in rainbow trout red muscle.Comp. Physiol. Biochem. Syst. Environ. Physiol.178, 385-399.
Guindon, S., Dufayard, J. F., Lefort, V., Anisimova, M., Hordijk, W. and Gascuel, O. (2010). New algorithms and methods to estimate maximum-likelihood phylogenies: assessing the performance of PhyML 3.0.Syst. Biol.59, 307-321. Haggerty, C., Hoggard, N., Brown, D. S., Clapham, J. C. and Speakman, J. R.
(2008). Intra-specific variation in resting metabolic rate in MF1 mice is not associated with membrane lipid desaturation in the liver.Mech. Ageing Dev.129, 129-137.
Hazel, J. R. (1972). The effect of temperature acclimation upon succinic dehydrogenase activity from the epaxial muscle of the common goldfish (Carassius auratus L)—I. Properties of the enzyme and the effect of lipid extraction.Comp. Biochem. Physiol. B Comp. Biochem43, 837-861.
Hazel, J. R.(1984). Effects of temperature on the structure and metabolism of cell membranes in fish.Am. J. Physiol.246, R460-R470.
Hazel, J. R.(1995). Thermal adaptation in biological membranes: is homeoviscous adaptation the explanation?Annu Rev. Physiol.57, 19-42.
Hulbert, A. J.(2007). Membrane fatty acids as pacemakers of animal metabolism.
Lipids42, 811-819.
Hulbert, A. J. and Else, P. L.(1999). Membranes as possible pacemakers of metabolism.J. Theor. Biol.199, 257-274.
Hulbert, A. J. and Else, P. L.(2005). Membranes and the setting of energy demand.
J. Exp. Biol.208, 1593-1599.
Hulbert, A. J., Faulks, S., Buttemer, W. A. and Else, P. L. (2002a). Acyl composition of muscle membranes varies with body size in birds.J. Exp. Biol.205, 3561-3569.
Hulbert, A. J., Rana, T. and Couture, P. (2002b). The acyl composition of mammalian phospholipids: an allometric analysis.Comp. Biochem. Physiol. B
Biochem. Mol. Biol.132, 515-527.
Ibarz, A., Blasco, J., Beltrán, M., Gallardo, M. A., Sánchez, J., Sala, R. and Fernández-Borras,̀ J. (2005). Cold-induced alterations on proximate composition and fatty acid profiles of several tissues in gilthead sea bream (Sparus aurata). Aquaculture249, 477-486.
capacities during thermal acclimation of rainbow troutOncorhynchus mykiss: roles of membrane proteins, phospholipids and their fatty acid compositions.
J. Exp. Biol.210, 149-165.
Maddison, W. P. and Maddison, D. R.(2011). Mesquite: a modular system for evolutionary analysis. http://mesquiteproject.org.
Magnoni, L. and Weber, J.-M. (2007). Endurance swimming activates trout lipoprotein lipase: plasma lipids as a fuel for muscle.J. Exp. Biol.210, 4016-4023. Maillet, D. and Weber, J.-M.(2006). Performance-enhancing role of dietary fatty acids in a long-distance migrant shorebird: the semipalmated sandpiper.J. Exp.
Biol.209, 2686-2695.
Martin, N., Bureau, D. P., Marty, Y., Kraffe, E. and Guderley, H.(2013). Dietary lipid quality and mitochondrial membrane composition in trout: Responses of membrane enzymes and oxidative capacities.J. Comp. Physiol. B Biochem. Syst.
Environ. Physiol.183, 393-408.
Martin, N., Kraffe, E., Le Grand, F., Marty, Y., Bureau, D. P. and Guderley, H. (2015). Dietary fatty acid composition and the homeostatic regulation of mitochondrial phospholipid classes in red muscle of rainbow trout (Oncorhynchus mykiss).J. Exp. Zool. A Ecol. Genet. Physiol.323, 60-71. Moser, A. B., Steinberg, S. J., Watkins, P. A., Moser, H. W., Ramaswamy, K.,
Siegmund, K. D., Lee, D. R., Ely, J. J., Ryder, O. A. and Hacia, J. G.(2011). Human and great ape red blood cells differ in plasmalogen levels and composition.Lipids Health Dis.10, 101.
Nylander, J. A. A., Ronquist, F., Huelsenbeck, J. P. and Nieves-Aldrey, J. L. (2004). Bayesian phylogenetic analysis of combined data.Syst. Biol.53, 47-67. R Development Core Team(2014). R: A Language and Environment for Statistical
Computing. Vienna, Austria: R Foundation for Statistical Computing.
Raynard, R. S. and Cossins, A. R.(1991). Homeoviscous adaptation and thermal compensation of sodium-pump of trout erythrocytes. Am. J. Physiol. 260, R916-R924.
Revell, L. J.(2012). phytools: an R package for phylogenetic comparative biology (and other things).Methods Ecol. Evol.3, 217-223.
Roberts, M. E., Burr, B. M., Whiles, M. R. and Santucci, V. J. Jr.(2006). Reproductive ecology and food habits of the blacknose shiner, notropis heterolepis, in Northern Illinois.Am. Midland Nat.155, 70-83.
Rolfe, D. F. S. and Brown, G. C.(1997). Cellular energy utilization and molecular origin of standard metabolic rate in mammals.Physiol. Rev.77, 731-758. Ronquist, F. and Huelsenbeck, J. P.(2003). MrBayes 3: bayesian phylogenetic
inference under mixed models.Bioinformatics19, 1572-1574.
Ruf, T., Valencak, T., Tataruch, F. and Arnold, W.(2006). Running speed in mammals increases with muscle n-6 polyunsaturated fatty acid content.PLoS ONE1, e65.
Schmidt-Nielsen, K. (1984). Scaling. Why is Animal Size so Important? Cambridge: Cambridge University Press.
Schmidt-Nielsen, K.(1990).Animal Physiology. New York: Cambridge University Press.
Stubbs, C. D. and Smith, A. D.(1984). The modification of mammalian membrane polyunsaturated fatty acid composition in relation to membrane fluidity and function.Biochim. Biophys. Acta779, 89-137.
Szabó, A., Mézes, M., Romvári, R. and Fébel, H.(2010). Allometric scaling of fatty acyl chains in fowl liver, lung and kidney, but not in brain phospholipids.Comp.
Biochem. Physiol. B Biochem. Mol. Biol.155, 301-308.
Tupling, A. R., Bombardier, E., Gupta, S. C., Hussain, D., Vigna, C., Bloemberg, D., Quadrilatero, J., Trivieri, M. G., Babu, G. J., Backx, P. H. et al.(2011). Enhanced Ca2+ transport and muscle relaxation in skeletal muscle from sarcolipin-null mice.Am. J. Physiol. Cell Physiol.301, C841-C849.
Turner, N., Haga, K. L., Else, P. L. and Hulbert, A. J.(2006). Scaling of Na+,K+ -ATPase molecular activity and membrane fatty acid composition in mammalian and avian hearts.Physiol. Biochem. Zool.79, 522-533.
Valencak, T. G. and Ruf, T.(2007). N-3 polyunsaturated fatty acids impair lifespan but have no role for metabolism.Aging Cell6, 15-25.
White, C. R., Phillips, N. F. and Seymour, R. S. (2006). The scaling and temperature dependence of vertebrate metabolism.Biol. Lett.2, 125-127. Wone, B. W. M., Donovan, E. R., Cushman, J. C. and Hayes, J. P.(2013).
Metabolic rates associated with membrane fatty acids in mice selected for increased maximal metabolic rate. Comp. Biochem. Physiol. A Mol. Integr.
Physiol.165, 70-78.
Wu, B. J., Hulbert, A. J., Storlien, L. H. and Else, P. L.(2004). Membrane lipids and sodium pumps of cattle and crocodiles: an experimental test of the membrane pacemaker theory of metabolism.Am. J. Physiol. Regul. Integr. Comp. Physiol. 287, R633-R641.
Yilmaz, B., Sandal, S., Chen, C.-H. and Carpenter, D. O.(2006). Effects of PCB 52 and PCB 77 on cell viability, [Ca2+]i levels and membrane fluidity in mouse thymocytes.Toxicology217, 184-193.
The
Journal
of
Experimental