Improving Writing Quality
Evaluation Report and Executive Summary
May 2014
Independent evaluators:
Professor David Torgerson
Professor Carole Torgerson
Co-authors: Ms Hannah Ainsworth, Ms Hannah Buckley,
The Education Endowment Foundation (EEF)
The Education Endowment Foundation (EEF) is an independent grant-making charity dedicated to breaking the link between family income and educational achievement, ensuring that children from all backgrounds can fulfil their potential and make the most of their talents.
We aim to raise the attainment of children facing disadvantage by:
Identifying promising educational innovations that address the needs of disadvantaged children in primary and secondary schools in England;
Evaluating these innovations to extend and secure the evidence on what works and can be made to work at scale;
Encouraging schools, government, charities, and others to apply evidence and adopt innovations found to be effective.
Founded by the education charity the Sutton Trust, as lead charity in partnership with Impetus Trust, the EEF is funded by an initial £125m grant from the Department for Education. With investment and fundraising income, the EEF intends to award as much as £200m by 2026.
Literacy Catch-up Round
This study was funded by the Education Endowment Foundation as one of 23 projects funded through a themed funding round on literacy catch-up at the primary-secondary transition. Projects funded within this round aimed to identify effective ways to support pupils who do not achieve Level 4 in English by the end of Key Stage 2. The project was one of three funded with a particular focus on writing.
For more information please contact:
Robbie Coleman
About the evaluators
David Torgerson
Professor David Torgerson, Director of the York Trials Unit, joined the Centre for Health Economics at the University of York in 1995 and became the Director of the York Trials Unit in 2002. Originally a health economist, he is a trial methodologist and has published widely on the design and conduct of randomised controlled trials including the book Designing Randomised Controlled Trials in Health,
Education and the Social Sciences (Palgrave Macmillan, 2008). David has over 200 peer-reviewed
publications. Contact details:
David Torgerson
Professor, Director of York Trials Unit
York Trials Unit
Dept of Health Sciences University of York YO10 5DD
p: 01904 321340
e: david.torgerson@york.ac.uk
Carole Torgerson
After taking degrees in English Literature and Modern English Poetry from the Universities of York and Stirling, Carole Torgerson taught English in a wide variety of schools in England and Scotland. She undertook her doctorate in design issues in experimental research at the University of Sheffield before starting her academic career. She was Reader in Evidence-based Education at the University of York, before moving to The University of Birmingham as Professor of Experimental Design and then to Durham University where she is Professor of Education.
Contact details:
Carole Torgerson Professor of Education
School of Education Durham University Leazes Road DH1 1TA
p: 01901 334 8382
Contents
Executive summary ... 2
Introduction ... 4
Methodology ... 6
Impact evaluation ... 14
Process evaluation ... 26
Conclusion ... 28
Executive summary
The project
The project aimed to use memorable experiences and an approach called ‘Self-Regulated Strategy Development’ (SRSD) to help struggling writers in Years 6 and 7. SRSD provides a clear structure to help pupils plan, monitor and evaluate their writing. It aims to encourage pupils to take ownership of their work and can be used to teach most genres of writing, including narrative writing. Memorable experiences, such as trips to local landmarks or visits from World War II veterans, were used as a focus for writing lessons.
In this evaluation 23 primary schools and their Year 6 teachers in the Calderdale area of West Yorkshire were randomly allocated to receive training, from an external consultant, in the SRSD approach. Twelve schools were allocated to the comparison group and 11 schools to the intervention group. Children in the intervention schools were taught following the SRSD approach in the last six weeks of the summer term in Year 6 and in the first term of Year 7 at secondary school. The project was organised by the Calderdale Excellence Partnership.
The study was funded by the Education Endowment Foundation as one of 23 projects focused on literacy catch-up at the primary-secondary transition. It was one of three programmes with a particular focus on writing.
What impact did it have?
Overall, the project appeared to have a large positive impact on writing outcomes. The overall effect size for writing, comparing the progress of pupils in the project to similar pupils who did not participate was +0.74. This effect size was statistically significant, meaning that it is unlikely to have occurred by chance, and can be envisaged as saying that participating pupils made approximately nine months’ additional progress compared to similar pupils who did not participate in the intervention.
The approach was also effective for pupils eligible for free school meals (FSM). Whilst there appears to be a larger effect for FSM pupils, the difference in the interaction test is not statistically significant, so chance is a possible explanation for the difference observed.
The approach had no statistically significant effect on the secondary outcomes relating to reading, spelling or grammar (i.e. the small differences between the groups could have occurred by chance). These outcomes were not the main focus of the study, but were measured as part of the same test. Teachers were trained in the SRSD approach by the North American developers, but, with support from the Calderdale Excellence Partnership team, also adapted it in some ways for an English context. For example, a component of the approach which focused on developing positive ‘self-talk’ was Anglicised.
Group N Effect
size Estimated months’ progress 95% confidence interval (CI) Evidence strength* Intervention vs. control
23 primary schools 3secondary schools
261 pupils
+0.74 +9 +0.26 to +1.22
Free School
Meal pupils 86 pupils +1.60 +18 +0.21 to +2.98
*Evidence ratings are not provided for sub-group analyses, which will always be less secure than overall findings. For more information about evidence ratings, see Appendix R.
How secure is this finding?
Executive summary
The evaluation was set up as an efficacy trial to test the impact of using SRSD in conjunction with memorable experiences at the transition from primary to secondary school. Efficacy trials seek to test evaluations in the best possible conditions, but they do not seek to demonstrate that the findings hold at scale in all types of schools.
Calderdale Excellence Partnership (CEP) recruited 23 primary schools and three secondary schools that were served by the recruited primary schools and a SRSD developer came from North America to deliver training. The 23 primary schools were randomly assigned by a statistician at the York Trials Unit so that Year 6 teachers in the 12 intervention schools received training to deliver the intervention to their Year 6 pupils. Three secondary schools agreed to honour the randomisation by allocating intervention and comparison school pupils into separate Year 7 classes, and SRSD continued to be delivered, by secondary school English teachers, to the intervention children in the first term of their Year 7. All children (from both the intervention and comparison groups) were tested under exam conditions using the Progress in English 11 (Long Form) Test developed by GL Assessment as a measure of general writing ability. Primary schools allocated to the comparison group were offered the training in the SRSD approach at the end of the trial (known as a ‘wait-list’).
The study was well conducted with independent randomisation and a moderate sample size. Intention-to-treat analysis was used (i.e. pupils were compared in the groups to which they were originally randomly assigned), blind marking of the test papers was undertaken, and the analysis was adjusted for school randomisation. Attrition was 8.5% for comparison pupils and 8.0% for intervention of those who were eligible because they attended both the primary and participating secondary school, which should have resulted in relatively little bias.
A systematic review of all previous randomised controlled trials of SRSD, largely from North America, has shown that this approach to teaching writing is, on average, very effective, with large effect sizes reported. This trial suggests that the approach can also be effective in English schools.
To increase the security of the finding and to assess its applicability in other schools, a larger evaluation could be commissioned in the future. In addition, further work could done to try and disentangle the role and importance of the individual components of the intervention (e.g. the training or memorable experiences), as this was not possible within this evaluation.
How much does it cost?
The cost of the approach is estimated at £52 per pupil. This estimate includes training and materials (£60 per teacher or £2 per pupil), and the cost of memorable experiences (£50 per pupil). Estimates are based on a class of 30 pupils, and on training being delivered to a group of 30 teachers.
Key conclusions
1. The approach had a strong positive effect on the writing outcomes of low attaining pupils at the transition from primary to secondary school among a sample of pupils in State schools in the West Yorkshire area.
2. The approach had beneficial effects for both FSM and non-FSM pupils.
Introduction
In 2013 approximately 85,000 pupils left primary school without having attained Level 4 or above in writing (Department for Education, 2013a). This study assessed the impact of a project which aimed to improve writing outcomes for pupils who had not achieved a ‘secure Level 4’ (defined as having achieved a Level 4b or above) prior to moving from the final year of primary school (Year 6) to the first year of secondary school (Year 7). The project involved memorable experiences and the use of Self-Regulated Strategy Development (SRSD) over the transition period.
A substantial minority of pupils who do not reach Level 4 in English at the end of Key Stage 2 (incorporating reading and writing) do not make the expected level of progress in secondary school (Department for Education, 2014). In addition, a literature review of the research into the transfer of pupils from primary to secondary school has identified the potential for personal, social and academic outcomes to ‘dip’ after the end of Key Stage 2 (KS2) leading to a large minority of pupils failing to make expected progress in the first year of secondary school (Galton, Gray and Ruddock, 1999).
The study was funded by the Education Endowment Foundation, as one of 23 projects focused on literacy catch-up at the primary-secondary transition. It was one of four programmes with a particular focus on writing.
Background and existing literature on Self-Regulated Strategy Development
SRSD is a writing process model in which students are encouraged to plan, draft, edit and revise their writing. SRSD is a strategy (originating in North America), which provides a clear structure to assist writers and can be used for most genres of writing, including narrative writing. There are six basic stages of instruction and four strategies for self-regulation, which include self-monitoring and goal setting, thus providing pupils with ownership for improving their own writing. SRSD uses ‘heuristics’ which provide scaffolding of structures and devices that aid the composition of argumentative writing – in particular planning – which can include examining a question, brainstorming, organising and sequencing ideas and evaluating.
The approach was created in the United States in the 1990s. It has been designed, and is suitable, for children who are aged between 8 and 14 (Andrews et al., 2006) so it is appropriate for children passing through the transition from primary to secondary school. A systematic review by Andrews et al. (2006) found that a combination of contextual factors and specific interventions based on the SRSD programme were necessary for successful practice in teaching and learning writing for 7-14 year olds. The effect sizes of individual studies, largely undertaken in North America, were very large with estimates in some instances exceeding 1 standard deviation between the intervention and control groups. For example, in a study by De La Paz and Graham (2002) of secondary school children of mixed attainment (aged between 12-14) the overall quality of their writing was 1.7 standard deviations better than the quality of writing of children in the control group 6 weeks after the intervention. Nevertheless, despite these promising results in a North American context it was important to establish whether or not such an intervention would be effective in a British setting. For this reason the intervention was appropriate for an efficacy trial in English schools.
Introduction
writing intervention SRSD, including discussion, modelling and planning. Pupils continued to receive the intervention, including memorable experiences, when they moved into Year 7.
Evaluation objectives
What is the effectiveness of the Improving Writing Quality intervention compared with ‘business as
usual’ on the writing skills of participating children?
Project team
The evaluation team, jointly comprised of staff from Durham University and the University of York, was responsible for the design, conduct, analysis and reporting of the independent evaluation.
Implementation team
Calderdale Excellence Partnership, a partnership of 23 schools in West Yorkshire, was responsible for school recruitment and ongoing relationship with schools, informing parents and pupils, intervention development (including writing a detailed description of the intervention to allow others, if necessary, to be able to replicate the intervention in other areas), intervention training and delivery, baseline data collection, overseeing outcome testing and data collection.
Ethical
review
Ethics Committees:
Durham University School of Education Ethics Committee;
York Health Sciences Research Governance Committee (by Chair’s Action).
Methodology
Trial design
The trial was designed as a pragmatic randomised controlled trial. Participating primary schools (feeding into participating secondary schools) were independently randomly allocated on a 1:1 ratio to either receive training and deliver the intervention in 2013 (the schools are labelled hereafter as being in the ’intervention group’) or to continue with ‘business as usual’ in 2013 (‘control’ or ‘comparison’ group). Primary schools allocated to the control group were offered the intervention training at the end of the trial (2014). This is known as a wait-list design and is employed to increase school recruitment and reduce school attrition and resentful demoralisation, i.e. when participants behave in a way that introduces bias in response to being allocated to a control group (Torgerson & Torgerson, 2008). Whole school, rather than class, randomisation was used because of concerns about contamination between classes within schools and also to accommodate smaller schools into the study that had a single Year 6 class. Contamination would have occurred if schools in the control group began to follow the approach while the trial was still in progress, and this would have made it more difficult to assess the intervention’s true impact.
In primary schools allocated to the intervention group the intervention was delivered to all pupils in Year 6 including those predicted to achieve below Level 4 in English at Key Stage 2. Participating secondary schools placed all eligible pupils (defined below) from primary intervention schools into one half or band of Year 7 and all eligible pupils from primary control schools into the other half or band in Year 7, which enabled the intervention to be delivered in Year 7 to eligible pupils from intervention primary schools only, minimising contamination.
The trial was designed, conducted and reported following the CONSORT standards (Altman et al., 2011) in order to minimise all potential threats to internal validity, such as selection bias and a range of post-randomisation biases (Cook and Campbell, 1969; Shadish, Cook and Campbell, 2002; Torgerson and Torgerson, 2008).
Eligibility
School recruitment and consent
The evaluation team and Calderdale Excellence Partnership (CEP) jointly provided information documentation on the trial for schools (Appendix C). CEP recruited schools from West Yorkshire using its existing and long-standing relationship with schools in the area. School recruitment took place between February and March 2013. An information event for schools, run jointly by CEP and the evaluation team, was held on 26 February 2013. This provided an opportunity to explain both the intervention and the importance of the independent evaluation and what would be required of schools which decided to take part. Schools that wanted to take part were asked to sign an ‘agreement to participate form’ (Appendix D) to ensure they agreed to all trial-related procedures.
Schools
Methodology
Secondary schools were eligible to take part in the trial if (a) they were currently working with the Calderdale Excellence Partnership and (b) they agreed to all trial procedures, including informing parents, provision of pupil data, continued provision of the intervention to eligible intervention pupils only and outcome testing.
Pupil recruitment and consent
Participating primary schools informed parents of all pupils in Year 6 about the study using material provided by the evaluation team and CEP (Appendix F). Parents had the opportunity to withdraw their child’s data from the analyses. Participating primary schools then shared pupil data with the evaluation team which included pupil name, unique pupil number (UPN), date of birth (DOB), free school meals (FSM), and Key Stage 2 (KS2) English teacher assessment from December 2012. Eligible pupils for continuation with the intervention in Year 7 were identified from this information. Pupils were eligible for continuation in Year 7 if they were predicted to achieve national curriculum Level 3 or insecure Level 4 (based on Year 6 teacher assessments).
Participating secondary schools informed parents of all pupils in Year 7 about the study using material provided by the evaluation team and CEP (Appendix G). Parents had the opportunity to withdraw their child’s data from the analyses (opt out). Participating secondary schools then shared pupil data with the evaluation team.
Pupils
Data on all Year 6 and Year 7 pupils at participating primary schools were collected for trial purposes unless a parent/carer withdrew their child. Data on all year 7 pupils at participating secondary schools were collected for trial purposes unless a parent/carer withdrew their child. All children in Year 6 at primary schools allocated to the intervention group were eligible to receive the intervention.
All pupils predicted to achieve Level 3 or an ‘insecure’ Level 4 (defined as below Level 4b) in English by the end of Key Stage 2 from primary schools allocated to the intervention were eligible to continue receiving the intervention in Year 7. (Writing assessments were based on teacher assessments conducted at the end of autumn term 2012.) Pupils not going to one of the three secondary schools who had agreed to allocate intervention and control children to different classes were not included in the main analysis of the programme’s impact, but were still recorded.
Intervention
General Information
All schools received funding to help with the provision of memorable experiences. The memorable experiences were used as the focus for pupils’ writing.
All schools in the intervention group were required to use the main elements of the SRSD writing programme (listed below) in the teaching of writing.
Secondary schools received details of all the pupils involved in the programme at primary level and these pupils were then part of the programme at secondary level.
All pupils at secondary schools could take part in any funded memorable experiences but only those pupils in English sets which contained pupils who were part of the project received tuition in the SRSD method for developing writing.
The SRSD method of developing writing was used throughout the autumn term with the intervention groups in Year 7 in each of the participating secondary schools.
All pupils working at NC Level 3 and above in Year 7 took the GL Writing test in December 2013.
Arrangements were made for visits to schools to monitor and support the implementation of the programme at both primary and secondary level.
Timescales – dates and times for implementation
Primary teachers were able to use elements of SRSD immediately after the training or could delay using the strategy until after SATs; most chose the latter.
SRSD had to be taught explicitly as part of Literacy lessons and further developed through topic work.
Secondary teachers used the SRSD approach with English sets which contained pupils in the intervention group for the teaching of writing in the autumn term.
Delivering the programme
Teachers delivered SRSD in the order outlined in the manual but were allowed to combine lessons rather than stick rigidly to the prescribed model.
When teaching a specific genre all teachers were asked to include the following elements: discussion about the genre
pre assessment – carried out by class teachers before starting the SRSD programme on any genre
mnemonics – the mnemonic recommended for use was IPEELL: I= Introductory paragraph; P= Points; E = Examples/elaboration; E=End; L=Links (connectives, openers); L = Language (wow words, genre specific vocabulary, punctuation)
graphic organisers – all schools were asked to use the same graphic organiser (planning scaffold)
Methodology
‘self-talk’ – to be used at all stages (the American practice of ‘self-talk’ was Anglicised using the terms ‘positive talk’ and ‘motivational messages’)
peer scoring final assessment.
Monitoring and support
Monitoring visits took place in June and July in primary schools.
Monitoring visits took place in October and November in secondary schools. Support was available from April 2013 for all schools.
Liaison with secondary colleagues
Some secondary colleagues took the opportunity to visit primary schools to see SRSD in action and to discuss what had been covered so that teachers could build on existing experiences in the autumn term.
Development of toolkit
After the project is completed, teachers involved will meet to discuss the implementation of the programme and to put forward ideas for materials that could be included in a toolkit that will help any other schools that wish to use the strategy.
Outcomes
The Progress in English (PiE) 11: Second Edition Long Form (LF) Test, GL Assessment, was the main literacy outcome measure. The test includes both narrative and non-narrative exercises and assesses both reading and writing skills including areas such as spelling, grammar and comprehension. The Progress in English Test was the only test available to the evaluation team (in order to comply with EEF testing policy) which included a writing component.
informative writing. Overall, the extended writing task score can be in the range 0 to 32, with a higher score representing higher attainment.
Secondary outcome
Reading score, the combined raw score on the reading tasks (Exercises 3, 4, 3x and 4x), was used as the secondary outcome. Exercise 3 (comprising Exercises 3 and 3x) has a maximum total of 19 marks and assesses reading comprehension of a narrative. Exercise 4 (comprising exercises 4 and 4x) has a maximum of 13 marks and assesses non-narrative reading comprehension. Overall, reading score can range between 0 and 32, with a higher score representing higher attainment.
Spelling and grammar score, the combined raw score on the spelling and grammar tasks (Exercises 1 and 2) was chosen as a further secondary outcome. Exercise 1 has a maximum of 10 marks and assesses spelling. Exercise 2 also has a maximum of 10 and assesses grammar. This means the spelling and grammar score combined can range from 0 to 20, with a higher score representing higher attainment.
Sample size
The focus of this evaluation was on children who were performing at either national curriculum Level 3 or insecure Level 4 in English and hence the sample size calculation was based upon this population of children.
Prior to recruitment it was anticipated that approximately 24 primary schools would be involved in this study. The average Year 6 cohort in Calderdale was estimated at 45 pupils and it was predicted that between a quarter and a third of pupils would meet the eligibility criteria. This meant that, on average, there would be between 11 and 15 eligible pupils per primary school. Assuming, conservatively, 12 pupils per school meant that around 288 pupils would be eligible for the trial (144 per group). Assuming an intra-cluster correlation coefficient of 0.19 (from ECC randomised trial, Torgerson et al., 2011) would give a design effect of 3.09. Dividing the number of pupils in the trial (288) by this design effect gives an ‘effective sample size’ of approximately 94 pupils. However, we also assumed a pre- and post-test correlation of 0.70 which inflates the effective sample size to 192 pupils. After allowing for an estimated attrition rate of 10% this leads to an effective sample size of 172 pupils. This would give 80% power to show a difference of 0.43 standard deviations in writing score between the two groups providing a difference of this magnitude exists.
Randomisation
Methodology
The evaluation team provided allocation information to the implementation team for them to disseminate this to the schools. Due to an administrative error within the evaluation team, there was a discrepancy between the minimisation output and the allocation information which was provided to CEP in relation to two schools. This meant that one school was informed that they had been allocated to the control group when in fact the minimisation had assigned them to receive the intervention and that another was informed they had been allocated to the intervention arm when in fact the minimisation had assigned them to the control arm. As this administrative error occurred before the delivery partners or schools were informed of allocations, and therefore was an independent error, no bias should be introduced. The schools, therefore, were analysed according to the allocations received by the schools.
Analysis
Analysis was conducted in Stata® version 13 (Stata Corporation, College Station, Texas, USA) using the principles of ‘intention-to-treat’, meaning that all schools and pupils were analysed in the group they were randomised to irrespective of whether or not they actually received the intervention.
Statistical significance was assessed at the 5% level unless otherwise stated. Regression based methods of analysis were used and 95% confidence intervals are provided as appropriate.
Effect sizes were calculated and are presented alongside 95% confidence intervals. Effect size is defined as:
where βintervention is the difference in mean score between the intervention and control groups and σε is
the residual standard deviation. The residual standard deviation was used rather than the more usual pre-test standard deviation as there was no equivalent pre-test value. Numerical values used to calculate the effect sizes for each analysis can be found in Appendix Q.
The test and outcomes were examined for ceiling or floor effects using summary statistics and graphical representations.
Estimates of the intra-cluster correlation coefficients (ICCs) for secondary school class and primary school in terms of both primary outcome and raw score are provided. No estimates are presented for secondary schools due to the small number of schools involved. The correlation between predicted KS2 Level and both raw score and primary outcome is also explored.
class level. Due to the small number of secondary schools involved in this trial, secondary school was not included as a random effect in the primary analysis.
Secondary analyses
An analogous approach to the primary analysis was used to examine differences between the intervention and control groups in terms of the secondary outcomes of reading, spelling and grammar for pupils meeting the inclusion criteria.
To assess the impact on pupils who were not eligible to receive the intervention and thus only receiving the intervention in Year 6, a similar analytical approach to that used in the primary analysis was applied three times including pupils predicted to achieve a Level 4a or above. Each repetition of this analysis looked at differences in extended writing score, reading score, and spelling,and grammar score respectively.
A similar analytical approach was used to assess the effectiveness of the intervention on writing skills for all children at Level 3 and above who received the intervention in either just Year 6 (those ineligible), or Years 6 and Year 7 (those eligible).
Regression models were also used to compare differences between the intervention and control groups with respect to the secondary outcomes of reading, spelling and grammar for all children at Level 3 and above.
Sub-group analysis
The effect of the intervention in terms of extended writing score was also analysed for the sub-group of pupils eligible for free school meals (FSM) through the inclusion of an interaction between FSM status and allocation in a further repetition of the primary analysis. This sub-group was chosen by the funder a priori before the study started and is a subgroup of interest for all EEF projects. Statistical significance was set at the 10% level as this trial was not powered to detect interactions.
As required by the funding body, an analogous regression to that used in the primary analysis was used to examine the effect of the intervention on pupils eligible for FSM, excluding all those not eligible for FSM.
Sensitivity analyses
The primary analysis was repeated including secondary school as a random effect.
Process evaluation methodology
A ‘light touch’ process evaluation was conducted, primarily to assess fidelity and potential
Methodology
SRSD intervention in line with the training received? (fully, partially, not at all) and (2) Do participating pupils have the opportunity to practise SRSD techniques? (fully, partially, not at all).
CEP also conducted a brief survey of all participating primary schools (both intervention and control) to collect information on the memorable experiences conducted by schools, and (from intervention schools only) to obtain views on the impact of the SRSD intervention.
Impact evaluation
Participants
School recruitment
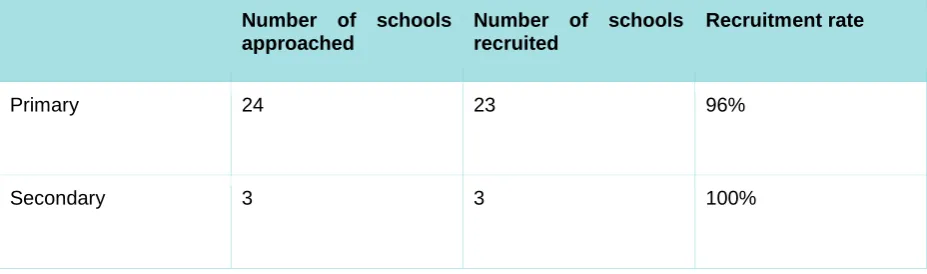
CEP approached 24 primary schools to consider taking part in the trial (Table 1). All schools were members of CEP and were positive about taking part; however one school was excluded because it felt unable to deliver the intervention in 2013 if allocated to the intervention group due to being in special measures.
[image:17.595.66.530.357.494.2]CEP approached three secondary schools, all of whom were willing to implement all necessary trial procedures.
Table 1. School recruitment
Number of schools approached
Number of schools recruited
Recruitment rate
Primary 24 23 96%
Secondary 3 3 100%
Pupil recruitment
All 23 primary schools sent opt-out letters to parents of all children in Year 6. In total 865 letters were sent and 23 (2.7%) opt-out forms were returned.
All three secondary schools sent opt-out letters to parents of all children in Year 7. In total nine opt-out forms were returned: two of these pupils had also opted-out at Year 6 and there were seven new opt-outs.
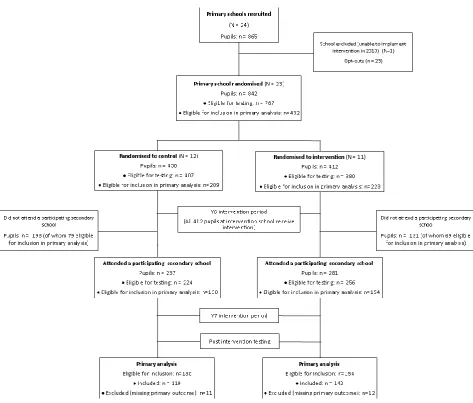
Participant flow
Impact evaluation
842) who were predicted to achieve a Level 3 or insecure Level 4 in KS2 English and hence were eligible for inclusion in the primary analysis.
Twelve schools (containing 430 participating pupils) were randomised to the control condition and 11 schools (containing 412 participating pupils) were randomised to receive the intervention in 2013. There were 209 pupils in control schools and 223 pupils in intervention schools who were eligible for inclusion in the primary analysis.
When the pupils made the transition to secondary school, 193 of the 430 pupils at control schools did not attend participating secondary school; 79 of these 193 pupils would have been eligible for inclusion in the primary analysis, had they attended one of the three secondary schools. These 79 pupils did not attend the three designated secondary schools for a variety of reasons such as parental choice or moving out of the area. This left 237 pupils from control primary schools participating in the trial in Year 7, of whom 130 were eligible for inclusion in the primary analysis. There were 131 pupils from intervention primary schools who did not attend a participating secondary school; 69 of these pupils would have been eligible for inclusion in the primary analysis. This left 281 pupils from intervention primary schools participating in the trial in Year 7, of whom 154 were eligible for inclusion in the primary analysis.
After the exclusion of pupils without the primary outcome of extended writing score, the primary analysis was conducted on 142 intervention pupils and 119 control pupils.
There were 518 pupils who attended both a participating primary and secondary school; of these 480
were eligible for testing. Only 7.7% (37 out of 480) of these pupils did not complete all the writing
exercises on the test and hence did not have a primary outcome. Slightly more males than females did not complete all the writing components (23 compared to 14) and more pupils who were not eligible for FSM had a missing value than those who were eligible for FSM. Just under half of the 37 pupils with no primary outcome had English as an additional language, and these had predicted levels ranging from Level 3c to Level 5b. Nearly half of these pupils (18 of 37) were missing secondary outcome
Figure 1. CONSORT diagram
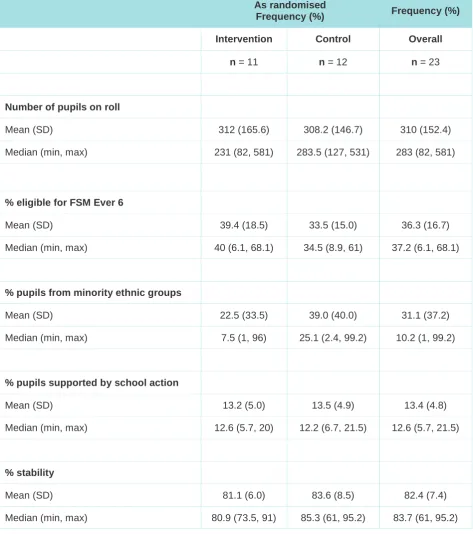
School characteristics
Impact evaluation
Table 2. School level characteristics
As randomised
Frequency (%) Frequency (%)
Intervention Control Overall
n = 11 n = 12 n = 23
Number of pupils on roll
Mean (SD) 312 (165.6) 308.2 (146.7) 310 (152.4)
Median (min, max) 231 (82, 581) 283.5 (127, 531) 283 (82, 581)
% eligible for FSM Ever 6
Mean (SD) 39.4 (18.5) 33.5 (15.0) 36.3 (16.7)
Median (min, max) 40 (6.1, 68.1) 34.5 (8.9, 61) 37.2 (6.1, 68.1)
% pupils from minority ethnic groups
Mean (SD) 22.5 (33.5) 39.0 (40.0) 31.1 (37.2)
Median (min, max) 7.5 (1, 96) 25.1 (2.4, 99.2) 10.2 (1, 99.2)
% pupils supported by school action
Mean (SD) 13.2 (5.0) 13.5 (4.9) 13.4 (4.8)
Median (min, max) 12.6 (5.7, 20) 12.2 (6.7, 21.5) 12.6 (5.7, 21.5)
% stability
Mean (SD) 81.1 (6.0) 83.6 (8.5) 82.4 (7.4)
possible that this discrepancy could be due to a misreported primary school in the Year 7 data or due to the fact that the pupils did not attend a participating primary school at the time of baseline data collection in December 2013. These pupils are therefore excluded from analyses and are not included
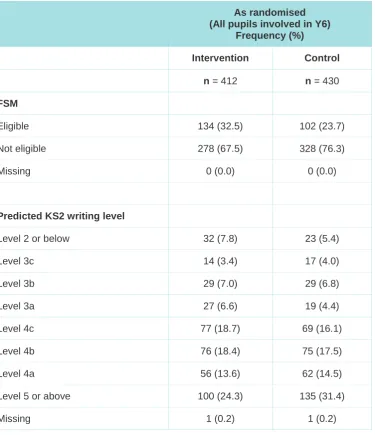
in Year 6 figures. Proportions of pupils at each predicted level were fairly similar between trial arms;
[image:21.595.74.450.218.654.2]however the proportion of FSM pupils was slightly higher in the intervention group at 32.5% compared to 23.7% of the control group.
Table 3. Pupil level characteristics for all pupils
As randomised (All pupils involved in Y6)
Frequency (%)
Intervention Control
n = 412 n = 430
FSM
Eligible 134 (32.5) 102 (23.7)
Not eligible 278 (67.5) 328 (76.3)
Missing 0 (0.0) 0 (0.0)
Predicted KS2 writing level
Level 2 or below 32 (7.8) 23 (5.4)
Level 3c 14 (3.4) 17 (4.0)
Level 3b 29 (7.0) 29 (6.8)
Level 3a 27 (6.6) 19 (4.4)
Level 4c 77 (18.7) 69 (16.1)
Level 4b 76 (18.4) 75 (17.5)
Level 4a 56 (13.6) 62 (14.5)
Level 5 or above 100 (24.3) 135 (31.4)
Missing 1 (0.2) 1 (0.2)
Impact evaluation
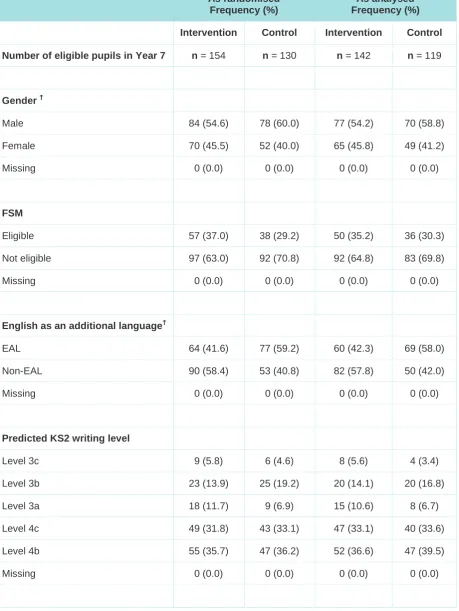
Table 4. Pupil-level characteristics for pupils predicted a Level 3 or insecure Level 4 and attending a participating secondary school
As randomised Frequency (%)
As analysed Frequency (%)
Intervention Control Intervention Control
Number of eligible pupils in Year 7 n = 154 n = 130 n = 142 n = 119
Gender †
Male 84 (54.6) 78 (60.0) 77 (54.2) 70 (58.8)
Female 70 (45.5) 52 (40.0) 65 (45.8) 49 (41.2)
Missing 0 (0.0) 0 (0.0) 0 (0.0) 0 (0.0)
FSM
Eligible 57 (37.0) 38 (29.2) 50 (35.2) 36 (30.3)
Not eligible 97 (63.0) 92 (70.8) 92 (64.8) 83 (69.8)
Missing 0 (0.0) 0 (0.0) 0 (0.0) 0 (0.0)
English as an additional language†
EAL 64 (41.6) 77 (59.2) 60 (42.3) 69 (58.0)
Non-EAL 90 (58.4) 53 (40.8) 82 (57.8) 50 (42.0)
Missing 0 (0.0) 0 (0.0) 0 (0.0) 0 (0.0)
Predicted KS2 writing level
Level 3c 9 (5.8) 6 (4.6) 8 (5.6) 4 (3.4)
Level 3b 23 (13.9) 25 (19.2) 20 (14.1) 20 (16.8)
[image:22.595.69.529.135.747.2]As randomised Frequency (%)
As analysed Frequency (%)
Mean predicted KS2 writing levels n =142 n = 119
3.81 (1.23) 3.89 (1.20) Month of birth †
Sept – Nov 38 (24.7) 27 (20.8) 35 (24.6) 24 (20.2)
Dec – Feb 41 (26.6) 30 (23.1) 37 (26.1) 29 (24.4)
Mar – May 40 (26.0) 34 (26.2) 38 (26.8) 31 (26.1)
Jun – Aug 35 (22.7) 39 (30.0) 32 (22.5) 35 (29.4)
Missing 0 (0.0) 0 (0.0) 0 (0.0) 0 (0.0)
†
Only collected inYear 7, however these are time constant variables and as such are still presented.
Outcomes and analysis
Of the 23 primary schools, eight sent pupils to only one secondary school, seven sent pupils to two different secondary schools and another seven sent pupils to all of the secondary schools involved in the trial. One school did not send any pupils to a participating secondary school.
Of the three secondary schools, one was fed into by 10 participating primary schools, another had 14 feeder primaries and the last received pupils from 19 of the participating schools.
There were 28 Year 7 classes spread across the three secondary schools. One secondary school class had no individuals from a participating primary school, the other 27 classes contained pupils from between two and 23 participating primary schools.
The post-test and outcomes were assessed for ceiling or floor effects using histograms and summary statistics. Ceiling effects occur if a test is too easy (e.g. lots of pupils achieve a perfect score), while floor effects occur if a test too hard (e.g. lots of pupils score zero). Both types of effect can unfairly reduce the apparent impact of the intervention. No evidence of either effect was found (details in Appendix O).
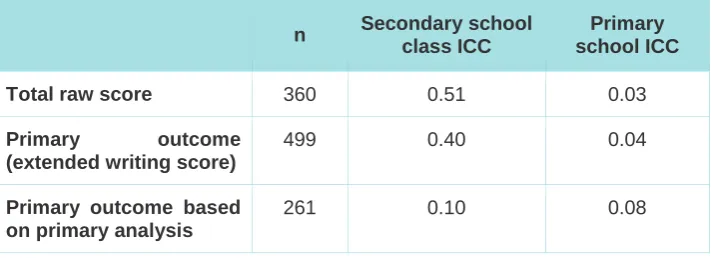
Intra-cluster correlation coefficients (ICCs) were estimated (Table 5). The secondary class ICC based
on the primary analysis (0.10) is slightly smaller than the one that was used for the sample size
calculation estimate (0.19) which was derived from a maths study.All primary school ICCs were fairly
small. However, as post test data were not available for pupils who did not attend a participating secondary school, this is based on a sub-group of those who were involved in the trial in Year 6.
The correlation between primary outcome (the extended writing score) and the predicted KS2 level for
those eligible for inclusion in the primary analysis was also lower than expected (Spearman’s Rho
Impact evaluation
Table 5. Estimated intra-cluster correlation coefficients (ICCs).
n Secondary school class ICC
Primary school ICC
Total raw score 360 0.51 0.03
Primary outcome (extended writing score)
499 0.40 0.04
Primary outcome based on primary analysis
261 0.10 0.08
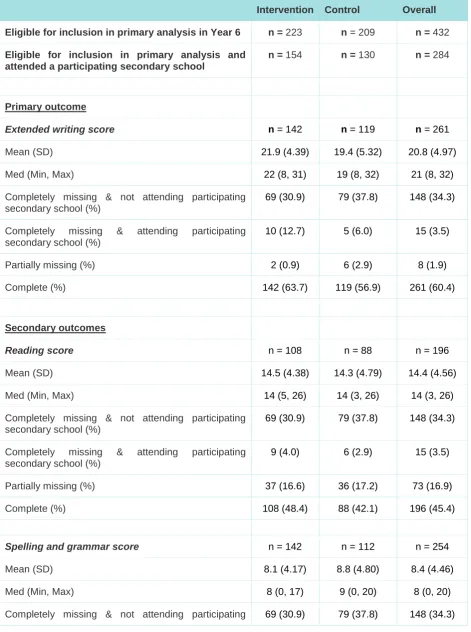
Table 6. Unadjusted average scores for the intervention and control groups for those
eligible for inclusion in the primary analysis
Intervention Control Overall
Eligible for inclusion in primary analysis in Year 6 n = 223 n = 209 n = 432
Eligible for inclusion in primary analysis and attended a participating secondary school
n = 154 n = 130 n = 284
Primary outcome
Extended writing score n = 142 n = 119 n = 261
Mean (SD) 21.9 (4.39) 19.4 (5.32) 20.8 (4.97)
Med (Min, Max) 22 (8, 31) 19 (8, 32) 21 (8, 32)
Completely missing & not attending participating secondary school (%)
69 (30.9) 79 (37.8) 148 (34.3)
Completely missing & attending participating secondary school (%)
10 (12.7) 5 (6.0) 15 (3.5)
Partially missing (%) 2 (0.9) 6 (2.9) 8 (1.9)
Complete (%) 142 (63.7) 119 (56.9) 261 (60.4)
Secondary outcomes
Reading score n = 108 n = 88 n = 196
Mean (SD) 14.5 (4.38) 14.3 (4.79) 14.4 (4.56)
Med (Min, Max) 14 (5, 26) 14 (3, 26) 14 (3, 26)
Completely missing & not attending participating secondary school (%)
69 (30.9) 79 (37.8) 148 (34.3)
Completely missing & attending participating secondary school (%)
9 (4.0) 6 (2.9) 15 (3.5)
Partially missing (%) 37 (16.6) 36 (17.2) 73 (16.9)
Complete (%) 108 (48.4) 88 (42.1) 196 (45.4)
Spelling and grammar score n = 142 n = 112 n = 254
Mean (SD) 8.1 (4.17) 8.8 (4.80) 8.4 (4.46)
Med (Min, Max) 8 (0, 17) 9 (0, 20) 8 (0, 20)
Impact evaluation
Intervention Control Overall
secondary school (%)
Completely missing & attending participating secondary school (%)
8 (3.6) 8 (3.8) 16 (3.7)
Partially missing (%) 4 (1.8) 10 (4.8) 14 (3.2)
Primary analysis – impact of approach on extended writing of pupils between Level 3c
and 4b
The primary analysis was adjusted for baseline-predicted KS2 writing level, gender, FSM status, EAL status and month of birth. After exclusion for missing data relating to any of these variables or the response, analysis was conducted on 261 pupils: 142 from the intervention group and 119 from the control group. There was evidence of a difference in extended writing score between the allocated groups, with a significant increase of 2.53 marks for those in the intervention group when compared with those in the control group (p=0.002, 95% CI: 0.90 to 4.16). This relates to an effect size of 0.74 (95% CI: 0.26 to 1.22). Full details of coefficients for all covariates can be found in Appendix P.
Secondary analyses
The primary analysis was repeated using reading score as the response. After exclusion for missing data relating to any covariates or the response, analysis was conducted on 196 pupils: 108 from the intervention group and 88 from the control group. There was no evidence of a difference in reading scores between the allocated groups, with a non-significant decrease of 0.31 marks for those in the intervention group when compared with those in the control group (p=0.72, 95% CI: -2.02 to 1.41). This relates to an effect size of -0.09 (95% CI: -0.59 to 0.41).
The primary analysis was also repeated using spelling and grammar score as the response. After exclusion for missing data relating to any covariates or the response, analysis was conducted on 254 pupils: 142 from the intervention group and 112 from the control group. There was no evidence of a difference in spelling and grammar score between the allocated groups, with a non-significant decrease of 0.44 marks for those in the intervention group when compared with those in the control group (p=0.50, 95% CI: -1.72 to 0.84). This relates to an effect size of -0.13 (95% CI: -0.51 to 0.25).
Pupils at Level 4a and above
To assess the impact on the writing skills of pupils who were not eligible to receive the intervention and thus only received the intervention in Year 6, the primary analysis was repeated using only pupils at Level 4a and above. After exclusion for missing data relating to any of covariates or the response, analysis was conducted on 181 pupils; 94 from the intervention group and 87 from the control group. There was no evidence of a difference in extended writing score between the allocated groups, with a non-significant increase of less than 0.01 marks for those in the intervention group when compared with those in the control group (p=1.00, 95% CI: -1.38 to 1.38). This relates to an effect size of approximately 0.00 (95% CI: -0.45 to 0.45). This could be due to a number of factors, for example the fact that these pupils did not receive the full intervention.
This analysis was repeated using the same individuals (those at Level 4a or above) but with reading score as the response variable. After exclusion for missing data relating to any of the covariates or the response, analysis was conducted on 148 pupils; 81 from the intervention group and 67 from the control group. There was no evidence of a difference in reading score between the allocated groups, with a non-significant decrease of 0.39 marks for those in the intervention group when compared with those in the control group (p=0.59, 95% CI: -1.80 to 1.02). This relates to an effect size of -0.12 (95% CI: -0.58 to 0.33).
Impact evaluation
marks for those in the intervention group when compared with those in the control group (p=0.89, 95% CI: -1.43 to 1.64). This relates to an effect size of 0.04 (95% CI: -0.49 to 0.56).
Sub-group analysis
A pre-specified subgroup analysis was conducted. The effect of the intervention on pupils eligible for FSM was assessed through the inclusion of an interaction term in a repetition of the primary analysis. Statistical significance was assessed at the 10% level. There was no evidence of a statistically significant interaction between allocated group and FSM status (p=0.69) suggesting the intervention did not have a differential effect dependent on FSM status.
As required by the funding body, the primary analysis was repeated in the subgroup of pupils eligible for FSM. After exclusion for missing data relating to any of these variables or the response and for pupils not eligible to receive FSM, analysis was conducted on 86 pupils; 50 from the intervention group and 36 from the control group. There was evidence of a difference, which reflects the main analysis, in extended writing score between the allocated groups, with a significant increase of 3.34 marks for those in the intervention group when compared with those in the control group (p=0.02, 95% CI: 0.55 to 6.13). This relates to an effect size of 1.60 (95% CI: 0.21 to 2.98). Note, however, that although the effect size for this subgroup appears to be much larger than the overall effect size, the test for interaction, described above, showed no evidence that this apparent difference was caused by anything other than chance.
Sensitivity analysis
When the primary analysis was repeated also accounting for clustering at the secondary school level, results were consistent with those obtained in the primary analysis.
Cost
The costs to schools of repeating the programme is estimated at:
- one day’s training – venue, equipment, refreshments and training materials (£900) - SRSD trainers, with one day’s preparation (£900 per trainer)
- memorable experiences per class (£1,500).
The following assumptions are built into the calculations for implementation by other schools: - SRSD training delivered to 30 teachers
etc.) which, if reproduced commercially, is estimated will cost in the region of £50 to £100. A school would only need to buy one toolkit.
Costs in future years would relate to the cost of the chosen memorable experiences and any further training required for teachers new to the school.
Process evaluation
Only two of the intervention schools opted to implement the intervention before the Standard
Assessment Tests (SATs) in May (as they did not wish to disrupt children’s progress towards the
SATs). The implication of this is that in most primary schools the intervention was only delivered over approximately a six-week period. Generally the feeling, reported by CEP, was that most schools would have preferred to have started using the intervention earlier, with many teachers commenting on the positive impact it had had on children within their class. Most of the intervention primary schools also
reported to CEP that they intended to use the intervention from September with the following year’s
Year 6 and Year 7 children and to introduce it into other year groups.
Classroom observation
One classroom observation in total was conducted, and therefore any findings and conclusions should be interpreted with extreme caution. This session was delivered especially for the evaluation team (at the end of summer term). The session clearly demonstrated many of the essential elements of the SRSD intervention that had been outlined to schools by CEP related to planning to write. It was clear that the session was the first of two, and it covered all the elements related to planning and preparing to write. The session did not involve the children actually writing, or conducting any self-scoring or graphing: this was due to be covered in a second session.
Informal teacher interview
An informal discussion was held with one teacher who had been delivering the intervention, along with a member of CEP. In her view, the training received was too ‘American’ and ‘not the way things would be done here’, especially the ‘self-talk’ and motivational elements. She suggested that the training could have been condensed into one day rather than two. She had not accessed any of the additional resources suggested and also noted that she had not made use of the manual provided at the training day, except when, as a school, they designed their own scaffold. She noted that CEP had given them flexibility and that they had gone on to adapt and use the intervention as they felt suited their school. Overall the teacher was extremely positive about the intervention (although noted this was as adapted and used by CEP rather than the way they were trained). She felt the intervention had been very beneficial and intended to continue using it the following year. She also felt that the children had
internalised the techniques and that this was demonstrated in the ‘cold writing tasks’ where children
were given no guidance but used the techniques taught of their own accord.
The teacher noted that at the beginning some children were spending more time on the mathematical elements (graphs), and as a school they knew they needed to alter this as it clearly wasn’t the purpose of the intervention.
Impact evaluation
This school did not start using the intervention until after SATs and reported that there had been too little time after SATs, but that they intended to use the intervention from the following September with the new Year 6.
The teacher also reported that she did not feel that the children’s writing skills improved solely due to writing about a memorable experience, as at the beginning of the intervention period they had conducted a ‘cold writing task’ based on a memorable experience, because they were interested to know for themselves if the SRSD intervention would make a difference above and beyond writing about a memorable experience. The teacher reported that, in her view, that the SRSD intervention was the element that made the difference not just writing about memorable experiences.
This school conducted their own process evaluation of the intervention by asking participating children their views on the intervention. A large majority of the children noted that they had found the self-scoring and graphing very important and helpful as it allowed them to see what elements of their writing they needed to improve. It also increased their confidence when they could visually see they were making progress.
Discussions with Calderdale Excellence Partnership
From ongoing discussions with CEP throughout the trial period, it was clear that a process of ‘intervention development’ occurred over the trial period and is ongoing. CEP gave the primary schools flexibility to develop and implement some components of the intervention as each saw fit following the training received in March 2013. CEP also noted the ‘American-ness’ of the intervention and felt it needed to be to be Anglicised for the English classroom context. This was especially true of
the ’self-talk’ element which CEP reported many of the primary schools had reframed into a more
British approach.
CEP delivered their own refresher training to secondary schools in September, and incorporated ‘lessons learnt’ and adaptations following the intervention period in primary schools. CEP have set up a working group to discuss how the intervention should be modified and adapted for implementation next year.
Implementation
Conclusion
The results of this large cluster randomised controlled trial are in line with a systematic review of previous, largely American, trials showing SRSD is an effective strategy for teaching writing skills. Though the finding is consistent with existing research, the positive effect size for the primary outcome (in excess of 0.70 standard deviations) was nonetheless remarkably large. Although there appeared to be an even larger difference within the FSM subgroup, this difference between FSM and non-FSM pupils was not close to being statistically significant. Consequently, there is a high likelihood that the difference is simply due to chance.
Strengths of the evaluation
In the design and conduct of our study we used best practice as defined by the CONSORT guidelines for randomised controlled trials (Altman et al., 2011). Importantly, we used independent concealed allocation to ensure that the clusters were allocated without the possibility of bias. We used the principles of intention-to-treat by including all consenting eligible classes, teachers and children in the final analysis. We pre-specified our main outcome and wrote a statistical analysis plan before we observed the data. We also used an independent company to mark the test papers, blind to the allocated group.
Limitations of the evaluation
The trial was only undertaken within a narrow geographical area of the UK, however about 30% of pupils were eligible for FSM and 30% were from ethnic minorities, suggesting that the results are applicable across different sub-groups within the population. From the process evaluation there is evidence that teachers adapted the SRSD intervention into an English context as they felt that it was too ‘American’; therefore the description of the intervention may not be actually what was implemented within the typical classroom. In addition, we cannot disentangle the effectiveness of the individual components of the intervention (e.g. the training or the implementation of the intervention with pupils in primary or secondary schools).
Interpretation
Conclusion
Future research and publications
References
Altman D.G., Moher D. & Schulz K.F. (2012). ‘Improving the reporting of randomised trials: the CONSORT Statement and beyond.’ Statist. Med., 31: 2985–2997.
Andrews R., Torgerson C., Low G., McGuinn N., Robinson A. (2006). ‘Teaching argumentative non-fiction writing to 7–14 year olds: a systematic review of the evidence of successful practice.’ Technical report in Research Evidence in Education Library. London: EPPI-Centre, Social Science Research Unit, Institute of Education, University of London.
Cook T.D. & Campbell D. (1979). Quasi-experimentation: Design and Analysis Issues for Field
Settings. Boston: Houghton Mifflin.
De La Paz S., Graham S. (2002). ‘Explicitly teaching strategies, skills, and knowledge: Writing instruction in middle school classrooms.’ Journal of Educational Psychology 94: 687-698.
Department of Education (2013a). ‘National Curriculum Assessments at Key Stage 2 in England, 2013’. (Revised) (Reference IdL SFR51/2013). Statistical First Release.
Department of Education (2013b). ‘Schools, Pupils and their Characteristics: January 2013’. (Reference IdL SFR21/2013). Statistical First Release.
Department of Education (2014). ‘GCSE and Equivalent Results in England 2012/13’. (Revised) (Reference IdL SFR01/2013). Statistical First Release.
Galton, M. Gray J. and Ruddock J. (1999). The impact of school transitions and transfers on pupil
progress and attainment. Norwich, DfEE publications, September, 1999.
Shadish W.R., Cook T.D. & Campbell D.T. (2002). Experimental and Quasi-Experimental Designs for
Generalized Causal Inference. Boston, MA, US: Houghton, Mifflin and Company.
Torgerson D.J. & Torgerson C.J. (2008). Designing Randomised Trials in Health, Education and the
Social Sciences: An Introduction. Palgrave Macmillan.
Appendices
Appendix A: Trial Diagram
Control Group
Schools N = 12
Children N =144
No intervention
(Primary Schools will receive intervention next
academic year)
Primary School -
Cluster
Randomisation
Intervention Group
Schools N = 12
Children N =144
Package based on SRSD. Memorable experiences during Summer term 2013. Continued intervention in Year 7 in Secondary
Schools). Children recruited n = 288
(based on 12 children per school)
Inclusion criteria:
Yr 6
predicted to achieve Level 3 or an insecure level 4 in English by the end of Key Stage 2 (based on teacher assessments conducted at the end of Autumn term 2012)
Primary Schools Recruited n = 24
Secondary Schools Recruited n = 3
Excluded
Not meeting inclusion criteria Other reasons
Baseline data collection Feb 2013
Key stage 2 English Teacher Assessments from Dec 2012
Follow up data collection Dec 2013
Appendix B: Trial Timelines
Calderdale Timeline
Dec-12 Jan-13 Feb-13 Mar-13 Apr-13 May-13 Jun-13 Jul-13 Aug-13 Sep-13 Oct-13 Nov-13 Dec-13 Jan-14 Feb-14 Mar-14 Apr-14 Apply for University Ethics
Appendices
Appendix C:
Expression
of
Interest
Document for Schools
Evaluation of Calderdale Excellence Partnership Improving Writing Quality
intervention
The Education Endowment Foundation has asked researchers at the University of York and Durham University to evaluate the Improving Writing Quality
intervention being delivered and supported by the Calderdale Excellence Partnership in 2013 and 2014. In addition to providing memorable experiences for the pupils the intervention will include professional development for teachers in key elements of the writing intervention Self-Regulated Strategy Development (SRSD), including discussion, modelling and planning. The evaluation aims to find out if the intervention helps to improve pupils’ writing skills during the transition from Year 6 to Year 7, especially the writing skills of pupils who are currently working at KS2 Level 3 or a fragile KS2 Level 4.
All primary schools who decide to take part in the intervention and its evaluation will be asked to provide information to Durham University about all pupils currently in Year 6 at their school. The information will include each Year 6 pupil’s UPN and their KS2 teacher assessment (from the end of the autumn term 2012) plus some basic demographic information about the school.
Primary schools will then be randomly allocated in March 2013 by an independent researcher at the University of York to either implement the intervention in summer term 2013 with their Year 6 pupils or wait to implement the intervention in summer term 2014 with Year 6 pupils. Notice will be taken of the demographic information to ensure that the two groups are balanced. Schools delivering the programme in 2013 will receive training in March 2013. The intervention will be delivered to all Year 6 pupils in the experimental
part in the activities in the autumn term 2013), and all pupils from primary schools who have not been running the programme in 2013 into the other half of Year 7 (who will receive the usual teaching in autumn term 2013). The intervention will be delivered to those classes/sets in which there are pupils from the intervention schools.
At the end of autumn term 2013 all Year 7 pupils (with some exceptions where needed) in participating secondary schools will complete the GL Assessment Progress in English (PiE) 11 (Long Form). Secondary schools will send the pupils’ results to Durham University.
The PiE results of all pupils taking part in the intervention will then be compared with the results of all children receiving the usual teaching, in order to estimate the effect the intervention has had on pupils’ writing skills.
What commitment would this project require from schools?
Enthusiasm for the project and for your own professional learning
Provision of baseline data about pupils in Year 6 (primary schools)
Willingness to allow random allocation to the ‘Memorable Experiences’ intervention in 2013 or 2014 (primary schools)
We hope to randomise participating schools in early March 2013. The first CPD days will be in March 2013. For primary schools allocated to implement the intervention in 2013, the activities will begin after the Easter holidays.
Is there funding to support my involvement?
Yes – funding for memorable experiences, training and development.
Please come to the information meeting to find out more
Appendices
Appendix D: Primary School Agreement to participate form
Evaluation of Calderdale Excellence Partnership Improving Writing Quality intervention
Primary School Agreement to Participate
I confirm that I have read and understood the information sheet for the above evaluation and have had the opportunity to ask questions;
I understand that all children’s results will be kept confidential and that no material which could identify individual children or the school will be used in any reports of this evaluation;
I agree to send an information letter out to all parents/carers of children in Year 6 and collect in any returned opt out forms;
I agree to provide baseline data about pupils in Year 6 to the evaluation team, Calderdale Excellence Partnership and EEF(excluding any pupils for whom opt out forms have been returned)
I understand that named baseline data will be matched with the National Pupil Database and shared between the evaluation team, Calderdale Excellence Partnership and EEF.
I agree to random allocation to implement the ‘Improving Writing Quality’ intervention in 2013 or 2014
I agree to staff attending professional development days
School Tel no
………..……… ….
Headteacher Email address
………
Name of School Contact (if not
headteacher)………
School Contact email
address………
Signature of
headteacher….……….Date…..……….
Thank you for agreeing to take part in this research. Please return this consent form at the information meeting or afterwards by post to:
Appendices
Appendix E: Secondary School Agreement to participate
form
Evaluation of Calderdale Excellence Partnership Improving Writing Quality intervention
Secondary School Agreement to Participate
I confirm that I have read and understood the information sheet for the above evaluation and have had the opportunity to ask questions;
I understand that all children’s results will be kept confidential and that no material which could identify individual children or the school will be used in any reports of this evaluation;
I agree to place all pupils from primary schools implementing the intervention in 2013 in one half of Yr 7 and all pupils from primary schools waiting to implement the intervention in 2014 in the other half of Yr 7;
I agree to implement the ‘Improving Writing Quality’ intervention with children in Year 7 from primary schools implementing the intervention in 2013;
I agree to staff attending professional development days
I agree to send an information letter out to all parents/carers of children in Year 7 and collect in any returned opt out forms;
I agree to administer a writing test to all Year 7 pupils in December 2013;
………
Name of School
……… ………
School Tel no
………..……… ……….
Headteacher Email address
……… …………
Name of School Contact (if not
headteacher)………
School Contact email
address……… ………
Signature of
headteacher….……….Date….. ……….
Thank you for agreeing to take part in this research. Please return this consent form at the information meeting or afterwards by post to:
Appendices
Appendix F: Parent and Pupil Information Letter Year 6
[INSERT DATE]
[INSERT SCHOOL NAME] Dear Parent / Carer
Your child’s school is taking part in the Improving Writing Quality programme evaluation. Durham University and the University of York have been asked by the Education Endowment Foundation (an organisation funding research into education) to independently evaluate the Improving Writing Quality
programme.
The Improving Writing Quality programme is being led by the Calderdale Excellence Partnership (an
organisation which helps schools in the Calderdale area). It is designed to improve children’s writing skills during the transition from Year 6 to Year 7. Good writing skills are important for all children. To find out how well the Improving Writing Quality programme works some schools will use the Improving Writing Quality pr