Introduction
Neurofibromatosis type 1 (NF1) patients show a predisposition to the formation of both periph-eral and central nervous system (CNS) tumors. While most NF1-associated CNS neoplasms are low grade astrocytomas with classic features of pilocytic astrocytoma (PA) (49%), a subset re-main difficult to classify past the simple desig-nation “low grade astrocytoma subtype indeter-minate” (LGSI) (17%) despite detailed histologic examination [1]. No statistically significant dif-ferences were noted between the two groups when comparing mitotic activity, MIB-1 labeling indices, p53 labeling indices, degree of
micro-scopic infiltration, time to recurrence after sur-gery, radiographic progression, or overall dis-ease-specific survival times [1]. It is unknown what relationship LGSI tumors have to PA in this syndromic setting. A curious morphologic varia-tion within LGSI and some PA is the presence of tumors wherein the astrocytic cells feature plump, abundant cytoplasm, thick processes, and central nuclei with prominent nucleoli. Characterization of these phenotypic variations within NF1 is lacking in the literature.
Ultrastructural studies of NF1 related intracra-nial astrocytomas are few with exception of ones focusing upon optic nerve gliomas [2-5]. A www.ijcep.com/IJCEP1012004
Original Article
Phenotypic variations in NF1-associated low grade
astrocy-tomas: possible role for increased mTOR activation in a
subset
Mark Jentoft1, Caterina Giannini1, Ling Cen2, Bernd W. Scheithauer1, Bridget Hoesley3, Jann N. Sarkaria2, Patrice C. Abell-Aleff4, Erika F. Rodriguez1, Ying Li5, Fausto J. Rodriguez1,6
1Departments of Laboratory Medicine and Pathology, 2Radiation Oncology, 3Advanced Genomics Technology Center, 4Biochemistry and Molecular Biology, 5Biomedical Statistics and Informatics, Mayo Clinic, Rochester, MN, USA; 6
De-partment of Pathology, Johns Hopkins University, Baltimore, MD, USA.
Received December 7, 2010; accepted December 11, 2010; Epub December 12, 2010; published January 1, 2011
Abstract: Low grade astrocytomas are the most common CNS tumors in neurofibromatosis type 1(NF1) patients. While most are classic pilocytic astrocytomas (PA), some are difficult to classify, and have been termed “low grade astrocytoma subtype indeterminate” (LGSI). Some of these tumors exhibit peculiar morphologies, including plump cytoplasmic processes and macronucleoli. In the current study we performed electron microscopy, followed by gene expression, immunohistochemical and western blot analyses in an effort to identify biological differences underlying phenotypic variation in NF1-associated low grade astrocytoma. Electron microscopy demonstrated intermediate fila-ments and frequent Rosenthal fiber material in both PA and LGSI. Dense core granules and/or aligned microtubules were present in the LGSI group (2 of 3 cases) and in the PA group (1 of 10 cases). Analysis of global gene expression data obtained using Affymetrix HG-U133 Plus2.0 chips (5 PA, 1 LGSI), and western blot analysis for phospho-S6 (1 LGSI, 2 PA) demonstrated a gene expression profile reflecting “neuronal differentiation” and increased phospho-S6 immunoreactivity consistent with mTOR activation in the LGSI compared with PA. These findings were confirmed by immunohistochemistry for neuronal markers, as well as combined phospho-S6/ phospho-p70S6K immunoreactivity in 4 (of 4) LGSI vs. 5 (of 13) NF1-associated PA (p=0.02), and 13 (of 39) sporadic PA. Phospho-ERK immunoreactivity was uniformly present in PA and LGSI groups, while BRAF duplication was absent by FISH in 8 NF1-associated low grade astrocytomas. In summary, differential expression of neuronal-related genes and increased mTOR activation may underlie phenotypic variations in NF1-associated low grade astrocytomas.
44 Int J Clin Exp Pathol 2011;4(1):43-57 recent, detailed study of optic gliomas arising in
a mouse model of NF1 (Nf1+/-GFAPCKO) demon-strated axonal irregularities and glial disorgani-zation at the ultrastructural level associated with retinal ganglion cell loss [6]. Ultrastructur-ally, conventional PA are characterized by con-spicuous intermediate filaments within their piloid cell element, electrondense Rosenthal fiber material, amorphous spheres (hyaline droplets), and accumulation of large cytoplas-mic lysosomes (granular bodies) [2, 7]. Ultra-structural properties of the full spectrum of NF1 -associated low grade astrocytomas are not well characterized to our knowledge.
NF1 deficient astrocytes exhibit increased levels of the mammalian target of rapamycin (mTOR) activation, resulting in ribosomal S6 activation in both NF1 mutant murine optic gliomas and NF1 associated pilocytic astrocytomas in hu-mans [8]. mTOR is a nutrient-sensor control protein that signals several translational factors in response to nutrient availability. Additionally, mTOR regulates the rate at which the transla-tional machinery is synthesized, both at the level of transcription and translation as well as serving several other known cellular functions [9]. Activation of mTOR leads to phosphoryla-tion of S6 kinase and activaphosphoryla-tion of ribosomal S6 [8], with identification of phosphorylated S6 kinase or ribosomal S6 serving as surrogates of mTOR activation.
The purpose of this study was to explore pheno-typic differences between different subsets of NF1-associated low grade astrocytomas, and understand what molecular differences underlie them. Since some NF1-associated LGSI tumors are morphologically reminiscent of subependy-mal giant cell astrocytoma (SEGA), a tumor typi-cal of tuberous sclerosis, the molecular hall-mark of which is mTOR activation through muta-tions of the TSC1 and TSC2 genes [10], we hy-pothesized that differential mTOR activation may underlie the phenotypic variation of other low grade astrocytomas in NF1.
Materials and methods
Patients and tumor samples
Detailed clinicopathologic features of these tu-mors were reported in a prior study [1]. The cur-rent study included 22 cases of NF1-associated low grade astrocytomas (16 PA, 6 LGSI, 1 WHO
grade II diffuse astrocytoma). A single gan-glioglioma was also included. Six of the NF1-associated PA, as well as 39 sporadic PA, present on a tissue microarray were also used for phospho-specific antibody immunohisto-chemistry. All studies were approved by the In-stitutional Review Board and Biospecimen com-mittee at Mayo Clinic.
Electron microscopy
Fifteen cases with available glutaraldehyde-fixed and Epon embedded material were stud-ied. The sections were stained with uranyl ace-tate and lead citrate and examined on a Tecnai 12 model transmission electron microscope (FEI Corp., Eindhoven, Netherlands). All tumors were examined for the presence of intermediate filaments, Rosenthal fibers, microtubules, dense core granules, cytoplasmic organelles, and macronucleoli by three neuropathologists (CG, FJR BWS).
Gene expression analysis
RNA gene expression data were analyzed from 6 NF1-associated low grade astrocytomas ob-tained from a prior single hybridization experi-ment [11] using Affymetrix HG-U133 Plus 2.0 chips. Upon review of all histologic slides, one tumor had the morphologic features described above (i.e. abundant cytoplasm, prominent nu-cleoli, scant to absent eosinophilic granular bodies and Rosenthal fibers) and was classified as LGSI. In brief, a standard in-house MicroArray PreProcessing (MAPP) workflow was used to preprocess the data, including BG Correction, normalization and PM correction. Gene expres-sion differences were expressed in the form of fold changes between 1 LGSI and the 5 PA.
Immunohistochemistry
45 Int J Clin Exp Pathol 2011;4(1):43-57 polyclonal(Erk1/2) (Thr202/Tyr204; 1:250 cell
signaling technology), phospho-p70S6K (Phospho-p70 S6 Kinase) (Rabbit polyclonal recognizing phospho-Thr389; 1:25; cell signal-ing technology), phospho-S6 (Rabbit polyclonal
p-S6 (Ser235/236) 1:200, cell signaling tech-nology), and Ki–67 (clone MIB-1, monoclonal, 1:300; Dako). Stains were scored according to a four tiered semiquantitative scale by two ob-servers as previously described [11]. MIB-1
[image:3.612.95.520.83.537.2]46 Int J Clin Exp Pathol 2011;4(1):43-57
67) labeling indices were evaluated using the CAS200 imaging system (Bacus Laboratories, Lombard, Ill) and by examining 20 consecutive high magnification fields.
Western Blot
Total proteins were isolated from patient frozen tissues and separated by 10% SDS-polyacrylamide gel and transferred onto a PVDF membrane. The membrane was blotted over-night at 4 ºC with 1:1000 dilution of primary antibody. Antibodies used were specific for phospho-S6 (Ser235/236), total S6, and β-actin (all from Cell Signaling Technology). Next, the blot was incubated with 1:5000 dilution of sec-ondary anti-rabbit antibody conjugated with horseradish peroxidase (Pierce). Detection was performed with the Super Signal Chemilumines-cence reagent according to the manufacturer’s protocol (Pierce). Relative quantification of pro-tein levels from western blot bands was done using ImageJ software from the National Insti-tutes of Health (http://rsb.info.nih.gov/ij/ index.html).
BRAF fluorescence in situ hybridization (FISH)
FISH studies to evaluate for BRAF duplication, a molecular finding characteristic of the majority of sporadic PA, was performed using a custom made probe (clones RP4-592P3, RP4-726N20, RP5-839B19, RP4-813F11), targeting 7q34). The probe was labeled with SpectrumOrangetm (Abbott Molecular/Vysis,Des Plaines, Ill), and a CEP7 control probe was labeled with Spectrum-Greentm. A total of 100 nuclei were evaluated per case. Target to control probe ratios>1.2 were considered indicative of duplication.
Results
Ultrastructural features of NF1-associated low grade astrocytomas
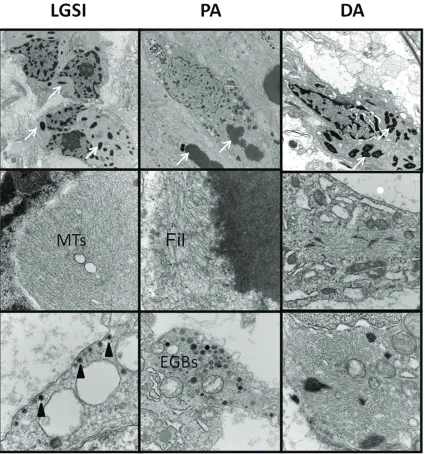
The 14 NF1 associated astrocytomas included 10 PA, 3 LGSI and 1 DA. One NF1 associated GG was also examined. Patients included 6 fe-males and 9 fe-males; mean age at time of sur-gery was 20 years (range 2-44). Ultrastructural findings are summarized in Table 1 and illus-trated in Figure 1. Aligned, often compacted, intermediate filaments typical of astrocytic neo-plasms were identified in all tumors, including glial cells of the single GG. Dense core granules
were present in the GG and 3(of 3) LGSI. Gran-ules ranged from 100-130 nm in diameter, fea-tured cores of uniform electron density, a sur-rounding halo, and a sharply delimited mem-brane. Rosenthal fibers were identified in 4 (of 10) PA. Interestingly, Rosenthal fibers, not evi-dent at the light microscopic level, were seen ultrastructurally in the single diffuse astrocy-toma and in 2(of 3) LGSI. Aligned microtubules were identified in 2 (of 3) LGSI. Macronucleoli were identified in 4 (of 10) PA, the single GG, and 2 (of 3) LGSI. Eosinophilic granular bodies were identified in 2 (of 10) PA, the single GG, and in 2 (of 3) LGSI.
A subset of NF1-associated low grade astrocy-tomas are characterized by unique cytology
In a prior study we described a subset of low grade NF1-associated astrocytomas that
[image:4.612.322.532.85.296.2]47 Int J Clin Exp Pathol 2011;4(1):43-57 onstrated some morphologic features of PA, but
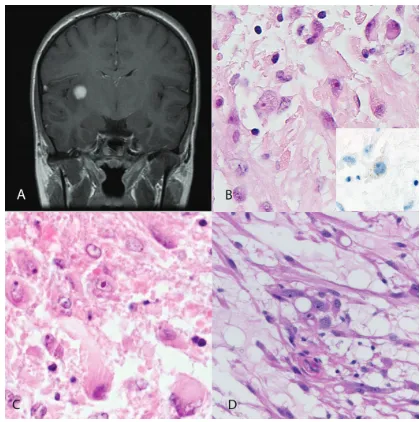
in addition had unique cytology [1]. Clinicopa-thologic features of the tumors evaluated in the current study are summarized in Table 2. In summary, these tumors had some features reminiscent of PA, including relative circum-scription, hyalinized/glomeruloid vasculature, a loose texture, and bipolar processes in a subset of cells. However, they were characterized cy-tologically by abundant eosinophilic cytoplasm and prominent nucleoli (Figure 2). Rosenthal fibers were absent, as well as eosinophilic granular bodies except for one case. In addition, they were predominantly supratentorial (5 of 6 cases), and mostly situated in the cerebral hemispheres (4 of 6 cases), unlike NF1-associated PA, of which 5 (of 10) involved the optic pathways or brainstem (Table 1).
A subset of NF1-associated low grade astrocy-tomas show a partial neuronal phenotype
We compared changes in global mRNA gene expression between 1 LGSI with the cytologic traits described above and 5 PA. A total of 9035
transcripts were differentially expressed be-tween the LGSI and the PAs. The top overex-pressed genes in the LGSI were enriched for neuronal specific genes, including ones encod-ing proteins associated with synapses, micro-tubules, secretory granules and neurotransmit-ters (Table 3). Of note the top 3 genes with in-creased expression were GABA A receptor, syn-aptotagmin 1, and neurogranin which are all neuronal associated[12-15]. They were in-creased 85, 62, and 49 fold respectively in the LGSI as compared to the PA group. There were several underexpressed transcripts, including a variety of genes encoding extracellular matrix related proteins (e.g. collagens) among others.
Next, we performed immunohistochemistry us-ing commercially available antibodies for rou-tine diagnostic use. Both PA and LGSI demon-strated strong expression of glial markers, in-cluding GFAP and S100 protein. In addition, LGSI showed more frequent expression of neu-ronal-associated markers compared to PA, in-cluding synaptophysin (2 of 4 vs. 2 of 6, tively), chromogranin A (1 of 4 vs. 0 of 5,
[image:5.612.81.396.82.400.2]48 Int J Clin Exp Pathol 2011;4(1):43-57 Table 1. Ultrastructural features of NF1-associated low grade astrocytomas
Case Histology Sex Age Location Rosenthal Fibers Microtubules Intermediate Filaments Dense Core Granules Organelles Macro-nucleolus EGBs
1 PA F 25 Left lateral ventricle No No Yes No Mitochondria Yes No
2 PA M 16 Right parietal No No Yes No Mitochondria No No
3 PA M 3 Left optic nerve Yes No Yes No Scant Mitochondria No No
4 PA F 21 Temporoparietal lobe Yes No Yes No Lysosomes No Yes
5 PA M 2 Left optic nerve No No Yes No Lysosomes No Yes
6 PA M 44 Right thalamus and optic No Yes Yes No Scant No No
7 PA F 24 Cervicomedullary junction Yes No Yes No Mitochondria Yes No
8 PA M 37 brain stem Yes No Yes No Lysosomes Yes No
9 PA M 10 Right cerebellum No No Yes No Lysosomes and Mitochondria No No
10 PA M 17 Left frontal lobe No No Yes No Scant Mitochondria Yes No
11 LGSI M 13 Right temporooccipital Yes Yes Yes Yes Mitochondria Yes Yes
12 LGSI F 14 Right subinsular region No No Yes Yes Lysosomes and
Mitochondria Yes Yes
13 LGSI F 9 Posterior Fossa Yes Yes Yes Yes Lysosomes and No No
14 DA F 31 Pons Yes No Yes No Mitochondria No No
15 GG
M 34 Hypothalmus/3rd ventricle No No Yes Yes Lysosomes and Mitochondria Yes Yes
49 Int J Clin Exp Pathol 2011;4(1):43-57 Table 2. Clinicopathologic features of NF1-associated low grade astrocytomas with plump cytoplasm and prominent nucleoli
Age/sex Location Imaging surgery Granular bodies Rosenthal fibers Mitotic count/
10 hpf Necrosis Vascular changes Treatment Follow-up
46/F R temporal lobe
Angiogram: large rather avascular mass. Evidence of
uncal herniation STR absent absent 1 absent Glomeruloid and hyalinized vessels Radiation
Postoperative course complicated by large subgaleal effusion and meningitis, became apneic; probable uncal herniation, expired
64/F R temporal lobe
CT: enhancing, slightly hyperdense, minimal edema
or mass effect Stereotactic biopsy present absent 4 absent Glomeruloid and hyalinized vessels NA
Further tx recommended but patient discharged. Died of pneumonia 4 months after surgery
14/F R insula
MRI: 1.2 cm well circumscribed
homegeneouly enhancing lesion, surrounding edema,
multiple UBO's GTR absent absent 0 absent Glomeruloid vessels Observation NED 3 years postop
13/M
R temporo-occipital lobe
MRI: 1.5 cm homogeneously enhancing, suggestion that might be arising from the
tentorium GTR absent absent 0 absent
Glomeruloid vessels and
hyalinized vessels Observation NED 40 months postop
9/F Cerebellum
Well circumscribed inhomogeneously enhancing tumor "most likely extra-axial within the precentral
cerebellar sulcus" Biopsy only absent absent 0 absent Hyalinized vessels Observation Stable serial imaging, with follow-up 16 years
4/M 3rd Ventricle
MRI: 1.3 x 1.2 x 0.7 cm, non-enhancing mass involving the posterior
aspect of the 3rd ventricle GTR absent absent 1 absent absent Observation Recurrence at 31 months; 2nd GTR performed
50 Int J Clin Exp Pathol 2011;4(1):43-57 Table 3. Gene expression analysis of NF1-associated LGSI (n=1) and PA (n=5). Genes expressed > 7 fold in LGSI compared to the PA group
Probe UniGene ID Gene Title Gene Symbol Fold change LGSI/PA
207014_at Hs.116250 gamma-aminobutyric acid (GABA) A receptor, alpha 2 GABRA2 85
203999_at Hs.310545 synaptotagmin I SYT1 62
204081_at Hs.524116 neurogranin (protein kinase C substrate, RC3) NRGN 49
206172_at Hs.336046 interleukin 13 receptor, alpha 2 IL13RA2 47
204229_at Hs.375616 solute carrier family 17, member 7 SLC17A7 45
229039_at Hs.445503 synapsin II SYN2 43
203649_s_at Hs.466804 phospholipase A2, group IIA PLA2G2A 43
202018_s_at Hs.529517 lactotransferrin LTF 39
228245_s_at Hs.524331 ovostatin /// ovostatin 2 OVOS /// OVOS2 33
227053_at Hs.520087 protein kinase C and casein kinase substrate in neurons 1 PACSIN1 30
204230_s_at Hs.375616 solute carrier family 17, member 7 SLC17A7 26
210040_at Hs.21413 solute carrier family 12, member 5 SLC12A5 24
1553605_a_at Hs.226568 ATP-binding cassette, sub-family A (ABC1), member 13 ABCA13 24
205489_at Hs.924 crystallin, mu CRYM 23
204714_s_at Hs.30054 coagulation factor V (proaccelerin, labile factor) F5 23
204260_at Hs.516874 chromogranin B (secretogranin 1) CHGB 23
206280_at Hs.317632 cadherin 18, type 2 CDH18 22
203797_at Hs.444212 visinin-like 1 VSNL1 20
209160_at Hs.78183 aldo-keto reductase family 1, member C3 AKR1C3 18
212473_s_at Hs.501928 microtubule associated monoxygenase, calponin and LIM domain containing 2 MICAL2 18
203998_s_at Hs.310545 synaptotagmin I SYT1 18
224795_x_at Hs.703932 immunoglobulin kappa locus IGK@ /// IGKC 17
205499_at Hs.306339 sushi-repeat-containing protein, X-linked 2 SRPX2 17
211430_s_at Hs.700112 immunoglobulin heavy locus
IGH@ /// IGHG1 /// IGHG2 /// IGHM /// IGHV4-31 ///
LOC100294459 16
201340_s_at Hs.104925 ectodermal-neural cortex (with BTB-like domain) ENC1 15
1565162_s_at Hs.389700 microsomal glutathione S-transferase 1 MGST1 15
201843_s_at Hs.76224 EGF-containing fibulin-like extracellular matrix protein 1 EFEMP1 15
228302_x_at Hs.197922 calcium/calmodulin-dependent protein kinase II inhibitor 1 CAMK2N1 14
51 Int J Clin Exp Pathol 2011;4(1):43-57
226086_at Hs.436643 synaptotagmin XIII SYT13 14
202508_s_at Hs.167317 synaptosomal-associated protein, 25kDa SNAP25 13
242344_at Hs.303527 gamma-aminobutyric acid (GABA) A receptor, beta 2 GABRB2 13
224209_s_at Hs.494163 guanine deaminase GDA 13
1552714_at Hs.30917 cellular repressor of E1A-stimulated genes 2 CREG2 13
201341_at Hs.104925 ectodermal-neural cortex (with BTB-like domain) ENC1 13
202628_s_at Hs.414795 serpin peptidase inhibitor, clade E, member 1 SERPINE1 13
221671_x_at Hs.703932 immunoglobulin kappa locus IGK@ /// IGKC 13
1555229_a_at Hs.458355 complement component 1, s subcomponent C1S 13
223316_at Hs.498720 coiled-coil domain containing 3 CCDC3 12
213332_at Hs.187284 pappalysin 2 PAPPA2 12
221651_x_at Hs.703932 immunoglobulin kappa locus IGK@ /// IGKC 12
203705_s_at Hs.173859 frizzled homolog 7 (Drosophila) FZD7 12
225815_at Hs.193235 complexin 2 CPLX2 12
238426_at Hs.270753 transmembrane protein 130 TMEM130 12
223500_at Hs.478930 complexin 1 CPLX1 11
206552_s_at Hs.2563 tachykinin, precursor 1 TAC1 11
202733_at Hs.519568 prolyl 4-hydroxylase, alpha polypeptide II P4HA2 11
204563_at Hs.82848 selectin L SELL 11
202437_s_at Hs.154654 cytochrome P450, family 1, subfamily B, polypeptide 1 CYP1B1 11
205525_at Hs.490203 caldesmon 1 CALD1 10
226931_at Hs.401954 transmembrane and tetratricopeptide repeat containing 1 TMTC1 10
214432_at Hs.515427 ATPase, Na+/K+ transporting, alpha 3 polypeptide ATP1A3 10
1553604_at Hs.226568 ATP-binding cassette, sub-family A (ABC1), member 13 ABCA13 10
205591_at Hs.522484 olfactomedin 1 OLFM1 9
202435_s_at Hs.154654 cytochrome P450, family 1, subfamily B, polypeptide 1 CYP1B1 9
229461_x_at Hs.146542 neuronal growth regulator 1 NEGR1 9
230262_at Hs.23172 ST8 alpha-N-acetyl-neuraminide alpha-2,8-sialyltransferase 3 ST8SIA3 9
241763_s_at Hs.403933 F-box protein 32 FBXO32 9
203706_s_at Hs.173859 frizzled homolog 7 (Drosophila) FZD7 9
231736_x_at Hs.389700 microsomal glutathione S-transferase 1 MGST1 9
210016_at Hs.434418 myelin transcription factor 1-like MYT1L 9
224918_x_at Hs.389700 microsomal glutathione S-transferase 1 MGST1 9
52 Int J Clin Exp Pathol 2011;4(1):43-57
211126_s_at Hs.530904 cysteine and glycine-rich protein 2 CSRP2 8
208051_s_at Hs.482038 poly(A) binding protein interacting protein 1 PAIP1 8
204463_s_at Hs.183713 endothelin receptor type A EDNRA 8
1557122_s_at Hs.303527 gamma-aminobutyric acid (GABA) A receptor, beta 2 GABRB2 8
223654_s_at Hs.435976 bruno-like 4, RNA binding protein (Drosophila) BRUNOL4 8
201842_s_at Hs.76224 EGF-containing fibulin-like extracellular matrix protein 1 EFEMP1 8
230303_at Hs.648668 synaptoporin SYNPR 8
203798_s_at Hs.444212 visinin-like 1 VSNL1 8
206190_at Hs.46453 G protein-coupled receptor 17 GPR17 8
204723_at Hs.4865 sodium channel, voltage-gated, type III, beta SCN3B 8
204339_s_at Hs.386726 regulator of G-protein signaling 4 RGS4 8
229331_at Hs.527090 spermatogenesis associated 18 homolog (rat) SPATA18 7
203305_at Hs.335513 coagulation factor XIII, A1 polypeptide F13A1 7
214920_at Hs.648482 thrombospondin, type I, domain containing 7A THSD7A 7
207030_s_at Hs.530904 cysteine and glycine-rich protein 2 CSRP2 7
212792_at Hs.408623 dpy-19-like 1 (C. elegans) DPY19L1 7
205110_s_at Hs.6540 fibroblast growth factor 13 FGF13 7
235066_at Hs.517949 microtubule-associated protein 4 MAP4 7
204684_at Hs.702002 neuronal pentraxin I NPTX1 7
201616_s_at Hs.490203 caldesmon 1 CALD1 7
218084_x_at Hs.333418 FXYD domain containing ion transport regulator 5 FXYD5 7
205876_at Hs.133421 leukemia inhibitory factor receptor alpha LIFR 7
204337_at Hs.386726 regulator of G-protein signaling 4 RGS4 7
213131_at Hs.522484 olfactomedin 1 OLFM1 7
204722_at Hs.4865 sodium channel, voltage-gated, type III, beta SCN3B 7
220131_at Hs.134729 FXYD domain containing ion transport regulator 7 FXYD7 7
221914_at Hs.225936 synapsin I SYN1 7
201266_at Hs.708065 thioredoxin reductase 1 TXNRD1 7
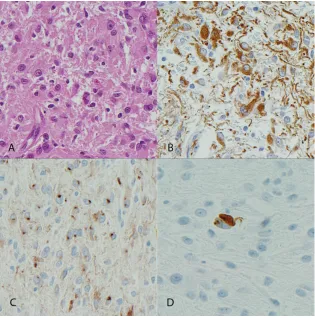
53 Int J Clin Exp Pathol 2011;4(1):43-57 tively), and neurofilament protein (2 of 4 vs. 0 of
4, respectively) (Figure 3 and Table 4). The two LGSI expressing neurofilament protein in tumor cells also expressed synaptophysin. In the 2 PA expressing synaptophysin, it was limited to rare cells. The GG showed strong expression of syn-aptophysin and chromogranin in the neuronal component. Partial infiltration of underlying brain parenchyma was noted in 5 (of 6) PA and 3 (of 4) LGSI. These findings support a predomi-nantly glial and partial neuronal phenotype for NF1-associated LGSI compared with PA.
A subset of NF1-associated low grade astrocy-tomas demonstrate increased mTOR pathway activation
Given the increased cytoplasmic size and the presence of macronucleoli in the LGSI group, we hypothesized that increased mTOR signaling may partially explain this phenotype. We per-formed western blot analysis using an antibody recognizing phospho-S6, a marker reflecting mTOR activation. Increased levels of phospho-S6 were present in 3 NF1-associated low grade astrocytomas (1 LGSI and 2 PA) compared to cerebral cortex and cerebellum, levels being highest in the LGSI, when adjusting for beta actin or total S6 (Figure 4).
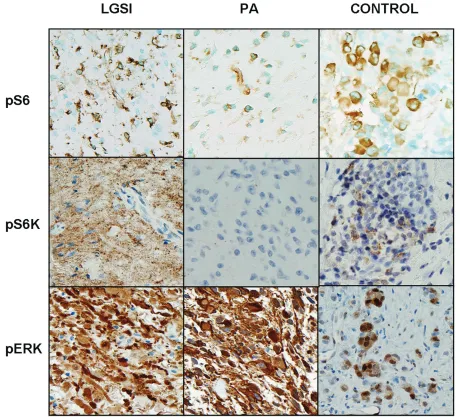
Next we performed immunohistochemistry us-ing antibodies recognizus-ing phospho-S6 and phospho-p70S6K in formalin-fixed paraffin-embedded tissue. Immunopositivity for both was noted in 7 (of 12) and 5 (of 13) PA and 4 (of 4) of LGSI each respectively (Figure 5). Com-bined immunoreactivity for phospho-S6 and phospho-p70S6K was noted in 5(of 13) of PA and 4 (of 4) LGSI, the difference being statisti-cally significant (p=0.02) (Fisher exact test). To assess the status of mTOR activation in addi-tional non-NF1 associated tumors, we also
per-formed immunohistochemistry using two tissue microarrays including sporadic tumors. Com-bined immunopositivity for phospho-S6 and phospho-p70S6K was demonstrated in 13 (of 39)(33%) sporadic PA.
[image:11.612.326.530.86.343.2]In contrast there were no differences with re-spect to phospho-ERK immunoreactivity, which was uniformly expressed in all NF1-associated PA and LGSI, or in MIB1 labeling (mean MIB1 3.2 and 5 respectively, p=0.2). BRAF duplica-tion was absent in 8 NF1-associated low grade astrocytomas, including 7 PA and 1 LGSI. When reviewing gene expression data focusing on mTOR target genes, the results were variable and difficult to interpret, with some genes show-ing increased expression and some decreased expression in the single LGSI compared to the NF1-associated PA. Genes overexpressed 2-3 fold in the LGSI included those encoding for
Figure 4. Increased phospho-S6 levels are a feature of low grade astrocytomas subtype indeterminate (LGSI). One case of LGSI tested showed a strong band when using an anti phospho-S6 antibody (A). When quantifying relative band intensity using Im-ageJ software, there was 12-40% increased levels in the LGSI compared to two NF1-associated PA. Levels were adjusted for total S6 to control for gel loading. Cbll=cerebellum, GBM=Glioblastoma sample control, cortex=non-neoplastic cerebral cortex.
Table 4. Summary of immunohistochemical analysis for glial and neuronal markers in LGSI and PA
N LGSI
n=4 PA n=6
GFAP 4 (of 4) 6 (0f 6)
S100 4 (of 4) ND
Synaptophysin 2 (of 4) 2 (of 6)
Chromogranin 1 (of 4) 0 (of 5)
[image:11.612.82.288.122.204.2]54 Int J Clin Exp Pathol 2011;4(1):43-57 eukaryotic translation initiation factor 4E,
eu-karyotic translation initiation factor 3, subunit B, and RHEB. These findings suggest that in-creased mTOR signaling, but not MAPK/ERK activation or proliferation, may underlie the phe-notypic variations noted in NF1-associated low grade astrocytomas.
Discussion
NF1 associated low grade astrocytomas are predominantly pilocytic in type. Prior studies
[image:12.612.76.536.81.499.2]have indicated that a subset of low grade astro-cytomas are difficult to classify, but offer no explanation of phenotypic variations in terms of possible underlying molecular mechanisms. As would be expected, the most conspicuous ultra-structural finding within all tumors in this study was the presence of numerous intermediate filaments, typical of astrocytic neoplasms. In our study, the majority of tumors available for ultra-structural review were PA. Most demonstrated typical features one would expect, such as Rosenthal fibers and intermediate filaments. In
55 Int J Clin Exp Pathol 2011;4(1):43-57 the GG intermediate filaments were present
only within phenotypically glial cells. As ex-pected, dense core granules were abundantly present in the GG, but were also sparsely repre-sented in all three LGSI examined. Rosenthal fibers not appreciated on light microscopy were present ultrastructurally in LGSI as well as the single diffuse astrocytoma, thus suggesting morphologic similarities, at least at the ultra-structural level, among all low grade astrocy-tomas in NF1. Instead, the presence of ultra-structural features usually associated with a neuronal phenotype, including aligned micro-tubules and dense core granules, was typical, albeit an unexpected feature, of LGSI. These findings within low grade astrocytomas may represent phenotypic divergent differentiation in the setting of NF1.
A partial neuronal phenotype was also demon-strated by gene expression analysis (in a single tumor) and by increased expression of neuronal markers at the protein level. However, the pre-dominant line of differentiation of these tumors remains glial, as reflected by strong consistent GFAP immunoreactivity and intermediate fila-ment accumulation in all tumors. Classic neu-ronal and glioneuneu-ronal tumors have also been described in the setting of NF1, including gan-gliogliomas [1, 16], DNET like lesions [16] and even desmoplastic infantile gangliogliomas [1]. Unlike these lesions, our LGSI subset exhibits a predominant glial phenotype with only partial divergent neuronal differentiation, as described in other astrocytomas, including subependymal giant cell astrocytoma and pleomorphic xan-thoastrocytoma [17, 18].
The morphology of this low grade astrocytoma subset is somewhat reminiscent of another syn-drome-associated tumor, i.e. subependymal giant cell astrocytoma. The features include nucleolar prominence, abundance of cytoplasm, expression of neuronal markers, and favorable prognosis [18]. Subependymal giant cell astro-cytoma is nearly restricted to patients with tu-berous sclerosis, a syndrome arising as a conse-quence of TSC1 or TSC2 germline mutations. The molecular consequence is activation of the mTOR pathway [10]. mTOR activation may also be an important biological event in epilepsy as-sociated glioneuronal tumors [19].
Increased mTOR activation has been shown to occur in NF1 deficient astrocytes and in 4 of 6
NF1-associated PA in a prior study [8]. Curi-ously, in our group of NF1-associated low grade astrocytomas mTOR activation, as reflected by phospho-S6 and phospho-p70S6K levels, was frequent, but seemed to be higher in the low grade astrocytomas with peculiar cytologic fea-tures. Phospho-S6 levels are increased as a result of activation of mTOR which leads to phosphorylation of p70S6 kinase and thus acti-vation of ribosomal S6, which leads to in-creased protein synthesis. The result may be increased cell size. These findings support the notion that some low grade astrocytomas rep-resent a distinct morphologic subset of NF1-associated tumors. Although no obvious clinical differences are noted with respect to NF1-associated PA, our findings could be clinically relevant since the mTOR pathway may be phar-macologically targeted for therapeutic benefit [20].
MAPK/ERK activation, as demonstrated by phospho-ERK immunoreactivity, was uniform in all tumors studied. This is expected, given that NF1 loss results in persistent activated RAS and downstream signaling through the MAPK/ERK pathway[8]. BRAF rearrangements and muta-tions represent an alternative mechanism of MAPK/ERK activation in sporadic PA [21]. It is of interest that prior studies have found BRAF alterations to be absent in NF1-associated as-trocytomas [22, 23], including 7 PA and 1 LGSI used in the current study. Therefore, BRAF test-ing is not useful in disttest-inguishtest-ing these sub-types of low grade astrocytoma in the setting of NF1.
One caveat is that not all LGSI demonstrate this unique morphology, and some may in fact repre-sent other, inadequately sampled histologies, such as PA [1]. Indeed, the possibility of under-sampling resulting in an erroneous diagnosis is a consideration whenever tumors with overlap-ping morphologic and ultrastructural features are encountered.
56 Int J Clin Exp Pathol 2011;4(1):43-57 associated astrocytoma. Furthermore,
in-creased mTOR activation may be responsible for larger cell size despite similar proliferative indices and clinical behavior. Our findings, per-haps underlying the unconventional morphology of these tumors, require further studies to shed light upon the biology and molecular mecha-nisms underlying NF1-associated glial tumori-genesis.
Acknowledgments
The authors thank the microarray, cytogenetics, tissue and cell molecular analysis of the Mayo Clinic for excellent technical assistance.
This work was funded in part by grant P50 CA108961 from the Mayo SPORE in Brain Can-cer (CG, FJR, JNS) and Mayo Clinic CTSA (FJR) through grant number UL1 RR024150 from the National Center for Research Resources (NCRR), a component of the National Institutes of Health (NIH).
Please address correspondence to: Fausto J. Rodri-guez MD, Department of Pathology, Division of Neuro-pathology, Johns Hopkins University, 720 Rutland Avenue - Ross Building - 512B, Baltimore, Maryland 21205, USA. Tel: 443-287-6646; Fax: 410-955-9777, E-mail: [email protected]
References
[1] Rodriguez FJ, Perry A, Gutmann DH, O'Neill BP, Leonard J, Bryant S, Giannini C. Gliomas in neu-rofibromatosis type 1: a clinicopathologic study of 100 patients. J Neuropathol Exp Neurol 2008; 67: 240-249.
[2] Liberski PP, Kordek R. Ultrastructural pathology of glial brain tumors revisited: a review. Ultra-struct Pathol 1997; 21: 1-31.
[3] Luse SA. An electron microscopic study of nor-mal optic nerve and of an optic-nerve glioma. J Neurosurg 1961; 18: 466-478.
[4] Soejima T, Kitamura K, Tomonaga M. [Electron microscopic observation of optic glioma--with special reference to the desmoplastic reaction (author's transl)]. No Shinkei Geka 1974; 2: 689 -697.
[5] Stern J, Jakobiec FA, Housepian EM. The archi-tecture of optic nerve gliomas with and without neurofibromatosis. Arch Ophthalmol 1980; 98: 505-511.
[6] Kim KY, Ju WK, Hegedus B, Gutmann DH, Ellis-man MH. Ultrastructural characterization of the optic pathway in a mouse model of neurofibro-matosis-1 optic glioma. Neuroscience 170: 178-188.
[7] Scheithauer BW, Bruner JM. The ultrastructural
spectrum of astrocytic neoplasms. Ultrastruct Pathol 1987; 11: 535-581.
[8] Dasgupta B, Yi Y, Chen DY, Weber JD, Gutmann DH. Proteomic analysis reveals hyperactivation of the mammalian target of rapamycin pathway in neurofibromatosis 1-associated human and mouse brain tumors. Cancer Res 2005; 65: 2755-2760.
[9] Gingras AC, Raught B, Sonenberg N. Control of translation by the target of rapamycin proteins. Prog Mol Subcell Biol 2001; 27: 143-174. [10] Chan JA, Zhang H, Roberts PS, Jozwiak S,
Wi-eslawa G, Lewin-Kowalik J, Kotulska K, Kwiat-kowski DJ. Pathogenesis of tuberous sclerosis subependymal giant cell astrocytomas: biallelic inactivation of TSC1 or TSC2 leads to mTOR activation. J Neuropathol Exp Neurol 2004; 63: 1236-1242.
[11] Rodriguez FJ, Giannini C, Asmann YW, Sharma MK, Perry A, Tibbetts KM, Jenkins RB, Scheithauer BW, Anant S, Jenkins S, Eberhart CG, Sarkaria JN, Gutmann DH. Gene expression profiling of NF-1-associated and sporadic pilo-cytic astrocytoma identifies aldehyde dehydro-genase 1 family member L1 (ALDH1L1) as an underexpressed candidate biomarker in aggres-sive subtypes. J Neuropathol Exp Neurol 2008; 67: 1194-1204.
[12] Enna SJ, McCarson KE. The role of GABA in the mediation and perception of pain. Adv Pharma-col 2006; 54: 1-27.
[13] Mikoshiba K, Fukuda M, Ibata K, Kabayama H, Mizutani A. Role of synaptotagmin, a Ca2+ and inositol polyphosphate binding protein, in neuro-transmitter release and neurite outgrowth. Chem Phys Lipids 1999; 98: 59-67.
[14] Mirza NR, Munro G. The role of GABA(A) receptor subtypes as analgesic targets. Drug News Per-spect 23: 351-360.
[15] Zhong L, Cherry T, Bies CE, Florence MA, Gerges NZ. Neurogranin enhances synaptic strength through its interaction with calmodulin. Embo J 2009; 28: 3027-3039.
[16] Fedi M, Anne Mitchell L, Kalnins RM, Gutmann DH, Perry A, Newton M, Brodtmann A, Berkovic SF. Glioneuronal tumours in neurofibromatosis type 1: MRI-pathological study. J Clin Neurosci 2004; 11: 745-747.
[17] Giannini C, Scheithauer BW, Lopes MB, Hirose T, Kros JM, VandenBerg SR. Immunophenotype of pleomorphic xanthoastrocytoma. Am J Surg Pathol 2002; 26: 479-485.
[18] Lopes MB, Altermatt HJ, Scheithauer BW, Shep-herd CW, VandenBerg SR. Immunohistochemical characterization of subependymal giant cell as-trocytomas. Acta Neuropathol 1996; 91: 368-375.
57 Int J Clin Exp Pathol 2011;4(1):43-57
Sethuraman G, Dinopoulos A, Thomas G, Crone KR. Rapamycin causes regression of astrocy-tomas in tuberous sclerosis complex. Ann Neurol 2006; 59: 490-498.
[21] Jones DT, Kocialkowski S, Liu L, Pearson DM, Backlund LM, Ichimura K, Collins VP. Tandem duplication producing a novel oncogenic BRAF fusion gene defines the majority of pilocytic as-trocytomas. Cancer Res 2008; 68: 8673-8677. [22] Rodriguez EF, Scheithauer BW, Giannini C,
Rynerason A, Cen L, Hoesley B, Gilmer-Flynn H, Sarkaria JN, Jenkins S, Long J, Rodriguez FJ. PI3K/AKT Pathway Alterations are Associated With Clinically Aggressive and Histologically Anaplastic Subsets of Pilocytic Astrocytoma. Acta Neuropathol 2010.