Workplace connectivity : A study of its impact on
self-assessed productivity.
HAYNES, Barry Philip.
Available from Sheffield Hallam University Research Archive (SHURA) at:
http://shura.shu.ac.uk/19775/
This document is the author deposited version. You are advised to consult the
publisher's version if you wish to cite from it.
Published version
HAYNES, Barry Philip. (2005). Workplace connectivity : A study of its impact on
self-assessed productivity. Doctoral, Sheffield Hallam University (United Kingdom)..
Copyright and re-use policy
Adsetts Centre City Campus
Sheffield S1 1WB
101 807 122 9
Return to Learning Centre of issue
Fines are charged at 50p per hour
-7 JUL 2
1 8 JUN 2Q08
ProQuest Number: 10697077
All rights reserved
INFORMATION TO ALL USERS
The quality of this reproduction is dependent upon the quality of the copy submitted.
In the unlikely event that the author did not send a com plete manuscript and there are missing pages, these will be noted. Also, if material had to be removed,
a note will indicate the deletion.
uest
ProQuest 10697077
Published by ProQuest LLC(2017). Copyright of the Dissertation is held by the Author.
All rights reserved.
This work is protected against unauthorized copying under Title 17, United States C ode Microform Edition © ProQuest LLC.
ProQuest LLC.
789 East Eisenhower Parkway P.O. Box 1346
Workplace Connectivity: A study of its
impact on self-assessed productivity
Barry Philip Haynes
A thesis submitted in partial fulfilment of the requirements of
Sheffield Hallam University
for the degree of Doctor of Philosophy
Abstract
Previous researchers have had difficulty in defining what constitutes office productivity, especially in 'knowledge' environments rather than 'processing' environments. The main body of published research that attempts to address the link largely addresses the physical environment. It falls into two main categories, those of office layout and office comfort. It must be noted that much of the physical environment literature lacks any theoretical framework. This study developed a validated theoretical framework for the evaluation of office productivity, and included components to represent both the physical and the behavioural environment. It is proposed that by adopting such an approach, insights into the dynamic nature, or connectivity, of office environments can be established. The main objective of this thesis was to investigate the effects of the office environment on its occupant’s perceived productivity.
The study’s strength is that it is based on two sizable data sets. Whilst the data collected contain data about the physical characteristics of the office environment, it had in addition data pertaining to the behavioural environment. The categorical data collected provided a unique opportunity to undertake an analysis of office occupiers by work process type. One of the key contributions of this study was the development of the components of office productivity, which were: comfort, office layout, informal interaction points, environmental services, designated areas, interaction and distraction. The components were reduced to four in preparation for a more detailed statistical analysis. The four distinct components were comfort, office layout, interaction and distraction.
This study establishes that it is the behavioural environment that has the greatest impact on office productivity. It demonstrates that it is the dynamic elements of the office environment, interaction and distraction that are perceived as having the bigger positive and negative influences on self assessed productivity and explains the finding in a model in which knowledge creation and knowledge transfer, and ultimately productivity, are enabled through various forms of communication.
Table of contents
List of tables...5
List of figures...9
Acknowledgements...11
Author's declaration...12
1 Introduction...14
1.1 Overview...14
1.2 Background...14
1.3 Context and rationale...15
1.4 Research aims... 20
1.5 Research approach...21
1.6 Structure of the thesis...22
2 Literature review...25
2.1 Introduction... 25
2.2 Measurement of office productivity... .26
2.2.1 Historical context... 27
2.2.2 Defining office productivity... 30
2.2.3 Approaches to measuring office productivity...32
2.2.4 Cost reduction to human contribution... 40
2.2.5 Summary... 50
2.3 Physical Environment...51
2.3.1 Comfort... 51
2.3.2 Layout...65
2.3.3 Summary... 74
2.4 Behavioural Environment...74
2.4.1 Summary... 90
2.5 Conclusion... 91
3 Research methodology...93
3.2 Research philosophy...95
3.2.1 Ontological assumption... 97
3.2.2 Epistemology...100
3.2.3 Human interest...102
3.2.4 Methodology...103
3.3 Research Design...107
3.3.1 Theoretical framework... 108
3.3.2 Hypothesis development...110
3.3.3 Design of measurement instrument... 111
3.3.4 Sample selection...127
3.3.5 Questionnaire design... 131
3.3.6 Data collection...136
3.3.7 Analysis of data...137
3.4 Conclusion... 140
4 Model Development ...143
4.1 Introduction...143
4.2 Factor analysis... 145
4.2.1 Criticisms of factor analysis... 148
4.2.2 Factor Analysis: Decision process... 149
4.3 Stagel: Objectives of factor analysis... 152
4.3.1 Identifying structure through data summarization...152
4.3.2 Variable selection... 153
4.4 Stage 2: Designing for factor analysis... 154
4.4.1 Measurement issues...154
4.4.2 Sample size...155
4.5 Stage 3: Assumptions in Factor Analysis... 156
4.6 Stage 4: Deriving factors and assessing overall fit... 160
4.6.1 Factoring method...160
4.6.2 Criteria for the number of factors to extract... 166
4.7 Stage 5: Interpreting the factors... 183
4.7.1 Rotation of factors... 185
4.7.2 Criteria for the significance of factor loadings... 191
4.7.3 Interpreting a factor matrix... 193
4.7.4 Reliability of factors... 196
4.8 Stage 6: Validation of factor analysis...198
4.8.1 Split sample factor analysis...198
4.8.2 Transactional knowledge work...203
4.8.3 Concentrated study Work...207
4.8.4 Group process work... 209
4.8.5 Individual process work... 211
4.8.6 Summary split sample factor analysis...213
4.8.7 Private sector factor analysis...213
4.8.8 Summary private sector factor analysis...221
4.9 Stage 7: Scale Development...222
4.9.1 Initial analysis...228
4.10 Conclusion... 230
5 Discussion of Results... 233
5.1 Introduction...233
5.2 Exploratory work pattern data analysis...235
5.2.1 Introduction... 235
5.2.2 Individual process work...237
5.2.3 Group process work... 241
5.2.4 Concentrated study... 246
5.2.5 Transactional knowledge worker... 252
5.2.6 Summary... 257
5.3 Confirmatory work pattern data analysis...260
5.3.1 Introduction...260
5.3.3 Summary of work pattern demographics...263
5.3.4 Work pattern ANOVA...264
5.3.5 Summary of work pattern ANOVA... 277
5.4 Conclusion... 279
6 Conclusions...282
6.1 Introduction... 282
6.2 Principal findings and conclusions... 286
6.2.1 Evaluation of Office Productivity...286
6.2.2 Model development for office productivity...287
6.2.3 Comparison of office productivity components... 295
6.2.4 Work pattern analysis... 300
6.3 Contribution to knowledge...303
6.4 Limitations...304
6.5 Further research... 307
6.6 Reflections...309
References... 310
Appendices... 322
Appendix A: Executive summary of occcupeir.org report 1... 323
Appendix B: Questionnaire...328
Appendix C: Local authority covering letter...332
Appendix D: Correlation matrix for local authority data se t... 334
Appendix E: Anti-image correlation matrix for local authority data s e t... 335
Appendix F: Correlation matrix for private sector company data set... 336
Appendix G: Anti-image correlation matrix for private sector data...337
Appendix H: Frequency tables for combined data set...338
List of tables
Table 1:1 A 5 % saving in real estate costs increases gross profit by 9% ...17
Table 1:2 A 5 % increase in productivity increases profit by 50% ...17
Table 2:1 Proposed measures of productivity from ASHRAE workshop on “Indoor Quality" (1992)...37
Table 2:2 Factors that affect productivity (Clements-Croome, 2000, p11)... 42
Table 2:3 Survey questions (Leaman ,1995)... 52
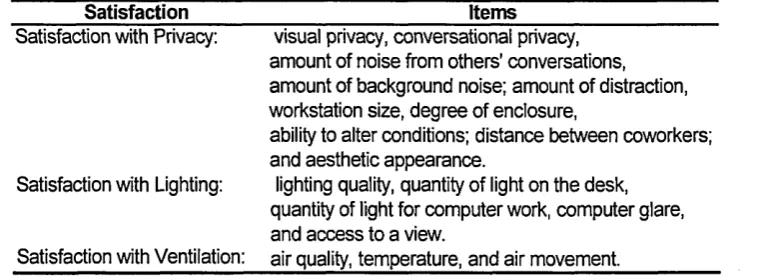
Table 2:4 Components of environmental satisfaction (Oseland, 1999)...53
Table 2:5 Elements of environmental conditions (Oseland, 1999)... 54
Table 2:6 Satisfaction with environment: A three - factor model ( Adapted from Veitch et a/, 2002)... 71
Table 2:7 Productivity effects on work processes (van der Voordt, 2004)... 73
Table 2:8 Behaviour types and typical comments (Nathan & Doyle, 2002)... 81
Table 3:1 The three knowledge-constitutive interests (Adapted from Johnson & Duberley, 2000, p120)... 101
Table 3:2 A comparison of nomothetic and ideographic methods (Adapted from Gill and Johnson, 2002, p44)...104
Table 3:3 Operationalization of variables... 119
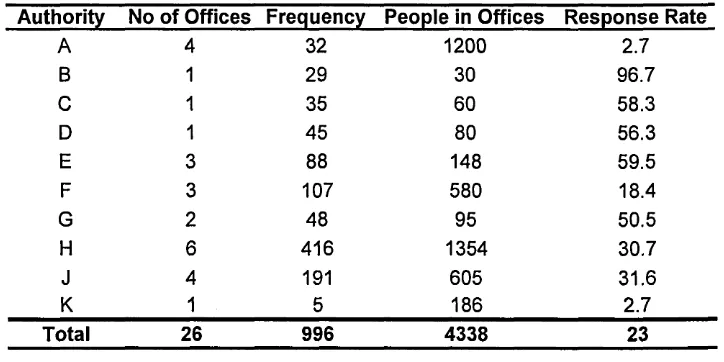
Table 3:4 : Local authority questionnaire response rates... 129
Table 3:5 Private sector company questionnaire response rates...131
Table 4:1 Coding of the dummy variables...155
Table 4:2 Local authority commonalities table... 157
Table 4:3 Kaiser-Meyer-Olkin and Bartlett’s tests...159
Table 4:4 Factors created using principal component and principal axis analysis.. 164
Table 4:5 Three factors created using principal component analysis...168
Table 4:6 Comparison of questionnaire categories with three factors created using principal component analysis...169
Table 4:7 Total variance explained with eigan value set at 1... 171
Table 4:8 Rotated component matrix with an eigan value of 1...172
Table 4:9 Total variance explained with an eigan value of 0.95... 173
Table 4:10 Rotated component matrix with an eigan value set at 0.95...174
Table 4:11 Total variance explained using eight factors... 178
Table 4:12 Eight factors created with factor extraction set at 8 ... 179
Table 4:13 Total variance explained using 7 factors... 180
Table 4:14 Rotated component matrix with factor extraction set at 7 ...181
Table 4:15 Unrotated component matrix...184
Table 4:16 Total variance explained for unrotated components... 185
Table 4:17 VARIMAX rotated component matrix... 188
Table 4:18 Total variance explained for VARIMAX rotated components... 189
Table 4:19 OBLIMIN rotated components...190
Table 4:20 Total variance explained for OBLIMIN rotated components...191
Table 4:21 Significant factor loadings based on sample size...192
Table 4:22 VARIMAX rotated component matrix with factor loading less than 0.3 removed...193
Table 4:23 VARIMAX rotated component matrix with highest factor loading for each variable... 194
Table 4:24 Seven factor analysis with Cronbach’s alpha reliability scores 197 Table 4:25 New ways of working criteria...201
Table 4:26 Factor loading cut-off point for research subsets...202
Table 4:27 Seven factor analysis of transitional knowledge workers...203
Table 4:28 Six factor analysis of transactional knowledge workers...204
Table 4:34 Seven factor analysis of individual process workers... 211
Table 4:35 Comparison of total data set with individual process data s e t... 212
Table 4:36 Commonality table for private sector data s e t...215
Table 4:37 Kaiser-Meyer-Olkin and Bartlett’s tests for private sector data s e t 216 Table 4:38 Total variance explained using seven factor analysis on private sector data set...217
Table 4:39 Seven factor analysis of private sector data set with Cronbach’s alpha scores...218
Table 4:40 Comparison of seven factor analysis for public sector and private sector data sets... 219
Table4:41 Seven factor analysis for combined datasets with Cronbach’s alpha scores...220
Table 4:42 Total variance explained of combined dataset with Latent root criteria adopted...224
Table 4:43 Comparison of seven factor and four factor solutions for combined dataset...225
Table 4:44 Percentile results for the four office productivity components... 228
Table 5:1 Work patterns adopted for this study... 233
Table 5:2 Demographic results for individual process workers...237
Table 5:3 Demographic results for group process workers...241
Table 5:4 Demographic results for concentrated study workers... 246
Table 5:5 Demographic results for transactional knowledge workers...252
Table 5:6 Chi-squared analyses of work patterns and categorical variables...261
Table 5:7 Work pattern ANOVA results...265
Table 5:8 Levene statistics for four office components... 265
Table 5:9 95% confidence interval results for comfort and work patterns... 267
Table 5:10 95% confidence interval results for office layout and work patterns...270
Table 5:11 95% confidence interval results for interaction and work patterns...274
Table 5:13 Variety of tasks and work patterns... 277
Table 6:1 Seven components of office productivity using the local authority dataset...288 Table 6:2 Ways of working criteria adopted in this study...289
Table 6:3 Component loading and reliability (Cronbach’s Alpha scores) for staff reporting engagement in different modes of working...290 Table 6:4 Seven components of office productivity created by combining both the local
authority dataset with the private sector company data set...291 Table 6:5 Four components of office productivity, and associated reliability, created
List of figures
Figure 1.1 Structure of thesis...22
Figure 2.1 Structure of Chapter 2 ... 26
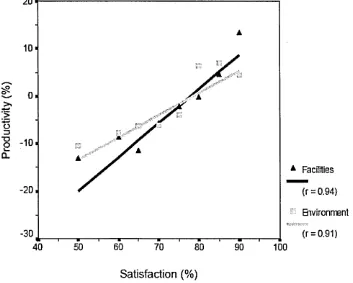
Figure 2.2 Correlation between productivity and satisfaction (Oseland, 2004)...59
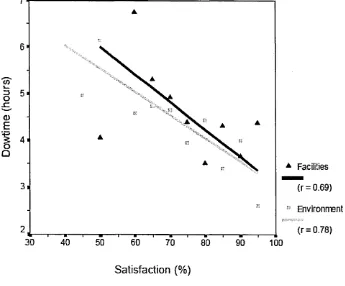
Figure 2.3 Correlation between downtime and satisfaction (Oseland, 2004)...60
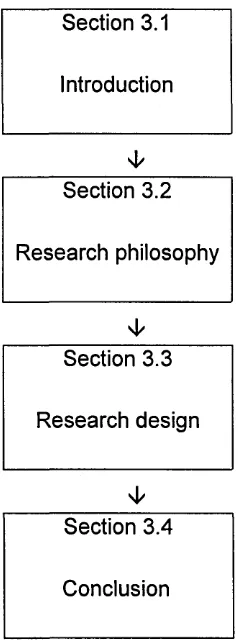
Figure 3.1 Structure of Chapter 3 ... 94
Figure 3.2 Assumptions about social science research (Adapted from Burrell & Morgan, 1979)...97
Figure 3.3 Continuum of core ontological assumptions (Adapted from Morgan and Smirich, 1980, p492)...98
Figure 3.4 Kolb’s Experiential Learning Cycle (Adopted from Kolb et al, 1970)...105
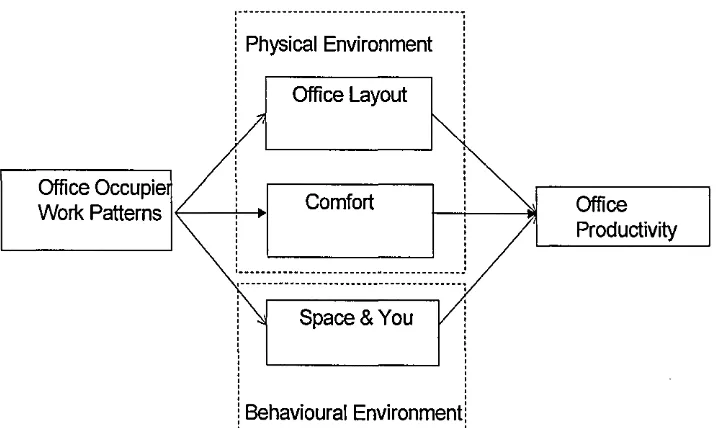
Figure 3.5 Concepts of office productivity...109
Figure 3.6 Theoretical framework of office productivity... 109
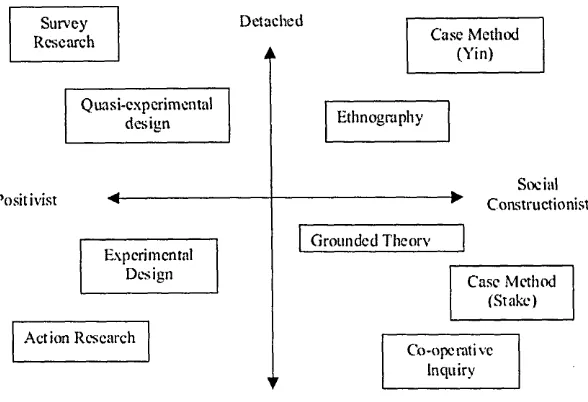
Figure 3.7 Matrix of alternative research designs ( Adapted from Easterby-Smith et al, 2002, p57)... 112
Figure 3.8 Relationship between concepts... 118
Figure 3.9 Flow chart of data analysis... 137
Figure 4.1: Structure of Chapter 4 ...145
Figure 4.2 Data analysis decision making diagram ( Adapted from Hair et al, 1995, p369)... 151
Figure 4.3 Scree plot... 177
Figure 4.4 New ways of working (Adapted from Laing et al, 1998)...200
Figure 4.5 Validated theoretical framework of office productivity... 227
Figure 4.6 Box plot results for four factors... 229
Figure 5.1 Structure of Chapter 5 ...234
Figure 5.2 Box plots of evaluative variables for individual process work... 239
Figure 5.3 Box plots of evaluative variables for group process workers... 243
Figure 5.5 Box plots of evaluative variables for transactional knowledge w ork 254
Figure 5.6 Error bars for comfort and work patterns... 266
Figure 5.7 Error bars for office layout and work patterns...269
Figure 5.8 Error bars for interaction and work patterns...273
Figure 5.9 Error bars for distraction and work patterns... 275
Figure 6.1: Structure of Chapter 6 ... 285
Figure 6.2 Theoretical framework of office productivity...286
Acknowledgements
This research was only made possible by the assistance, and support, of a number of people to whom I am forever grateful. I am particularly indebted to my supervisors, Professor If Price and Dr Murray Clark, for their guidance, tolerance and encouragement throughout the course of this research. I would also like to thank Phil Askham and James Pinder for their comments on this thesis during the editing stages. I would like to offer a special thanks to John Storr for stimulating and supportive discussions.
I am extremely grateful to all the organisations that have been involved in this study, and to the respondents who took the time, and effort, to complete the research questionnaire. I would also like to acknowledge the support of Sheffield Hallam University, and in particular the Facilities Management Graduate Centre.
Finally, a big thank you to my family. I realise that over the last six years times have been difficult and without their patience, tolerance and support this work would not have been completed. Therefore, I would like to dedicate this thesis to my wife Jane, my daughter Charlotte and my son Philip.
1 Introduction
1.1 Overview
There has been a fundamental shift in the structure of the UK economy from that of an economy based on manufacturing to one more based on service and knowledge. It is therefore estimated that approximately 80% of the UK workforce work in office environments (Oseland, 1999). Since increasing emphasis is being placed on the output of such offices, it is becoming increasingly important to establish the role the office environment plays in the performance of its occupants.
There has been much written on the effects of the office environment on occupiers' productivity, however little evidence has actually been presented. The evidence that does exist largely defines the office environment in physical terms, i.e. the layout of the office and the comfort of its occupants. Whilst there appears to be a general consensus that the office environment has an effect on the occupiers' productivity (Oseland, 1999; Leaman and Bordass, 2000; Clements-Croome, 2000) there does not appear to be a universally accepted theoretical framework that represents office productivity. Consequently there are two main research areas that require further development, firstly the measurement of productivity, and secondly the evaluation of the effects of the office environment on the productivity of its occupants.
This research focuses on the development of a theoretical framework for office productivity, in order to further understand the components of the office environment, and their relative impact on the occupiers' productivity. The research broadens the understanding of the office environment from that of a purely physical environment to include the behavioural environment. This provides an insight into the dynamic nature, or connectivity, of office environments. The main objective of this thesis is concerned with investigating the effects the office environment has on its occupant’s perceived productivity.
1.2 Background
is that it crosses a number of boundaries; property management, facilities management, environmental psychology, organisational culture and business performance measurement. Also topics that cross a number of disciplines offer opportunities to contribute to knowledge. Fleming and Storr (1999) established, whilst evaluating lecture theatres that two main bodies of literature existed. The bodies of literature were those of lecture theatre design and educational pedagogy, although little literature existed that linked the two, i.e. the existence of professional silos. It could be argued that professional boundaries exist in the area of office space management, and this research attempts to collapse some of those boundaries (Haynes et al, 2000).
1.3 Context and rationale
The nature of office work has changed over the last century from that of a passive and - static activity, to that of a dynamic and flexible activity. The changing nature of office work has created tensions in office design. The challenge, for modern office designers, is to create environments that support the ways that people work, and act as enablers of work processes, and not as disablers. Laing (1991) acknowledged the existence of the potential tension between office design and the work processes, and argued that the conventional office design, which was based on passive individual process work, was restricting organisations ability to be creative.
The foundations of office design can be traced back to the ideas of scientific management as proposed by Frederick Taylor, with standardisation of office layouts (Laing, 1991 & 1993; Duffy, 2000). Laing (1991) proposed that the office environment had reached a critical point in its evolution, and called for "Post- Fordism” in office design. Since the nature of work within businesses had changed, i.e. with the notion of work time and space being questioned, there was also a requirement for change in office design. Laing (1993) develops the argument by proposing that the main thrust of post-Fordism in the office environment is flexibility. The proposal being that flexibility is the way to productivity improvements.
"The design of the working environment has been considered by the vast majority of clients as a marginal and technical matter, best left to experts to sort out." (Duffy, 2000, P 371)
Duffy (2000) identifies that the discipline of facilities management has tended to be dominated by, and ultimately defined as a cost cutting discipline. He argues that if the profession had been more research based, then the pressures for cost cutting could have been resisted, allowing the case for the design of the work environment to support strategic business to be made. The call for facilities management research, and the development of a theoretical framework, is well supported by academia (Nutt, 1999; Grimshaw,1999; Price, 2001 and Caims, 2003).
The drive for greater efficiency of property provision, and ultimately cost reduction, is further fuelled by a RICS report - Property in business - a waste of space? (Bootle and Kalyan, 2002). The report claims that £18 billion a year is thrown away through the inefficient use of space. The report proposes that whilst property is often the second highest cost after wages, it is rarely on the boardroom agenda. Whilst Bootle and Kalyan (2002) establishes that £6.5 billion a year can be saved by adopting new working practises such as “hot-desking”, the main push towards new work methods is based on reduced costs, rather than new work methods to improve business performance.
Table 1:1 A 5 % saving in real estate costs increases gross profit by 9%
Table 1:2 A 5 % increase in productivity increases profit by 50%
Existing trading situation Turnover Total Costs Operating Profit 100 90 10
Total costs of 90% are made up of: real estate 20% = 18 other costs 80% = 72 90
Reduce real estate costs by 5% Total costs are now: real estate
other costs 17.172 89.1
New trading situation after reduction in real estate costs
Turnover 100
Total Costs 89.1
Operating Profit 10.9 (9%) increase
Existing trading situation Turnover Total Costs Operating Profit 100 90 10
Total costs of 90% are made up of: real estate 20%= 18 other costs 80% = 72 90
Increase Productivity by 5%
Turnover is new 105
New trading situation after increase in productivity
Turnover 105
Total Costs 90
Operating Profit 15 (50% increase)
The information presented in Table 1:1 highlights the fact that a 5 % reduction in real estate costs can translate directly to the bottom line of the business with a 9% increase in operating profit. Acknowledging that this is an illustrative example it does assist in understanding why the real estate and facilities management departments have been perceived as cost cutting departments.
However, an alternative approach can be developed, if it is assumed that:
I. Staff costs are equivalent to the other costs used in the illustrative example.
II. A 5 % increase in productivity is achieved instead of a 5% reduction in real estate costs.
the facilities performance measurements to those of the organisation, thereby demonstrating the impact of the facilities on the performance of the organisation.
Haynes et al (2000) undertook a literature review to establish if any evidence existed that linked the impact of buildings and workplaces to the business performance of the organisation1. The main findings can be summarised as follows:
I. Previous research had produced little overlap between the three main arenas of: Property and real estate, Facilities and workplace and Business and performance
II. No validated theoretical framework existed that linked the performance of the workplace to the performance of the organisation.
III. The literature relating to office design, tended to concentrate on the open-plan verses cellular office debate. The metrics used in the debate tended to be that of cost. Therefore the issues identified tended to revolve around operational issues rather than strategic issues.
IV. The link between organisational culture and the office environment appears to be lost2.
V. Office environments are more than just furniture and walls, they are also places where people interact to create and transfer knowledge. Ward & Holton (2000) argue the importance of the linkage between space and knowledge creation, but acknowledge that managing space is probably the least appreciated tool of contemporary knowledge management.
These main findings attempt to summarise the debate relating the office environment to occupier productivity. Whilst the post-fordist office environment, which embraces organisational culture and knowledge creation, may be a desired position, it is clear that the existing literature is grounded in the cost reduction paradigm. To change the debate from cost to business performance there is a requirement to put into place a new theoretical framework.
1 This review was an output of the Occupier.Org project, which involved a number of staff from Sheffield Hallam University and was led by Prof. If Price. The executive summary of the report can be seen in Appendix A.
This research will aim to address some of the issues identified in the occupier.org research project. This thesis will provide evidence of new and original findings, which add to the office productivity debate.
It is proposed that the main contributions to knowledge of this study are as follows:
A major contribution of this study is the development of office productivity from a theoretical framework to a validated research method that allows reliable assessment of office productivity. The study’s strength is that it is based on two sizable data sets, (996 respondents and 426 respondents) which when combined provide a data set of 1,422 responses. Whilst the data collected contain evidence about the physical characteristics of the office environment, it has in addition data pertaining to the behavioural environment. The categorical data collected provide a unique opportunity to undertake an analysis by work process type.
This study adds directly to the workplace literature by broadening the debate. The debate around office environments has tended to revolve around open-plan offices and cellular offices. The main line of argument developed tends to be one of cost reduction, i.e. open-plan offices are more cost effective than cellular offices. The logical conclusion of this line of argument is that as many people as possible should be put into open-plan offices. Unfortunately, this one-size fit all approach does not accommodate different work processes. Whilst some work processes require the occupant to work privately, others require more group type working. This study allows office occupants to be categorised by their work type, thereby allowing a more detailed analysis of office occupants to be undertaken. Also the analysis by work process also gives an indication as to the office culture, i.e. the degree of autonomy a office worker has, will be very much determined by the type of prevailing culture.
Managers responsible for office environments can use the techniques, and the analysis procedures, developed to evaluate the productivity of office environments3. This would assist managers to establish office environments that were having a negative effect on its occupants, and the model developed would assist in establishing the major cause of those negative impacts. The positive results can be just as important to the manager as the negative, as this is an indication as to areas in the office environment that are working correctly. A comparative approach between offices can allow best practice solutions to be transferred from one office to another office. Models developed in this study can be used over time, thereby providing a monitoring system that continually evaluates the match between the occupants and their office environment. Such information can be used to adapt the office environment to meet changing office occupant demands.
1.4 Research aims
The main aims of this study can be summarised as follows:
I. Conduct a critical review of the literature to establish the strengths and weaknesses of the current state of office productive knowledge.
II. Develop a theoretical framework to represent office productivity, consisting of both physical and behavioural components.
III. Demonstrate that it is the behavioural components of interaction and distraction that have the greater impact on office productivity.
IV. Establish if office occupiers, who adopt different work styles, can be segmented based on differences of perceived productivity with regards to the physical and behavioural environment.
1.5 Research approach
When the research began there were numerous claims of office environments having effects on productivity but little evidence, supported by a literature review conducted by Haynes et al (2000). It was this lack of empirical evidence that formed the basis for this research4.
The first dataset was obtained in 2000, from a research project for a local authority research forum that was managed by FMGC at Sheffield Hallam University. The data were collected using a paper based questionnaire survey. In total 10 local authorities took part in the research project, with responses from 26 offices. The actual number of respondents was 996 from a population of 4,338 office occupants.
The second data set was obtained in 2002, from the private sector, though a piece of contract research. This additional dataset provided an opportunity to test the findings of the first dataset. The data set was collected from one company consisting of four main buildings, which formed the company’s head office. The total number of head office staff was 800. The data were collected using an online questionnaire with a response rate of 53%, i.e. 422 respondents.
1.6 Structure of the thesis
Following this introductory chapter, this thesis is presented in 5 main chapters, as can be seen in Figure 1.1.
Chapter 2
Literature review
* Chapter 3
Research methodology
* Chapter 4
Model Development
V
Chapter 5
Discussion of Results
Chapter 6
[image:26.612.219.372.82.498.2]Conclusions
Figure 1.1 Structure of thesis
Chapter 3 describes the research methodology that has formed the basis for this study. The first part of the chapter explicitly discusses the philosophical foundations on which the study was built. This part of the chapter aims to address the philosophical debate surrounding facilities management research in general, and workplace research in particular. The second part of Chapter 3 presents the rationale and justification for the research design. This includes the development of the survey instrument and consists of both the design, and the data collection processes. The final section of Chapter 3 presents an overview of the analysis techniques used in testing the research hypotheses.
The first part of Chapter 4 uses factor analysis as a means of data reduction to provide underlying structure to the evaluative variables used in the study. The reduction of the variables to components offers an insight into the concepts of office productivity. The chapter develops to demonstrate rigour of evaluation, and justification of the decision making process. Both the data sets used in this study are compared and contrasted as a means for validating the components created. The final sections of Chapter 4 consist of scale development, which allows quantitative values to be attached to the components for further analysis.
Chapter 5 uses the four concepts, previously derived in Chapter 4, as the new evaluative variables. The concepts are then used as the basis of analysis for the different work patterns. The analysis consists of two major components. The first part of the analysis uses data exploratory techniques to evaluate the concepts within each of the four work patterns. The second part of the analysis applies a range of confirmatory statistical techniques, using the concepts as the common metric of analysis. This approach allows statistical comparisons to be made between the work patterns and the concepts.
Chapter 2
2 Literature review
2.1 Introduction
This chapter aims to review the literature associated with the measurement of office productivity. Particular attention is given to literature that claims to link the office environment with the productivity of its occupants. Issues of measurement are reviewed in an attempt to establish appropriate metrics for the measurement of office productivity.
The majority of the literature that attempts to link office environments and productivity considers the office environment to be a tangible physical environment. Issues of comfort and layout are the two main tangible components of the office environment that are reviewed.
The latter part of the literature review concentrates on the literature that attempts to link the behavioural components of the office environment with occupiers' productivity. It will be established that this is an underdeveloped area, and whilst conceptual debate exists, there is a requirement for further research-based evidence.
Section 2.1
Introduction
Section 2.2
Measurement of office productivity
*
Section 2.3
Physical environment
*
Section 2.4
Behavioural environment
*
Section 2.5
[image:30.612.237.372.28.467.2]Conclusion
Figure 2.1 Structure of Chapter 2
2.2 Measurement of office productivity
competing paradigms: the cost reduction paradigm, and the human contribution paradigm.
2.2.1 Historical context
During the start of the twentieth century the prevailing paradigm with regards to the design and management of work process was that of scientific management (Taylor, 1911). The methodology proposed by Frederick Taylor was that if time and motion studies were undertaken then the most efficient way of task performance could be identified. Once this optimum way of performing any given task was established, it was then standardised so that all employees could then adopt the optimum work method. The strength, and ultimately the weakness, of this approach is that the worker was perceived as a potential source of error and therefore their direct contribution had to be minimised as much as possible, through not only standardised work methods, but also standardised working environments (Stallworth & Ward, 1996).
"Taylor assumed that the sole motivation for workers was money and paid little attention to well being, health or other factors." ( Oseland, 1999, p6)5
Oseland (1999) claims that Taylor was well aware of the limitations of his scientific management techniques.
"Taylor acknowledged that his methods were only appropriate for factory operatives and would not work for intelligent employees because of increased monotony." (Oseland, 1999, p7)
Lloyd Wright, and the building was a purpose built headquarters for the Larkin Company. The building was designed to represent an ordered structure, with architect- designed desks, which allowed little freedom of movement for the employees. The clerks working in the building were perceived as units of production (Duffy, 1998)
The Hawthorne studies were early attempts to link the performance of employees to their working environment. The studies took place at the Hawthorne plant, which was part of the Western Electric Company. The research directors were Elton Mayo and F.J. Roethlisberger. The purpose of the research was to establish how a productive and satisfying working environment could be achieved (Roethlisberger & Dickson, 1939).
The research concentrated predominately on human behaviour in the context of the working environment. Over the years two studies produced unexpected and revealing results about how people behaved in their working environment. The two studies were the illumination experiments and the bank wiring observation room study.
The first study related to experiments with changing lighting levels. The study was set up as a traditional experiment with the use of a control group and a test group. The independent variable was the lighting level and the dependent variable was the measured output, i.e. the productivity of the employees. The research team were surprised to find that both groups productivity increased. Clearly there was another intervening variable that the research team had not considered. After conducting a range of tests, with different lighting levels, the researchers concluded that it was actually their presence in the research that was affecting the productivity levels. This discovery came to be known as the Hawthorne effect.
"Results of the illumination study are often used as an example of what has come to be known as the Hawthorne effect, a term that describes the phenomenon of individuals altering their behaviour not because of specific changes in the environment, but because of the influence of the person making the changes. At the Hawthorne plant, attention from the researchers apparently motivated workers to raise their productivity. This illumination study demonstrated that interpersonal relations between workers and researchers, much more than levels of illumination, affected productivity. "(Smither,
1998, p14)
greater the employee's pay. The research team observed that when new employees started with higher productivity levels than the experienced workers, they eventually reduced their levels to be more in line with more experienced workers. This was a form of work restriction. The research team were surprised that set against the backdrop of the Great Depression, with money being particularly tight, that the conforming to the norm of the group was deemed to be more important than individual financial reward (Smither, 1998).
The results of the Hawthorne studies led the research team to conclude that it was the social factors that were more important than the physical factors with regards to employee satisfaction and productivity.
Duffy (1998) cites the Hawthorne studies as clear evidence that any single environmental variable is overlaid with the wider issues of human relations. He goes on to call for a more appropriate approach to measuring environments called “ open social- technical systems”. Smither (1998) identifies a number of limitations of the Hawthorne studies including faulty methodology, too narrow a focus and underlying assumptions. Cairns (2003) presents further evidence to question the validity of the Hawthorne studies, and therefore claims that challenges to the validity of the studies also leads to challenges to the conclusions of the studies.
Duffy (1998) claims that as a consequence of the Hawthorne studies no serious research into the effects of environmental variables and productivity were undertaken for a number of years. Caims (2003) maintains that it was the Hawthorne studies that led to the acceptance in organizational theory of the dominance of social over physical factors.
Caims (2003) goes on to suggest that:
on productivity from the end user's point of view. This “occupier perspective” approach to office environments can also address the criticism that office providers are detached from the office users.
"Managers continually plan, build, change and control an organization’s physical surroundings, but frequently the impact of specific design or design change on ultimate users of the facility is not fully understood’’(Bitner, 1992, p 57)
Whilst the research methods of the Hawthorne studies can be criticized, their discovery that the working environment consists of more than the physical elements contributed to the development of the human relations movement. Also the Hawthorne studies identified that viewing workers purely in a mechanistic Taylorist way was fundamentally flawed (Smither, 1998). This thesis will present an argument to suggest that this is an approach that has been largely lost in the context of office occupiers and their working environment
2.2.2 Defining office productivity
Before productive office environments can be measured, it would be useful to differentiate between productivity and performance. This is an area that has attracted much debate and disagreement. Sink (1985) proposed that seven dimensions, one of which is productivity, could measure “Organisational Performance”.
Effectiveness (quality, quantity, meeting targets)
Efficiency (ratio of expected resources to those used)
Quality (subjectively or objectively assessed quality attributes)
Profitability (ratio of total revenues to total costs)
Productivity (ratio of quantity of output to input in terms of value/cost)
Quality of work life (psycho-social aspects and social response to company)
Innovation (applied creativity)
(Oseland, 1999, p2)
such as quality of work life and innovation (Sink, 1985). However, the definition of productivity is very much of the Taylorist tradition, i.e. quantity driven. In contrast Weisbord (1987) attempts to acknowledge the social side of productive workplaces, by proposing the linkage between productive workplaces and organisational development. This linkage is further developed by Duffy (1990), who proposes that performance measures for buildings should be more innovative, and linked to how the organisations manage change. This was an early attempt to integrate building performance measurement into the change management, or organizational development, of the organisation.
Oseland (1999) supports the definition of productivity presented by Sink (1985), i.e. as a ratio of input to output, having conducted an extensive literature review; he concludes that productivity is generally expressed into terms of efficiency (Oseland, 1999). This simplistic approach leads to two possible ways of increasing productivity, either increase outputs for same inputs, or achieve same output with reduced input6. However whilst what exactly constitutes an input and what constitutes an output tend to be presented in general terms such as: “the resources used to products or services produced”. However, Oseland (1999) develops the debate by acknowledging the complexity of measuring inputs and outputs, especially in today’s modern office. Mawson (2002) adds to the debate by stating:
"Productivity is comparatively easy to understand and measure in a manufacturing economy, but as our economies have migrated from manufacturing to service and on to knowledge-based, so the whole issue of assessing productivity has become less clear’’ (Mawson, 2002, p1)
different approaches to office productivity measurement. The next section will discuss these approaches, with specific emphasis being placed on evaluation of research-based evidence.
2.2.3 Approaches to measuring office productivity
Part of developing a measure of office productivity is the identification of elements that could be perceived has having a considerable impact on performance. One such element, relevant to the office environment, is information technology (IT). Although in the early 1990s commentators ( Brynjolfsson, 1993), were questioning the productivity benefits of IT, relative to the amounts of money invested in its development. Brynjolfsson(1993) identified the “productivity paradox” of information technology, the theory being that the introduction of IT should have led to increases in productivity. However, the net contribution, per head, to GNP output (the high level measure of productivity) fluctuated but, unlike the manufacturing sector, showed no real growth.
Aronoff and Kaplan (1995) undertook a similar analysis to Brynjolfsson (1993), on the role of IT in white-collar productivity, and drew an analogy to the beginning of the twentieth century when increased productivity of manufacturing plants did not occur until the appropriate electrical infrastructure was developed, thereby establishing a time lag before productivity gains could be established. It could be argued that information technology, email, internet and telecommunication systems, could be the new infrastructure, and they have reached such a level that they have had a considerable impact on the way that the people now work in offices in comparison to the office workers of the early 1990’s.
This is another illustration of the complex nature of office productivity, and reiterates the question as to what is a suitable and appropriate measurement of office productivity. Aronoff and Kaplan (1995) make an attempt to identify the measures that may be appropriate assessment techniques such as, absence measures, activity logs, attitude and opinion surveys, and direct measures but offer no real theoretical framework to link the measures (Aronoff and Kaplan, 1995).
" A person's work environment directly affects the quality and quantity of work he or she is able to produce." (Aronoff and Kaplan, 1994, p10)
Whilst Kaplan and Aronoff (1994) propose that the office environment and worker performance are correlated, they produce no data to support this claim. However they do contribute to the debate on productivity measurement at a theoretical level, by acknowledging the office environment as being linked to symbols of power and authority.
"Individuals place great importance on the quality of their work setting. This is clearly reflected in the use of higher-quality work settings as a reward for superior performance and as a symbol of elevated status. Comfort, environmental control, space and views to the outside are key amenities. While these features are treated as luxuries, they all have an impact on organisational performance." (Kaplan and Aronoff, 1994, p8)
One of the conclusions that Kaplan and Aronoff (1994) reach is that in the absence of measurable business value of the work environment, it is left to the senior executive to undertake a leap of faith in the benefits of improved productivity through upgrading office quality.
motivation, productivity and the work environment can best be summed up as “person-environment fit” (Stallworth & Ward, 1996).
"The existing data suggest that non-supportive design has negative effects on work and workers, and design appropriate to the work has positive ones. In fact, many businesses have begun changing their design and organizational cultures with positive results. Only time and more observation can reveal what will result from these changes."(Stallworth & Ward, 1996, p34)
Stallworth and Ward (1996) acknowledge that the linkage between people and the physical environment is starting to be addressed by the emergence of environmental psychology, but they also acknowledge that this type of research is in its early stages of development.
"Research of relationship of office design and its effect on the workers' needs and satisfaction, especially regarding productivity, is still in its infancy." (Stallworth & Ward,
1996, p41)
A totally “people-centred” approach to evaluating users of office environments is adopted by Leifer (1998). He uses a measure of office user satisfaction on a five- point Likert scale, and presents a number of Australian case studies as means of supporting this approach to user evaluation. However, other authors such as Hadi (1999) propose a more holistic view to the measurement of office productivity. She proposes that productivity measures should be discussed and split into three sections:
1. Quantifiable and tangible measures
2. Indirect measures, i.e. staff turnover etc
3. Organizational measures such as teamwork and creativity
services firms (Nachum, 1999). This illustrates the point about the complex nature of measurement of office worker productivity.
Hadi (1999) then goes on to discuss the various methods that data can be collected.
"Questionnaires, observational techniques, structured interviews, focus groups and job/task analysis." (Hadi, 1999, p20)
It could be argued that this is merely a list of research methods, rather than a justified methodology. The main proposal is that there is a requirement for a range
of viewpoints to be considered when trying to assess productivity in the workplace.
"Without observation and physical measurements you will miss the objectivity, without a broad range of subjective opinions from all involved parties, through questionnaires, interviews and focus groups you will miss the balanced perspective needed to give you the big picture." (Hadi, 1999, p21)
Whilst Hadi (1999) presents an argument for an assessment of both the tangible and intangible components of the office environment, which on the face of it appears to be a reasonable proposal however no research results are presented, and therefore the practicalities of adopting such a wide range of research methods cannot be evaluated.
The Office of Real Property develops their Cost per Person Model in the “Workplace Evaluation Study (Office of Real Property, 1999b). Whilst the emphasis is on the estimated savings available by the use of alternative work environments, there is an acknowledgement that office worker productivity is more complex than just measuring outputs.
"Traditional measures of real property performance concentrate on cost and ignore the benefit side of the equation. Underlying this one-sided view is the fact that the primary benefit we obtain from workplace advances and improvements would seem to be an increase in productivity. In the case of knowledge workers (a description that fits a large proportion of Federal workers housed in primarily office-type space), the question of how to measure productivity is just beginning to be studied." (Office of Real Property,
1999b, p21)
Whilst the Office of Real Property (1999b, p24) acknowledge the complex nature of measuring productivity they maintain that any measurement is better than no measurement, and propose the following examples of indirect measurement of employee productivity:
I. Turnover - retention of employees, cost of retaining
II. Absenteeism - sick leave, annual leave
III. Self-assessment of workplace effects on one’s own productivity
IV. Time-tracking devices -log books, overtime, project hours
V. Customer demand for products or services
VI. Observed downtime for modifications, complaints, interruptions
VII. Anecdotal evidence on workplace suitability - people’s perceptions of workplaces suitability are still a viable measurement, especially when captured from “grassroots” perspective.
VIII. Churn costs - employee downtime, space move costs, time to execute a move and get a person back up-and-running (phone, computer, etc)
Clements-Croome (2000, p8) presents the following productivity measures, from an ASHRAE7 workshop on "Indoor Quality" (1992), as being significant:
Table 2:1 Proposed measures of productivity from ASHRAE workshop on “Indoor Quality" (1992)
~~ Proposed measures of productivity 1 absence from work, or workstation
2 health costs including sick leave, accidents and injuries 3 Interruptions to work
4 controlled independent judgements of work quality 5 self-assessments of productivity
6 speed and accuracy of work
7 output from pre- existing work groups 8 cost for the product or service
9 exchanging output in response to graded reward 10 volunteer overtime
11 cycle time from initiation to completion of process 12 multiple measures at all organisational levels
13 visual measures of performance, health and well-being at work 14 development of measures and patterns of change over time_____
Oseland (1999) included the measures from the ASHRAE workshop in his extensive literature review, and identified that little to no research had been undertaken using such measures. He proposed that many of the items on the list tended to be performance indicators, rather than measures of productivity. Oseland (1999) establishes three different approaches to measuring productivity.
i) Performance measures,
ii) Self-assessed productivity, and
iii) Staff costs and profit.
is that it may also attract new members of staff; this in itself may increase productivity by the introduction of new ideas. Whilst Oseland (1999) does not establish definitive performance measures, he reiterates the complexity in establishing tangible measures of office productivity, he also acknowledges the difficulty in measuring the service sector, since the outputs tend to be ill defined and prone to a wide range of variation. This point is probably best illustrated by a quote Oseland used from Brill et al (1984) after a survey of 70 companies.
"No organisation in our survey has available any in place work measuring system for measuring job performance."(Brill et al, 1984)
It is this complex nature of trying to define quantifiable productivity measures appropriate to the office environment, that leaves the whole area of office productivity measurement as being ill defined, and void of any robust and valid office productivity measurement framework.
Having acknowledged the weakness of trying to establish more tangible means of assessing productivity, Oseland (1999) reviews the self-assessed approach to productivity. He proposes that self-assessment of productivity is not a new measure, and goes on to argue that perceived productivity could be as important as actual productivity.
"Self-assessment of productivity has been used in the field for some time and has provided useful results." (Oseland, 1999, p4)
Whilst Oseland (1999) presents evidence to support the notion that perceived productivity can be used as a surrogate for actual productivity, he also acknowledges that it can be useful in assessing relative changes in performance. Oseland (1999) stops short of confirming self-assessment as the most appropriate measure of office productivity, and goes on to request further research with a larger sample sizes to instil confidence in the self-assessment measure.
disadvantages of using a self assessed measure of productivity, and conclude on balance the advantages outweigh the disadvantages.
The advantages and disadvantages of using a perceived productivity scale, as identified by Leaman and Bordass (2000, p170), are presented below:
Advantages:
• A single productivity question covers the topic so it can be incorporated in surveys with wider objectives. (Although building managers are still wary of the questions and sometimes forbid its use)
• The question is common to all respondents so that fair comparisons can be made between most of them.
• It can be incorporated in questionnaires across different building types.
• Large samples may be surveyed relatively cheaply.
• Benchmarks of averages or medians may be used to assess how occupants’ perceptions in individual buildings score against a complete dataset.
• Data analysis and verification are easier across large samples in many different buildings.
Disadvantages:
• The nagging doubt that perceived productivity as measured may not associate well with the actual productivity of occupants. (Although many agree on the key point that perceived and actual productivity are strongly associated)
It could be observed that one of the advantages claimed by Leaman and Bordass (2000) i.e. perceived productivity measured by a single question, could be perceived as a weakness and could be improved upon by the use of a multi- variable approach.8
It could be concluded that the difficulties in measuring office productivity, generally stem from the lack of any universally accepted means of assessing job performance. The range of different tasks undertaken in the office environment, adds to the complexity of measurement. It is therefore understandable that research that has produced evidence has adopted a pragmatic self-assessment approach. This approach to measurement adopts a “people-centred" approach to office evaluation, which is in alignment with establishing the end user or occupier perspective.
2.2.4 Cost reduction to human contribution
This section will aim to establish that the quest for productivity improvements has led to two different paradigms, the control paradigm and the enabling paradigm. The control paradigm aims to improve productivity through greater efficiency, which when applied in practice usually means a reduction in resources, which can be either financial or actual space. The enabling paradigm acknowledges the human asset and the creation of knowledge capital as a means of improving office productivity.
When discussing staff cost and profit Oseland (1999) argues that staff salaries are a convenient means of assessing productivity, since anything that affects staff time, such as illness, can be converted into a financial measure. Oseland (1999) develops the staff cost debate by comparing it to premises revenue costs, suggesting that staff cost can be in the region of 70-80% of revenue, whilst premises costs can be a low as 5% of revenue. The argument is developed to suggest that small gains in staff productivity can offset capital costs for premises development, such as heating, ventilation and air conditioning. This leveraging approach can be argued the opposite way, mismatching people with their work environments could have a significant impact on overall organisation performance.
The same “leveraging “ argument is adopted by Clements-Croome (2000) to establish that a greater emphasis should be placed on productivity improvements of indoor environments, rather than energy efficiency of the offices. This approach has further been developed by Becker and Pearce (2003), who propose an integrated cost model. The model consists of both corporate real estate and human resource factors. They call their model the Cornell Balanced Real Estate Assessment model, COBRA, which includes the three main variables: measures of productivity, human resources costs and real estate costs. Together the three variables in the model enable organisations to make strategic real estate decisions.
"HR impacts can be highly significant, and if incorporated into a single model might lead to recommendations very different from those based only on the direct real estate costs." (Becker & Pearce, 2003, p233)
A typical example would be the evaluation of a new capital build, if the choice was between a basic development or one of a higher standard, and subsequent cost, the costing model would predict the appropriate rise in employee productivity required to pay for the more expensive option. Although this raises the issue of productivity measurement to the strategic level, thereby allowing organisations to make informed decisions by identifying the potential consequences of their decision on productivity, the productivity measure used is determined from the increase in turnover, and is therefore not a direct measure of individual productivity. It could also be argued that since the productivity measure is not derived from the individual level, then the model could potentially be used as a cost reduction model since the true impact on individual productivity is not incorporated.
organisations put into place strategies to ensure that knowledge is explicit rather than implicit through employees working together sharing their knowledge.
The productivity measurement debate is developed by Clements-Croome & Kaluarachchi (2000), who propose that a responsive working environment should create a sense of well-being. They propose that productivity is dependent on “healthy buildings”, and therefore widen the debate about productivity measurement to incorporate health, well-being and comfort. They propose a five level analytical hierarchy process model to represent the main factors that influence productivity. The model contains environmental factors such as temperature and humidity, ventilation, lighting, crowding and then links them to health factors which are defined as respiratory, skin, nervous, nasal and related problems. Whilst this model contributes to the measurement of environmental and comfort components associated with productivity, it lacks the social and behavioural components that are an integral part of a modern office.
The main weakness of the analytical hierarchy process model, proposed by Clements-Croome & Kaluarachchi, (2000), is addressed by Clements-Croome (2000) by the inclusion of a social concept as being a factor which has an affect on productivity. Although this proposal lacks the operationalization of the concepts to actual measures, it does provide a theoretical framework for considering productivity measurement, which has been previously lacking.
Table 2:2 Factors that affect productivity (Clements-Croome, 2000, p11)
_________________ Factors which affect productivity_________________ Personal Career achievement home/work interface intrinsic to job Social Relationship with others
Organisational Managerial role, organisational structure
Environment Indoor climate, workplace, Indoor Air Quality___________
factor an integral consideration for the modern office.9 Price (2001) recognises the limitations of current research and developments in working environments by establishing a need to address the psychological needs of individuals.
It could be argued that a limitation of the office productivity literature is that the linkage between individual productivity and the wider impacts on business are not made (Haynes et al, 2000). This appears to be mirrored by a more general limitation of linking facilities performance measures to the business performance measures (Hinks, 2000). This is a view supported by Bradley (2002). Having reviewed 150 sources relating to workplace performance improvement he concluded that:
"There are two primary shortcomings in the literature searched. Firstly, it is apparent that real estate and workplace design research, the subject of programming and evaluating performance change is rarely approached systematically and holistically in relation to business performance.
Secondly the scope of performance study is often drawn so narrowly (e.g. task productivity resulting in improved comfort conditions) that the output is unconvincing and of little strategic importance to business leaders." (Bradley, 2002, p151)
Bradley (2002) is critical of the academic literature, claiming that:
"Practitioners and managers do not value the academically rigorous focus on a single dimension of performance." (Bradley, 2002, p151)
1. Stakeholder perception (e.g. customer satisfaction and loyalty, community sentiment)
2. Financial health (e.g. economic or marker value added)
3. Organisational development (e.g. innovation quality and quantity; cultural factors; team formation; and new process introduction rate)
4. Productivity (e.g. space utilisation, process speed and quality, waste levels)
5. Environmental responsibility (including transport-related sustainability effects)
Plus of course:
6. Cost efficiency (e.g. total occupancy cost related to revenue generation).
Whilst Bradley (2002) attempts to present a business model, the language used for the productivity elements appears to be clearly planted in the cost reduction paradigm, rather than the more appropriate value added paradigm. It should also be acknowledged that the proposal by Bradley (2002) is more of a theoretical framework, as no empirical evidence is presented to support the balanced scorecard approach. However, he identifies the limitations of perceiving workplace innovation, and consequent evaluation, as being a one-off project, rather than being integrated into a more complete change management programme, a view supported by Laframboise et al (2003). The proposal being that evaluation should be undertaken on a continual basis and be built into, and budgeted for, within project plans. Bradley (2002) ultimately concludes with the following:
"Relative indications of performance (monitored over a relevant time period) are likely to be more useful in judging the success of workplace innovation than absolute metrics." (Bradley, 2002, p15)
The benefits of continual evaluation of workplace environments are supported by Kaczmarczyk & Murtough (2002). However they warn against the use of evaluations as a means to create a case for innovative workplace environments. McKee (2003) states that any tools used for productivity improvement should be deployed in a structured framework that manages the overall change process.