DEVELOPMENT AND VALIDATION OF NEW ANALYTICAL
METHOD FOR THE SIMULTANEOUS ESTIMATION OF
METFORMIN AND SITAGLIPTIN IN BULK AND DOSAGE FORM BY
RP- HPLC
Pavan Kumar V.*1, M. Kavitha1, Sonalika Patro1, Ch. Bhavya1 and Anupam Kanti Bag2
1
Department of Pharmaceutical Analysis, Ratnam Institute of Pharmacy, Pidathapolur,
Nellore.
2
Department of Pharmacology, Annamacharya College of Pharmacy, New Boyanapalli,
Rajampet.
ABSTRACT
A simple, accurate, rapid and precise method is developed for the
quantitative simultaneous determination of Metformin and Sitagliptin in
combined pharmaceutical dosage form. The method was based on
HPLC separation of two drugs in reverse phase mode using C18, (250 X
4.6 mm), 5μ by using Potassium Di hydrogen phosphate buffer (pH
4.0) and Methanol in the ratio of 60:40 v/v was pumped through
column at a flow rate of 1.0 ml/min and detection wavelength was set
at 210 nm. The retention time was 2.39 min for Metformin and 3.37
min for Sitagliptin respectively. The % RSD of Metformin and
Sitagliptin were found to be 0.8 and 0.4 respectively. The % recovery
was obtained as 100.43 and 100.50 for Metformin and Sitagliptin
respectively. The accuracy and reliability of the method was assessed by evaluation of
linearity, precision (intra-day and inter-day % RSD >2), accuracy (98-102%), specificity,
LOD, LOQ values in accordance with ICH guidelines. The developed method is applicable for
routine quality control analysis of selected combined dosage forms.
KEYWORDS:RP-HPLC, Metformin and Sitagliptin.
Volume 6, Issue 3, 1691-1700. Research Article ISSN 2277– 7105
*Corresponding Author
Pavan Kumar V.
Department of
Pharmaceutical Analysis,
Ratnam Institute of
Pharmacy, Pidathapolur,
Nellore.
Article Received on 17 Jan. 2017,
Revised on 07 Feb. 2017, Accepted on 27 Feb. 2017
1. INTRODUCTION
Development of simple and reproducible analytical methods for estimation of
multicomponent drugs is very important part of quality control and for social awareness
which is established in present work.[1]
Metformin[3] is mainly used for the treatment of type 2 diabetes. Metformin's main effect is to
decrease liver glucose production. It also increases insulin sensitivity, which increases
peripheral glucose uptake. Metformin decreases high blood sugar, primarily by suppressing
liver glucose production. The average patient with type 2 diabetes has three times the normal
rate of gluconeogenesis[2] metformin treatment reduces this by over one-third.
Sitagliptin[4] is an oral anti-hyperglycemic (anti diabetic) of the dipeptidyl peptidase-4
(DPP-4) inhibitor class Sitagliptin works to competitively inhibit the enzyme dipeptidyl peptidase-4
(DPP-4). This enzyme breaks down the incretins GLP-1 and GIP, gastrointestinal
hormones released in response to a meal By preventing GLP-1 and GIP inactivation, they are
able to increase the secretion of insulin and suppress the release of glucagon by the alpha
cells of the pancreas.[2]
METFORMIN SITAGLIPTIN
2. MATERIALS AND METHODS
2.1. Chemical and Reagents
Metformin and Sitagliptin were kindly gifted by Derex Labs Pvt Ltd, Hyderabad certified to
contain 99.9% and 99.6% purity respectively. The drugs were used without further
purification. All the solvents used in analysis were of HPLC grade. Istamet Tablets (label
2.2. HPLC method
Instrument
LC system used consists of Waters HPLC having Empower Software with 2695 separation
module having PDA detector with universal loop injector of injection capacity 20 μL. The
column used was YMC C18 Column, 5µ (250× 4.6 mm) at ambient temperature. Different
mobile phases were tested in order to find the best conditions, for separating both the drugs
simultaneously.
Optimised Chromatographic conditions
The mobile phase having Potassium Di hydrogen phosphate buffer (pH 4.0) and Methanol in
the ratio of 60:40 v/v was selected because it was found that it ideally resolve the peaks with
retention time (RT) 2.39 min and 3.38 min for Metformin and Sitagliptin respectively.
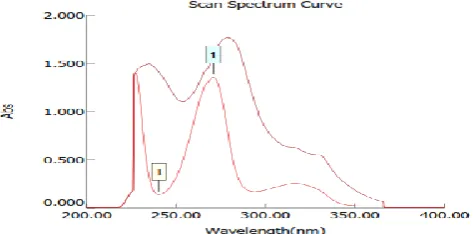
Wavelength was selected by scanning all standard drugs over a wide range of wavelength
[image:3.595.182.419.375.492.2]200nm to 350nm. Both the components showed reasonably good response at 210 nm.
Fig 1: Overlain UV Spectrum of Metformin and Sitagliptin
Preparation of Phosphate Buffer
Accurately weigh 1.732g of Potassium Dihydrogen Ortho phosphate was taken in a 500ml
volumetric flask, dissolved and diluted to 500ml with HPLC water and the volume was
adjusted to pH 4.0 with Ortho Phosphoric Acid.
Preparation of Mobile Phase
Accurately measured 600 ml (60%) of above buffer and 400 ml of Methanol (HPLC Grade)
(40%) were mixed and degassed in an ultrasonic water bath for 10 minutes and then filtered
Standard Solution Preparation
Accurately weigh and transfer 100 mg of Metformin and 10 mg of Sitagliptin working
standard into a 10 ml clean dry volumetric flask add about 7 mL of Diluent and sonicate to
dissolve it completely and make volume up to the mark with the same solvent. (Stock
solution).
Further pipette 1.5 ml of the above stock solutions into a 10ml volumetric flask and dilute up
to the mark with diluent.
Procedure
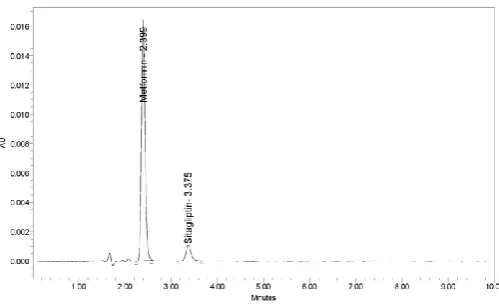
Inject 20 L of the standard, sample into the chromatographic system and measure the areas
[image:4.595.171.421.326.479.2]for Metformin and Sitagliptin peaks and calculate the %Assay by using the formulae.
Fig 2: Chromatogram of Standard solution 1. Met (Rt 2.39), 2.Sit (Rt 3.37) at 210 nm.
Pharmaceutical Sample Solution (from Formulation)
Sample Solution Preparation
Accurately weigh and transfer 100 mg of Metformin and 10 mg of Sitagliptin working
standard into a 10 ml clean dry volumetric flask add about 7 mL of Diluent and sonicate to
dissolve it completely and make volume up to the mark with the same solvent. (Stock
solution).
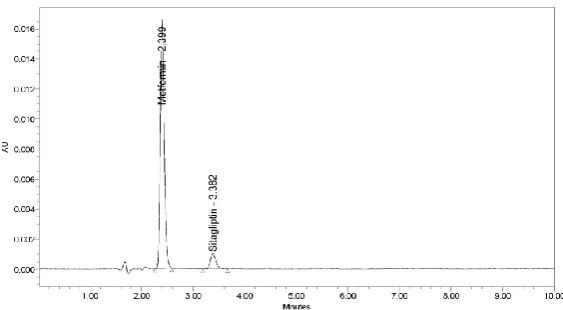
Further pipette 1.5 ml of the above stock solutions into a 10ml volumetric flask and dilute up
Fig 3: Chromatogram of Sample solution 1.Met (Rt 2.39), 2.Sit (Rt 3.38)
2.6. Recovery studies
To check the accuracy of sample by the developed methods and to study the interference of
formulation additives, analytical recovery experiments were carried out by standard addition
method at 50, 100 and 150% level. From the total amount of drug found, the percentage
recovery was calculated. The results are reported in Table.
Analysis Data of Formulation
PARAMETER HPLC
MET SIT
Label claim (mg) 500 50
Drug found 500.43 50.05
% Accuracy 98-102%
RESULTS AND DISCUSSION
HPLC
Preparation of Calibration Curves by HPLC
In a series of 10 ml volumetric flask several dilutions of MET (500-2500 µg/ml) and SIT
(50-250 µg/ml) were prepared using mobile phase as solvent. Each solution was injected into
HPLC system and the chromatograms were recorded. The peak areas of both drugs were
calculated and the respective calibration curves were plotted against ratio of area under curve
and concentration of drug.
HPLC Method Validation
As per the ICH guidelines, the method validation parameters checked were linearity,
accuracy, Specificity, precision, limit of detection, limit of quantitation.
1. LINEARITY
The linearity of the proposed HPLC method for determination of Metformin and Sitagliptin
was evaluated by analysing a series of different concentrations of standard drug. In this study
five concentrations were chosen, ranging between 50-250 µgml-1 of Sitagliptin and 50-2500
µgml-1 of Metformin. Each concentration was repeated three times. The linearity of the
calibration graphs was validated by the high value of correlation coefficient, slope and the
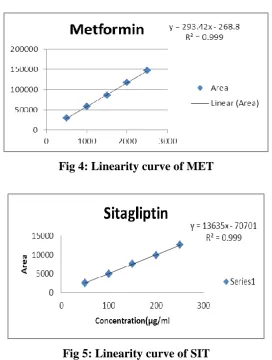
intercept value. A linear relationship was obtained for Metformin in the range of
[image:6.595.161.434.315.676.2]50-2500 µgml-1 and Sitagliptin in the range of 50-250 µgml-1 respectively
Fig 4: Linearity curve of MET
Fig 5: Linearity curve of SIT
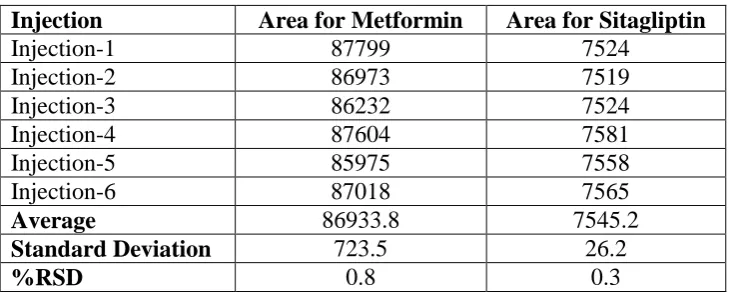
Precision
Precision of the analytical method was studied by analysis of multiple sampling of
Precision was demonstrated by repeatability and intermediate precision measurements of
peak area and peak symmetry parameters of HPLC method for each title ingredients. The
repeatability (within-day in triplicates) and intermediate precision (for 2 days) were carried
out at five concentration levels for each compound. Triplicate injections were made and the
obtained results within and between the days of trials were in acceptable range. The value of
%RSD for MET and SIT were found to be less than 2 indicates that the developed method is
[image:7.595.116.481.249.398.2]precise.
Table 1: Precision Results for Metformin and Sitagliptin
Injection Area for Metformin Area for Sitagliptin
Injection-1 87799 7524
Injection-2 86973 7519
Injection-3 86232 7524
Injection-4 87604 7581
Injection-5 85975 7558
Injection-6 87018 7565
Average 86933.8 7545.2
Standard Deviation 723.5 26.2
%RSD 0.8 0.3
Accuracy
Accuracy of an analytical method is the closeness of test results obtained by that method to
the true value. The accuracy of an analytical method should be established across its linearity
range. Accuracy was performed in three different levels, each level in triplicate for MET and
SIT using standards at 50%, 100% and 150%. Each sample was analysed in triplicate for each
level.
The mean recoveries were found in the range of 98 – 102%, by which we can say the method
was accurate.
Table 2: The accuracy results for Metformin
%Concentration (at specification
Level)
Area Amount Added
(mg)
Amount Found
(mg) % Recovery
Mean Recovery
50% 43148.6 50 50.04 100.08
100.43
100% 86625.0 100 100.46 100.46
Table 3: The accuracy results for Sitagliptin
%Concentration (at specification
Level)
Area
Amount Added
(mg)
Amount Found
(mg)
% Recovery Mean
Recovery
50% 3818.7 5 5.04 100.75
100.50
100% 7587 10 10.01 100.08
150% 11447 15 15.10 100.67
Limit of Detection (LOD) and Limit of Quantitation (LOQ)
It is calculated according to ICH recommendations where the approach is based on the
signal-to-noise ratio. Chromatogram signals obtained with known low concentrations of analytes
were compared with the signals of blank samples. A signal-to-noise ratio 3:1 and 10:1 was
considered for calculating LOD and LOQ respectively.
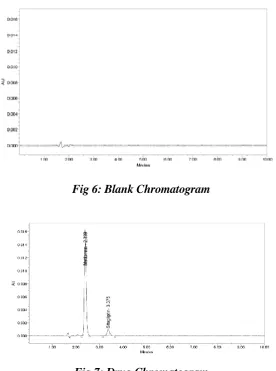
Specifity
Volume of 20 μL of working placebo sample solution was injected into the chromatograph and
the chromatogram was recorded and presented below.
Fig 6: Blank Chromatogram
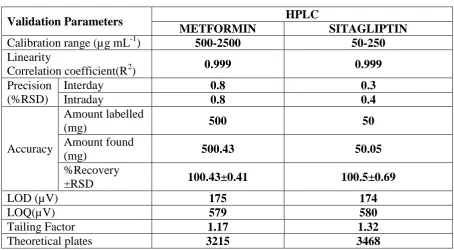
[image:8.595.156.433.381.753.2]Table 2: Validation Parameters
Validation Parameters HPLC
METFORMIN SITAGLIPTIN
Calibration range (µg mL-1) 500-2500 50-250
Linearity
Correlation coefficient(R2) 0.999 0.999
Precision (%RSD)
Interday 0.8 0.3
Intraday 0.8 0.4
Accuracy
Amount labelled
(mg) 500 50
Amount found
(mg) 500.43 50.05
%Recovery
±RSD 100.43±0.41 100.5±0.69
LOD (µV) 175 174
LOQ(µV) 579 580
Tailing Factor 1.17 1.32
Theoretical plates 3215 3468
CONCLUSION
The methods described for simultaneous estimation of Metformin and Sitagliptin are found to
be simple, sensitive, accurate, precise, rapid and economical. Hence method could be
successfully employed for routine analysis of Metformin and Sitagliptin in their combined
dosage form.
ACKNOWLEDGEMENTS
Derex labs Pvt Ltd, Hyb., for providing the gift samples of Metformin and Sitagliptin and
also for providing facilities to carry out the research work.
REFERENCES
1. The Merk Index, an encyclopedia of chemicals, drugs and biological. 14th ed. NJ; 2006.
2. Indian Pharmacopoeia (1996) vol I, 4th edn. Government of India, The controller of
publications, New Delhi.
3. https://en.wikipedia.org/wiki/Metformin.
4. https://en.wikipedia.org/wiki/Sitagliptin.
5. Pulla Ravi Pratap, Sastry B.S, Prasad Y. Rajendra, Raju N. Simultaneous Estimation of
Metformin HCl and Sitagliptin Phosphate in Tablet Dosage Forms by RP-HPLC. Res J
6. Anil Dubala, Rizwanbasha Khatwal, Jayasankar Kosaraju, Venkat Meda. Bioanalytical
Method Development And Validation Of Sitagliptin Phosphate By Rp-Hplc And Its
Application To Pharmacokinetic Study. Int J Pharm Pharm Sci., 2012; 4(2): 691-4.
7. Chellu S, N. Malleswararao, Mulukutla V. Suryanarayana and Khagga Mukkanti.
Simultaneous Determination of Sitagliptin Phosphate Monohydrate and Metformin
Hydrochloride in Tablets by a Validated UPLC Method. Sci. Pharm. 2012; 80(1): 139-52.
8. John G. Swales, Richard T. Gallagher, Mark Denn, Raimund M. Peter. Simultaneous
quantitation of Metformin and Sitagliptin from mouse and human dried blood spots using
laser diode thermal desorption tandem mass spectrometry. J Pharmaceut Biomed 2011;
55(3): 544-551.
9. Yaraveda Lathareddy, Naidu Srinivasa Rao. Stability-Indicating Rp-Hplc Method and Its
Validation for Analysis of Metformin & Sitagliptin in Bulk and Pharmaceutical Dosage
Form. W J Pharm Pharm sci. 2013; 2(5): 3691-3709.
10.Ramalingam Peraman, Chandra Sekhar Gowra, Y. Padmanabha Reddy, Krishna Karthik
Peruru. Stability-Indicating RP-HPLC Method for Simultaneous Determination of
Metformin Hydrochloride and Sitagliptin Phosphate in Dosage Forms. Chromatographia
2013; 76(17): 1153–1162.
11.Narendra Nyola, Govinda Samy Jeyabalan. Method Development of Simultaneous
Estimation of Sitagliptin and Metformin Hydrochloride in Pure and Tablet Dosage Form
by UV-Vis Spectroscopy. W J Pharm Pharm sci 2012; 1(4): 1392-1401.
12.Mohamed Salim, Nahed El-Enany, Fathallah Belal, Mohamed Walash and Gabor
Patonay. Simultaneous Determination of Sitagliptin and Metformin in Pharmaceutical
Preparations by Capillary Zone Electrophoresis and its Application to Human Plasma