www.wjpr.net Vol 4, Issue 05, 2015.
2665
DEVELOPMENT AND VALIDATION OF UV
SPECTROPHOTOMETRIC AREA UNDER CURVE METHOD FOR
QUANTITATIVE ESTIMATION OF RANOLAZINE IN API AND
TABLET FORMULATION
Jayprakash B. Ugale* and Sugandha V. Mulgund
Department Quality Assurance Techniques, STES’s, Sinhgad College of Pharmacy, Vadgaon
(Bk.), Sinhgad Road, Pune - 411041, Maharashtra, India.
ABSTRACT
The aim of present work was to develop an accurate, precise,
reproducible and economical UV spectrophotometric Area Under
Curve method for estimation of Ranolazine. This Area Under Curve
method of UV spectrum between 261 to 281 nm was validated as per
ICH guideline Q2 (R1). The method has followed linearity in the range
of 75-200 μg/ml. The value of correlation coefficient was 0.998.
Satisfactory values of Percent relative standard deviation for the
intra-day and inter-intra-day precision studies indicated that method is precise.
Results of the recovery studies (99.42% to 99.97%) showed accuracy
of the method. LOD and LOQ were calculated as 10.77 μg/ml and
32.63 μg/ml, respectively. The developed method can be used for
routine estimation of Ranolazinein bulk and tablet formulation.
KEYWORDS: Area Under Curve, Ranolazine, UV
spectrophotometry, Quantitative estimation.
INTRODUCTION
Ranolazine is an Antianginal drug and chemically it is a Piperazine derivative. Structurally it
is N-(2,6- dimethylphenyl)-2-[4-[2-hydroxy-3-(2-Methoxyphenoxy)propyl]piperazin-1yl]
acetamide.[1] Ranolazine is believed to have its effects via altering the trans-cellular late
sodium current. It is by altering the intracellular sodium level that Ranolazine affects the
sodium-dependent calcium channels during myocardial ischemia. Thus, Ranolazine indirectly
prevents the calcium overload that causes cardiac ischemia. Ranolazine is indicated for the
treatment of chronic angina. Ranolazine may be used with beta blockers, nitrates, calcium
Volume 4, Issue 5, 2665-2672. Research Article ISSN 2277– 7105
Article Received on 16 March 2015,
Revised on 07 April 2015, Accepted on 01 May 2015
*Correspondence for
Author
Jayprakash B. Ugale
Department Quality
Assurance Techniques, STES’s, Sinhgad College of Pharmacy, Vadgaon
(Bk.), Sinhgad Road, Pune
- 411041, Maharashtra,
www.wjpr.net Vol 4, Issue 05, 2015.
2666
channel blockers, antiplatelet therapy, lipid-lowering therapy, ACE inhibitors, and
angiotensin receptor blockers. Literature survey revealed that some methods have been
developed for the determination by spectrophotometry[2,3,4] and HPLC[5,6], however no
method was found for the Ranolazine by Area Under Curve UV spectrophotometry using
water as a solvent. Earlier reported methods were Performed by using methanol which is a
expensive solvent. The purpose of this work was to develop a simple, accurate, precise,
reproducible and economical UV spectrophotometric Area Under Curve method for
[image:2.595.139.456.255.353.2]estimation of Ranolazine.
Figure 1: Chemical Structure of Ranolazine
MATERIALS AND METHODS
INSTRUMENTATION AND APPARATUS
Shimadzu UV 1800 with UV Prob Software, was employed for this work. Single pan
electronic balance (Shimadzu, ATY 224) was used for weighing purpose. Sonication of the
solutions was carried out using an Ultrasonicator (Spectra lab UCB 40, India). Calibrated
volumetric glasswares (Borosil®) were used in this study.
MATERIALS
Active pharmaceutical ingredient (API) of Ranolazine was gifted by M. J. Biopharm Pvt. Ltd.
Navi Mumbai, India. Commercially available tablets RANCAD® containing 500 mg of Ranolazine was procured from local pharmacy. Methanol (AR) was purchased from Merck
India Ltd., Mumbai, India
METHOD DEVELOPMENT Preparation of standard solution
The standard stock solution of Ranolazine was prepared by transferring, accurately weighed,
100 mg of API to100 ml of volumetric flask. The drug was dissolved with sonication in 10 ml
www.wjpr.net Vol 4, Issue 05, 2015.
2667
solution (1000 μg/ml) was further diluted with distilled water to obtain the concentration of
100 μg/ml.
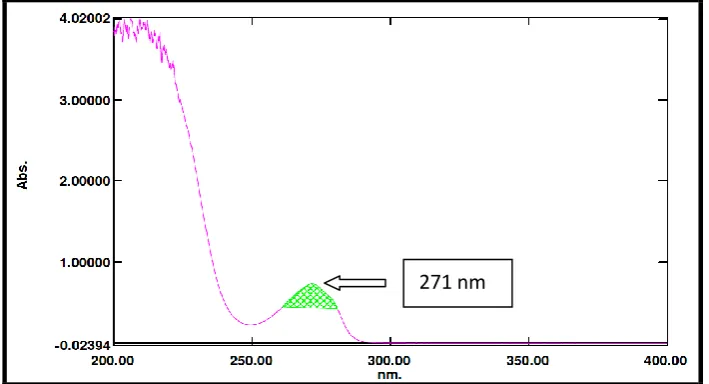
Selection of wavelength range
The standard solution of 100 μg/ml was scanned between 400 nm to 200 nm in UV
spectrophotometer against distilled water as blank after baseline correction. Wavelength
range was selected around wavelength maxima (271nm). Different working standards were
prepared in the concentration from 75-200 μg/ml. Various wavelength range were tried and
final range between 261-281 nm was selected on the basis of linear relationship between area
[image:3.595.121.476.287.479.2]and corresponding concentration (Figure- 2).
Figure 2: Area Under Curve graph of 100 μg/ml Ranolazine solution
Area under curve (Area calculation)
This method involves calculation of integrated value of absorbance with respect to
wavelength in indicated range. Area calculation processing item calculates the area bounded
by the curve and horizontal axis. Here horizontal axis represents baseline.
Area calculation (α+β) =
Whereas, α is area of portion bounded by curve data and a straight line connecting the start and end point, β is area of portion bounded by a straight line connecting the start and end point on curve data and horizontal axis, λ1 and λ2 are wavelengths representing start and end
point of curve region. In this study area was integrated between wavelength ranges from 261
to 281 nm.
www.wjpr.net Vol 4, Issue 05, 2015.
2668 Preparation of calibration curve
Solutions for calibration curve were prepared from standard stock solution of 1000 μg/ml, by
further dilution with distilled water to obtain the concentrations of 75, 100, 125, 150, 175,
and 200 μg/ml, respectively. These solutions were scanned from 400 to 200 nm and Area
Under Curve (AUC) was integrated in the range of 261-281 nm. The calibration curve was
[image:4.595.124.473.208.415.2]plotted between Area under curve against concentration (Figure- 3).
Figure 3: Calibration curve of Ranolazine
METHOD VALIDATION
The objective of validation of an analytical procedure is to demonstrate whether the
procedure is suitable for its intended purpose. The proposed method was validated for various
parameters such as Linearity & Range, Precision, Accuracy, Limit of detection (LOD) and
Limit of Quantitation (LOQ) according to ICH Q2 (R1) guideline.[7]
Linearity and Range
The linearity was determined by using working standard solutions between 75-200 μg/ml.
The spectrums of these solutions were recorded and area under curve was integrated in
wavelength range 261-281 nm. Calibration curve of Area under curve v/s concentration was
plotted after suitable calculation and simple linear regression was performed (Figure 3).
Regression equation and correlation coefficient were obtained. The range of solution has
www.wjpr.net Vol 4, Issue 05, 2015.
2669 Table1 1. Linearity and range of Ranolazine.
Concentration μg/ml Area Under Curve
75 2.195
100 2.8345
125 3.5998
150 4.2143
175 5.067
200 5.6702
Method Precision Repeatability
The precision of the method was checked by repeatedly analyzing (n= 6) standard solutions
of Ranolazine (25μg/ml). Area under curve of each of these solutions was measured in the
range of 261-281 nm. Relative standard deviation (% RSD) was calculated.
Reproducibility
The intra-day and inter-day precision of the proposed method was determined by analyzing
the corresponding responses 3 times on the same day and on 3 different days over a period of
1 week for 3 different dilutions (125, 150 and 175 μg/ml) of Ranolazine. The results were
reported in terms of percentage relative standard deviation (%RSD). The results are tabulated
in Table 2.
Table 2. Intraday and Interday precision study of Ranolazine
Drug Concentration μg/ml % RSD
*
Intra-day Inter-day
Ranolazine
125 0.39 0.69
150 0.089 0.085
175 0.17 0.5
*n=3
Limit of Detection (LOD) and Limit of Quantitation (LOQ)
Five sets of known concentrations of 75-200 μg/ml were prepared. Calibration curves were
plotted for each set. LOD= 3.3 * SD/S and LOQ= 10 * SD/S were calculated.
Where, SD is standard deviation of y-intercept of the calibration curves and S is mean slope
of five calibration curves.
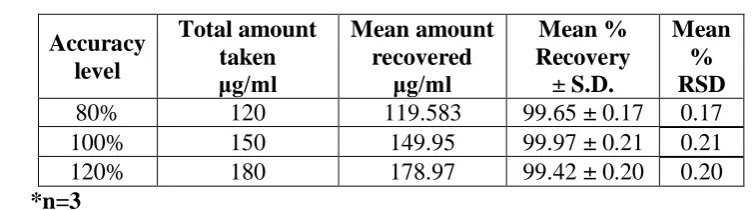
Accuracy
The accuracy for the analytical procedure was determined at 80%, 100% and 120% levels of
www.wjpr.net Vol 4, Issue 05, 2015.
2670
expressed in terms of % recoveries. Three determinations were performed at each level and
[image:6.595.102.480.141.246.2]% RSD was calculated. The results are tabulated in Table 3.
Table 3. Recovery studies for AUC method Accuracy
level
Total amount taken μg/ml
Mean amount recovered
μg/ml
Mean % Recovery
± S.D.
Mean % RSD
80% 120 119.583 99.65 ± 0.17 0.17
100% 150 149.95 99.97 ± 0.21 0.21
120% 180 178.97 99.42 ± 0.20 0.20
*n=3
ASSAY OF TABLET FORMULATION
Twenty tablets were weighed and average weight was calculated. These tablets were crushed
and powdered in a glass mortar. The tablet powder equivalent to 100 mg of Ranolazine was
accurately weighed, and transferred to a 100 ml volumetric flask containing 10 ml of
methanol and then diluted up to mark with distilled water. The solution was filtered with
Whatmann filter paper No. 41 and the first few ml of filtrate was discarded. This solution was
further diluted to obtain 100 μg/ml solution with same solvent and subjected for UV analysis.
This procedure was repeated in triplicate.
RESULTS AND DISCUSSION
An attempt was made to develop a simple and specific AUC spectrophotometric method for
the determination of Ranolazine in tablet dosage form. The generated regression equation
was 0.0282x + 0.0506 (R2= 0.998), where, is area under curve between
261 to 281 nm, ‘x’ is the concentration and R is correlation coefficient. The R2 value as 0.998
indicates that developed method was linear. The proposed method was found to be precise as
% R.S.D values for intraday as well as for interday precision were satisfactory. The drug at
each of the 80%, 100% and 120% levels showed good recoveries. Hence, it can be said that
this method was accurate. The LOD and LOQ were calculated as 10.77 μg/ml and 32.63 μg/ml, respectively. The result of the analysis of tablet formulation by the developed method
was consistent with the label claim, highly reproducible and reliable. The method can be used
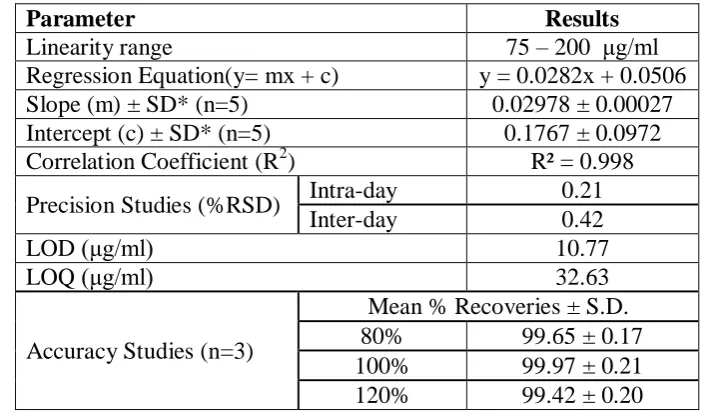
for the routine analysis of the Ranolazine in tablet dosage form. The validation parameters
www.wjpr.net Vol 4, Issue 05, 2015.
[image:7.595.119.473.91.301.2]2671 Table 4. Summary of Validation parameters.
Parameter Results
Linearity range 75 – 200 μg/ml
Regression Equation(y= mx + c) y = 0.0282x + 0.0506
Slope (m) ± SD* (n=5) 0.02978 ± 0.00027
Intercept (c) ± SD* (n=5) 0.1767 ± 0.0972
Correlation Coefficient (R2) R² = 0.998
Precision Studies (%RSD) Intra-day 0.21
Inter-day 0.42
LOD (μg/ml) 10.77
LOQ (μg/ml) 32.63
Accuracy Studies (n=3)
Mean % Recoveries ± S.D.
80% 99.65 ± 0.17
100% 99.97 ± 0.21
120% 99.42 ± 0.20
CONCLUSION
The proposed spectrophotometric method was found to be simple, sensitive, accurate and
precise for determination of Ranolazine in API and Tablet formulation. The method utilizes
easily available and cheap solvent for analysis hence the method was also economic for
estimation of Ranolazine in API and tablet formulation. The common excipients and other
additives are usually present in the tablet formulation do not interfere in the analysis of
Ranolazine in method, hence it can be conveniently adopted for routine analysis of the drugs
in tablet formulation.
ACKNOWLEDGEMENT
The authors are grateful to M. J. Biopharm Pvt. Ltd. Navi Mumbai, India for providing API
of Ranolazine as a gift sample and Principal, Sinhgad College of Pharmacy, Vadgaon (Bk.),
Pune for providing necessary facilities to complete this work.
REFERENCES
1. Drug Bank of Ranolazine, http://www.drugbank.ca/drugs/DB00243.
2. Naveen Kumar GS, Harish KH, Dinesh M and Joshi H, Spectrophotometric method for
the estimation of Ranolazine in bulk and pharmaceutical formulations, Unique Research
Journal of Chemistry, 2014; 02(01): 5-7.
3. Sharma A, Prakash D, Singh SK. Development and Validation of UV Spectrophotometric
Method for the Estimation of Ranolazine in Bulk Drug and Pharmaceutical Formulation,
www.wjpr.net Vol 4, Issue 05, 2015.
2672
4. Ramesh J, Rajasekhar K, Gandhi KR and Senthil KN. Method development and
validation for the estimation of Ranolazine in bulk and in pharmaceutical dosage form by
UV spectrophotometry, Annals of Pharma Research., 1956; 2347: 4-7.
5. Patel RC, Rathod DK, Patel PR, Patel VS. Estimation Of Ranolazine Hydrocholide By
Spectrophotometric And RP-HPLC In Tablet Dosage Forms, International Journal of
Pharmaceutical and Applied Sciences., 2010; 1(2): 79-83.
6. Sowmya PS, Nirupama D, Nuthalapati M, Thangabalan B. Development and validation
of HPLC and UV methods for estimation of Ranolazine in bulk and marketed
formulation, International Journal of Innovative pharmaceutical sciences and research.,
2014; 2(5): 1042-1058.
7. ICH Harmonized-Tripartite Guidelines. Validation of Analytical Procedure: Text and