STABILITY INDICATING ASSAY PROCEDURE FOR METHOD
DEVELOPMENT AND VALIDATION OF CEFDINIR IN ITS TABLET
DOASGE FORM BY USING RP-HPLC
1
Seema Firdouse*, 2Parwez Alam, 3Abdul Mutalib, 4Farhin Begum, 5Asra Sultana,
6
Nishath Kulsum
1*
Department of Pharmaceutical Analysis and Quality Assurance Anwarul Uloom College of
Pharmacy, New Mallepally, Hyderabad, Telengana 500001, India.
2
Shadan College of Pharmacy, Peerancheru, Hyderabad, Telengana 500001, India.
3
Anwarul Uloom College of Pharmacy, New Mallepally, Hyderabad, Andhra Pradesh
500001, India.
4,5,6
Anwarul Uloom College of Pharmacy, New Mallepally, Hyderabad, Telengana 500001,
India.
ABSTRACT
A rapid and precise, linear, specific and suitable Reverse Phase High
Performance Liquid Chromatographic method has been developed for
the estimation of Cefdinir in its tablet dosage form. Chromatography
was carried out on a Develosil C18 (4.6 × 150mm, 5 µm) column using
a mixture of ACN and phosphate buffer (pH 3, adjusted with ortho
phosphoric acid) in the ratio of 40:60 as the mobile phase at a flow rate
of 1.0ml/min, the detection was carried out at 254 nm. The retention
time of Cefdinir was 6.31 min respectively. The method produced
linear responses in the concentration range of 0-25 µg/ml. The method
of precision for the determination of assay was below 2.0% RSD. The
method is useful in the quality control of bulk and other
pharmaceutical formulations.
KEYWORDS: Cefdinir, RP-HPLC, Stability indicating Studies, Validation, Tablet dosage form.
Volume 5, Issue 1, 1342-1349. Research Article ISSN 2277– 7105
Article Received on 16 Nov 2015,
Revised on 07 Dec 2015, Accepted on 27 Dec 2015
*Correspondence for Author
Seema Firdouse
Department of
INTRODUCTION
The term ‘chromatography’ covers those processes aimed at the separation of the various
species of a mixture on the basis of their distribution characteristics between a stationary and
a mobile phase.[1]
Cefdinir is chemically
(6R,7R)-7-[(2Z)-2-(2-amino-1,3-thiazol-4-yl)-2-(N-hydroxyimino)acetamido]-3-ethenyl-8-oxo-5-thia-1-azabicyclo[4.2.0]oct-2-ene-2-carboxylic
acid belongs to the class of organic compounds known as cephalosporins. Cefdinir is a
semi-synthetic, broad-spectrum antibiotic in the third generation of the cephalosporin class, proven
effective for common bacterial infections of the ear, sinus, throat and skin.
It used for the treatment of the respiratory, skin, soft tissue and ENT infections caused by H.
influenzae (including b-lactamase producing strains), H. parainfluenzae (including
b-lactamase producing strains), S. pneumoniae (penicillin-susceptible strains), S. pyogenes, S.
aureus (including b-lactamase producing strains) and M. catarrhalis. The chemical formula
cefdinir is C14H13N5O5S2. It is sparingly soluble in in Methanol, freely Soluble in Ethanol and
Acetonitrile. The chemical structure of Cefdinir is following on Figure – 1and literature
survey revealed that numerous methods have been reported for estimation of Cefdinir in
pharmaceutical formulations has been reported. The main objective of the work was to
develop simple, fast, inexpensive, sensitive and accurate methods which could be applied to
analyse Cefdinir in pure form and in other pharmaceutical dosage form.[2]
Fig.01: Chemical Structure of Cefdinir.
MATERIAL AND METHODS Reagents and Materials
Acetonitrile (ACN), Phosphate Buffer. The HPLC system employed was HITACHI L2130
with D Elite 2000 software with Isocratic with UV-Visible Detector (L-2400).
Preparation of Standard solution
Accurately weighed around 25 mg of cefdinir working standard, taken in to a 25 ml
volumetric flask, then dissolved and diluted to volume with the mobile phase to obtain a
solution having a known concentration of about 1000mcg/ml.
Further dilutions has been made to get the final concentration of 10 µg/ml.
Preparation of Test Solution
Diluted quantitatively an accurately measured volume of label claim solution with diluents to
obtain a solution containing about a linear range.
Chromatographic Condition
Prepare a mixture of 600ml (60%) of Buffer and 400ml of Acetonitrile (40%) sonicated to
degasse and the solvents were pumped from the solvent reservoir in the ratio of Buffer,
Acetonitrile pH 3 (60:40 v/v) in to the column. The flow rate of mobile phase was maintained
at 1.0 ml/minute and the detection wavelength was set at 254 nm with a run time of 10
minutes. The volume of injection loop was 20 µl prior to injection of the drug solution. The
column was equilibrated for at least 25min with the mobile phase flowing through the
system. The column and whole system kept in ambient temperature.
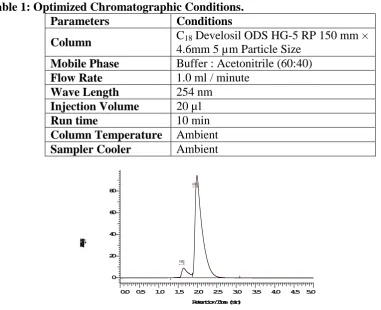
Table 1: Optimized Chromatographic Conditions.
Parameters Conditions
Column C18 Develosil ODS HG-5 RP 150 mm × 4.6mm 5 µm Particle Size
Mobile Phase Buffer : Acetonitrile (60:40) Flow Rate 1.0 ml / minute
Wave Length 254 nm
Injection Volume 20 µl
Run time 10 min
Column Temperature Ambient Sampler Cooler Ambient
1.64
1.99
0.0 0.5 1.0 1.5 2.0 2.5 3.0 3.5 4.0 4.5 5.0 RetentionTime(min)
0 20 40 60 80
Intensity
[image:3.595.87.469.438.748.2](mV)
Method of validation[3]
The method was validated for accuracy, Precision, linearity, Specificity, limit of detection,
limit of quantization and robustness by following procedures.
Accuracy
To determine the accuracy of the proposed method, recovery studies were carried out by
adding different amounts (80%, 100% and 120%) of pure drug of Cefdinir were taken and
added to the pre-analyzed formulation of concentration 10 µg/ml. From that percentage
[image:4.595.161.437.616.746.2]recovery values were established. The results were shown in table no.2.
Table 2: Accuracy readings of cefdinir.
Sample ID Concentration (µg/ml) % Recovery of Pure
Drug Statistical Anlysis Pure Drug Formulation
S1 : 80 % 8 10 99.18 Mean = 98.97 %
S.D. = 0.200083 %RSD = 0.202152
S2 : 80 % 8 10 98.78
S3 : 80 % 8 10 98.97
S4 : 100 % 10 10 99.87 Mean = 99.54 %
S.D. = 0.33 %RSD = 0.3315
S5 : 100 % 10 10 99.54
S6 : 100 % 10 10 99.21
S7 : 120 % 12 10 99.32 Mean = 99.567%
S.D. = 0.33% RSD = 0.331159
S8 : 120 % 12 10 99.65
S9 : 120 % 12 10 99.98
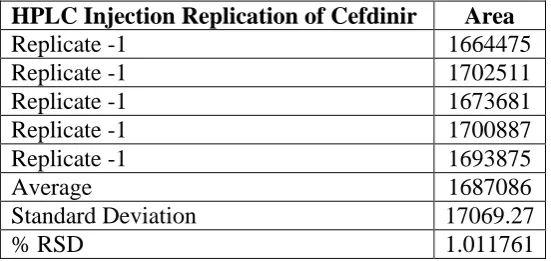
Precision Repeatibiliy
The precision of each method was ascertained separately from the peak areas & retention
times obtained by actual determination of five replicates of a fixed amount of drug. Cefdinir
(API). The percent relative standard deviation were calculated for cefdinir are presented in
the table no 3.
Table 3: Repeatability.
HPLC Injection Replication of Cefdinir Area
Replicate -1 1664475
Replicate -1 1702511
Replicate -1 1673681
Replicate -1 1700887
Replicate -1 1693875
Average 1687086
Standard Deviation 17069.27
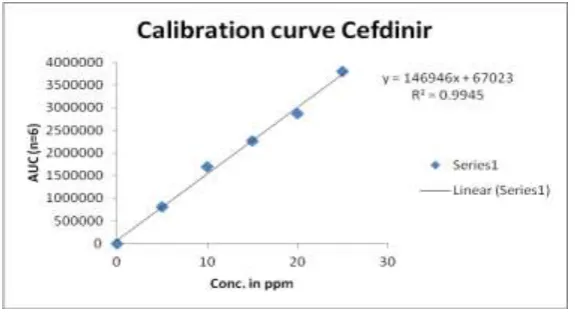
Linearity & Range Caliberation Curve
The calibration Curve showed good linearity in the range of 0-25 µg/ml, for Cefdinir (API)
with correlation coefficient (r2) of 0.994 (Fig 3). Atypical calibration curve has the regression
[image:5.595.155.443.188.345.2]equation of Y = 14694 + 67023 for cefdinir.
Fig 3: Calibration curve for cefdinir.
Stability
In order to determine the stability of both standard and sample solutions during analysis both
the solutions were analyzed over a period of 8 hours at room temperature.
Robustness
Influence of all changes in chromatographic conditions such as change in flow rate (± 0.1
ml/min), Temperature (± 2oC), wave length of detection (±2nm) & acetonitrile content in
mobile phase (± 2%) studied to determine the robustness of the method are also in favor to
develop RP- HPLC method for the analysis of Cefdinir (API).
Table 4: Robustness test.
Change in Parameter % RSD
Flow (1.1 ml/min) 0.02
Flow (0.9 ml /min) 0.08 Temperature (270C) 0.04 Temperature (230C) 0.16 Wavelength of detection (206 nm) 0.05 Wavelength of detection (204 nm) 0.07
RESULTS AND DISCUSSION
The mixture of Acetonitrile and phosphate buffer was selected as mobile phase and the effect
time and the stability of peak asymmetry were observed in the ratio of Develosil C 18 (4.6 ×
150mm, 5 µm) with mobile phase comprising of buffer (pH 3, adjusted with ortho phosphoric
acid) in the ratio of 40:60 v/v, at the flow rate 1 ml/min. The detection was carried out at
254 nm. The retention time of cefdinir was found to be 6.31 min which indicates a good base
line. The caliberation of cefdinir was obtained by plotting the peak area ratio versus the
concentration of cefdinir over the range of 0-25 µg/ml and it was found to be linear with r2 =
0.994. The regression equation of cefdinir concentration over its peak area ratio was found to
be Y = 14694X + 67023 (100%), where X is the concentration of Cefdinir and Y is the
respective peak area. The data of regression analysis of the calibration curve was shown in
figure no 3. The RSD values for accuracy and precision studies obtained were less than 2%
which revealed that developed method was accurate and precise. The system suitability and
validation parameters were given in table 3. The high percentage of recovery of cefdinir was
found to 99.98% indicates that the proposed method is highly accurate. The absence of
additional peaks indicates no interference of the recipients used in the tablets.
FORCED DEGRADATION STUDIES ACID HYDROLYSIS
An accurately weighed 10mg of pure drug was transferred to a clean and dry 10ml volumetric
flask. To which 0.1N HCL was added and make up to the mark and kept for 24 hrs, from that
0.1 ml was taken in to a 10ml volumetric flask and mark with mobile phase, then injected in
to the HPLC system against a blank of HCL (After all optimized parameters).
0.53 0.85 1.70 2.11 4.94
6.31
0 1 2 3 4 5 6 7 8 9 10
RetentionTime(min)
0 5
10
15
20
25
30
Intensity
[image:6.595.117.443.515.721.2](mV)
BASIC HYDROLYSIS
An accurately weighed 10 mg of pure drug was transferred to a clean and dry 10 ml
volumetric flask. To which 0.1 N NaOH was added and make up to the mark and kept for 24
hrs from that 0.1 ml was taken in to a 10ml volumetric flask and make up to the mark with
mobile phase, then injected in to HPLC system against a blank of NaOH (after all optimized
conditions).
0.55 0.85 1.64 2.07 2.21 2.75 3.77 4.86
6.28
0 1 2 3 4 5 6 7 8 9 10
RetentionTime(min) 0
10 20 30 40 50 60 70
Intensity
[image:7.595.139.424.208.387.2](mV)
Fig 5: Basic hydrolysis.
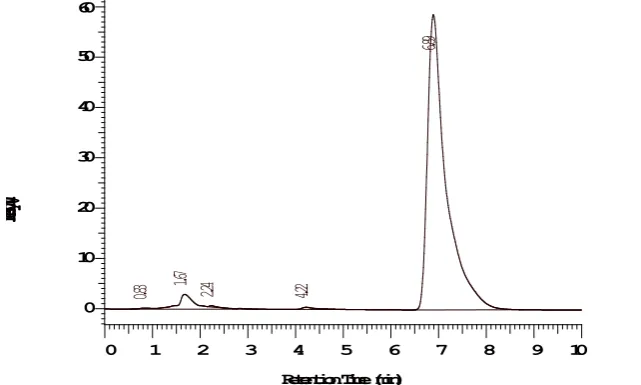
OXIDATION WITH (3%) H2O2
An accurately weighed 25 mg of pure drug was transferred to a clean and dry 25ml
volumetric flask. To which 3% H2O2 was added and make up to the mark and kept for 24 hrs
from that 0.2ml was taken in to a 10 ml volumetric flask and make up to the mark with
diluents then injected for HPLC analysis.
0.83 1.67 2.24 4.22
6.89
0 1 2 3 4 5 6 7 8 9 10
RetentionTime(min) 0
10 20 30 40 50 60
Intensity
(mV)
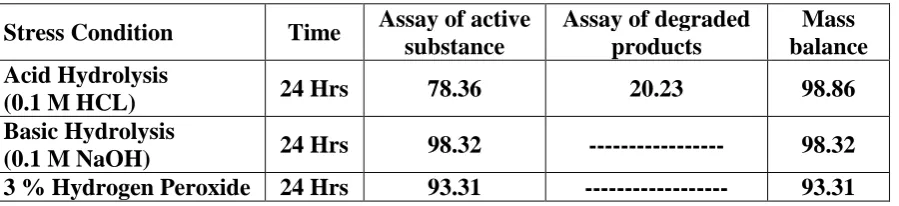
[image:7.595.134.455.549.741.2]Table 5: Results of forced degradation Studies.
Stress Condition Time Assay of active substance
Assay of degraded products
Mass balance Acid Hydrolysis
(0.1 M HCL) 24 Hrs 78.36 20.23 98.86
Basic Hydrolysis
(0.1 M NaOH) 24 Hrs 98.32 --- 98.32 3 % Hydrogen Peroxide 24 Hrs 93.31 --- 93.31
CONCLUSION
A sensitive and selective RP- HPLC method has been developed and validated for the
analysis of Cefdinir API.
The solvent system used in this method was economical. The results expressed in tables for
RP-HPLC method was promising, The RP-HPLC method is more sensitive, accurate and
precise compared to Spectrophotometric methods.
Further the proposed RP-HPLC method has excellent sensitivity, Precision and
reproducibility.
REFRENCES
1. Sethi P.D., HPLC Quantitative Analysis Pharmaceutical Formulations, CBS Publishers
and distributors, New Delhi, 2001; 7-22, 38-43, 94-105.
2. Snyder R, Kirkland J, Glajch L, Practical HPLC Method Development, john Wiley and
sons International publication, II Edn., 2011.
3. Ashutoshkar S, Pharmaceutical Drug Analysis 2nd Edn, New Age International Private
Limited Publishers, 2005; 452-474.
4. Beckett H and Stenlake J.B., Practical Pharmaceutical Chemistry, 4th End., C.B.S.
Publishers and Distributors’, New Delhi., 1-9, 157-167.
5. Drug bank:ilhttp://www.drugbank.ca/Drugs/DB00535.
6. Mashelkar, U.C; Renapurkar,\sanjay D. – A LCMS compatible stability indicating HPLC
[image:8.595.77.527.91.194.2]