DEVELOPMENT AND VALIDATION OF ANALYTICAL METHOD
FOR SIMULTANEOUS ESTIMATION OF GLIBENCLAMIDE AND
METFORMIN HCL IN BULK AND TABLETS USING UV – VISIBLE
SPECTROSCOPY
Bhavika R. Chavhan*, P.B. Patil, S. R. Bavaskar, Dr.S. D. Barhate.
Department of Quality Assurance, Shree Sureshdada Jain Institute of Pharmaceutical
Education and Research, Jamner – 424206.
ABSTRACT
Two simple, precise and economical UV methods have been developed
and validated for the simultaneous estimation of Glibenclamide and
Metformin hydrochloride in bulk and pharmaceutical combined dosage
form. The method employed simultaneous equation method for
analysis using 0.01N NaOH as a solvent. The two wavelengths
226.60nm and 233 nm were selected for estimation of Glibenclamide
and Metformin HCl respectively. Linearity was observed in the
concentration range of 2-10μg/ml for both Glibenclamide and
Metformin HCl respectively. The recovery studies ascertained the
accuracy of the proposed method and the results were validated as per
ICH guidelines. The method can be employed for estimation of
pharmaceutical formulations with no interference from any other
excipients and diluents.
KEYWORDS: Glibenclamide, Metformin HCl, Simultaneous estimation.
INTRODUCTION Glibenclamide
Fig. 1(a): Chemical structure of Glibenclamide.
Volume 4, Issue 11, 1257-1266. Research Article ISSN 2277– 7105
Article Received on 29 Aug 2015,
Revised on 18 Sep 2015, Accepted on 08 Oct 2015
*Correspondence for
Author
Bhavika R. Chavhan
Department of Quality
Assurance, Shree
Sureshdada Jain Institute
of Pharmaceutical
Education and Research,
[image:1.595.172.427.663.743.2]Glibenclamide is 1-[4-[2-(chloro-2-methoxybenzamido)
ethyl]-benzenesulphonyl]-cyclohexylurea, 5-chloro-N-[2[4[[[(cyclohexyl (amino) carbonyl]-amino] sulphonyl] phenyl]
ethyl]-2-methoxy benzamide or 1-[[p-[-2-(5-chloro-oanisamido) ethyl]
phenyl]-sulphonyl-3-cyclohexylurea. A sulphonyl urea derivative is a second generation oral hypoglycemic agent
which is more potent than those of first group1 and is used to assist in the control of mild to
moderately severe type II. diabetes mellitus (adult, maturity-onset) that does not require
insulin, but that can be adequately controlled by diet alone. It is drug of choice for initiating
treatment in noninsulin-dependent diabetes when diet and weight control fails. It stimulates
the secretion and enhances the utilization of insulin by appropriate tissues.
Metformin Hydrochloride
Fig. 1(b): Chemical structure of Metformin HCL.
Metformin chemically N, Ndimethyl imido dicarbonimidic diamide hydrochloride is used as
antidiabitic drug from the biguanide class used in the management of type 2 diabetes. Major
action of metformin lay in increasing glucose transport across the cell membrane in skeletal
muscle. The chemical structure of Glibenclamide and Metformin HCL are shown shown in
fig. 1.(a, b) several assay techniques have been described for quantitative determination of
glibenclamide in biological fluids; these include procedures based on high performance liquid
chromatography (HPLC) fluorometry, radioimmunoassay and gas chromatography. A few
reports deal with the analysis of the drug in these dosage forms; such procedures include:
micellar electrokinetic capillary chromatography 18, RPHPLC19, fluorometry, TLC-UV
spectrophotometry, derivative spectrophotometry, UV spectrophotometry and colorimetry.
Few UV Spectrophotometric methods, HPLC and ion-pair HPLC method have been reported
[image:2.595.170.425.295.440.2]EXPERIMENTAL Instrumentation
UV experimentation was performed on Shimadzu 1800 UV-visible spectrophotometer
equipped with Photo Diode Array (PDA) detector, with 1 cm quartz cell. Citizen Digital
Ultrasonic Cleaner was used for solubility purpose.
Preliminary Solubility Study
Solubility of both drugs was determined at 27 ±1°C. MET (10mg) was added in 10ml
volumetric flask and 10ml 0.01NAOH was added in it. The clear solution of MET was
obtained. GLB (10mg) was added in 10ml volumetric flask and 10ML 0.01N NAOH was
added in it. Then sonicate it for 10 min and The clear solution of GLB was obtained.
Preparation of stock solution
GLB and MET (10mg) were accurately weighed and transferred to two separate 10 ml
volumetric flasks. Each drug was dissolved in 0.01N NaOH, shaken manually for 10 min and
volume was made up to the mark with the same solvent to obtain concentration 1000 μg/ml
each. Then from that solution pipette out 0.1ml solution & dilute to 10 ml in volumetric flask
with same solvent to obtain final concentration 10µg/ml each.
Study of Spectra and Selection of Wavelength
The aliquot portions of standard stock solutions of GLB and MET were diluted appropriately
with distilled water to obtain concentration 10 g/mL of both drugs. The solutions of both
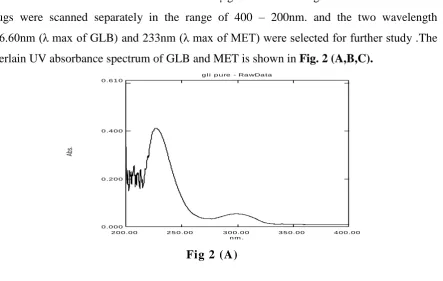
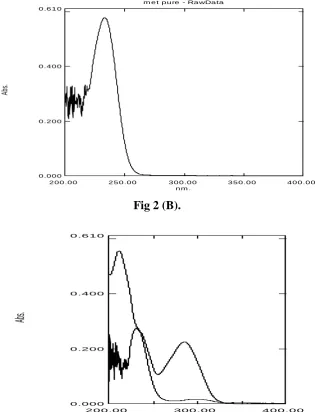
drugs were scanned separately in the range of 400 – 200nm. and the two wavelength
226.60nm (λ max of GLB) and 233nm (λ max of MET) were selected for further study .The
overlain UV absorbance spectrum of GLB and MET is shown in Fig. 2 (A,B,C).
g l i p u re - Ra wDa ta
n m .
2 0 0 .0 0 2 5 0 .0 0 3 0 0 .0 0 3 5 0 .0 0 4 0 0 .0 0
Ab
s.
0 .6 1 0
0 .4 0 0
0 .2 0 0
0 .0 0 0
[image:3.595.85.529.498.779.2]m e t p u re - Ra wDa ta
n m .
2 0 0 .0 0 2 5 0 .0 0 3 0 0 .0 0 3 5 0 .0 0 4 0 0 .0 0
Ab
s.
0 .6 1 0
0 .4 0 0
0 .2 0 0
0 .0 0 0
Fig 2 (B).
n m .
2 0 0 .0 0 3 0 0 .0 0 4 0 0 .0 0
Ab
s.
0 .6 1 0
0 .4 0 0
0 .2 0 0
0 .0 0 0
Fig. 2: UV Spectra of GLB (A), MET (B) and overlain spectra (C) of GLB and MET.
From the overlain spectrum the wavelengths selected for estimation of drugs were 226.60nm
as λ max of GLB and 233nm as λ max of MET.
Study of linearity curves
The aliquot portions of standard stock solutions of GLB and MET were diluted appropriately
with distilled water to get a series of concentration from 2-10g/ml for both drugs. The
absorbance of these drugs was measured at 226 nm and 233 nm respectively and calibration
curves were plotted as concentrations versusabsorbances.
Simultaneous equation method
Two wavelengths selected for the method are 226.60nm and 233 nm that are absorption
[image:4.595.140.456.73.486.2]wavelengths were determined from the calibration curve. Absorptivity (A 1%, 1 cm) values
for both the drugs were determined as mean of three independent determinations.
Concentrations in the sample were obtained by using following equations‐
Cx = (A2ay1‐A1ay2)/ (ax2ay1‐ax1ay2).
Cy = (A1ax2‐A2ax1)/ (ax2ay1‐ax1ay2).
Where, A1 and A2 are absorbances of mixture at 226.60nm and 233nm respectively, ax1 and
ax2 are Absorptivity values of AM at λ1 and λ2 respectively and ay1 and ay2 are Absorptivity value of AT at λ1 and λ2 respectively. Cx and Cy are concentrations of GLB
and MET respectively.
Different aliquots were taken from the stock solutions and diluted with the same solvent to
prepare a series of concentrations. The absorbances of these solutions were measured at
226nm and 233 nm for GLB and MET, respectively and calibration curves were plotted at
selected wavelengths; The E (1%, 1cm) of each drug at both wavelengths was determined;
results are presented in table 2. The overlain spectra of GLB and MET are shown in fig. 2.
Two simultaneous equation (in two variables C1 and C2) were framed by using E (1%, 1cm)
A1 = (60.70) C1 + (84.20) C2 (I).
A2 = (58.20) C1 + (110.20) C2 (II).
Where, C1 and C2 are the concentrations of GLB and MET measured in g /100 ml, in the
sample solutions. A1 and A2 are the absorbances of the sample solutions, at selected
wavelength i.e. 229.5 nm and 237 nm, respectively. By applying the Cramer’s rule (Beckett
and Stenlake, 2005) to equations I and II, the concentrations CGLB and CMET can be
determined as follows:
CGLB = A2 (58.20) - A1 (110.20)/ - 2045.23 (III).
CMET = A1 (84.80) - A2 (60.70) / - 3019.65 (IV).
Table no. 1: E (1%, 1cm) for GLB and MET.
*E(1%, 1cm) at 226 nm ± SD *E(1%, 1cm) at 233 nm ± SD
GLB MET GLB MET
ax1= 60.17 ± 0.48 ay1=84.80 ± 0.21 ax2=58.20 ± 0.60 ay2= 110.20 ± 0.81
Analysis of Marketed Formulation by Proposed Method
20 Tablets were accurately weighed, and reduced to fine powder. A quantity of tablet powder
was transferred to 10ml volumetric flask and 10ml 0.01N NAOH was added in it. Sonicate it
for 11 min. The solution was filtered through Whatman filter paper no. 41. The filtrate was
further diluted with distilled water to get final concentration (1000µg/ml). From this solution
10µg/ml was prepared. The absorbance of sample solution was measured at 226 nm and 233
nm and the results are shown in Table No. 2.
Sample Label Claimed % Label Claim* ± SD %RSD
DAONIL-M
Glibenclamide 5mg 101.17± 0.73 0.72
Metformin HCL500mg 99.96± 0.65 0.67
Validation of Method Accuracy
Accuracy of each of the proposed method was ascertained on the basis of recovery studies
performed by standard addition method as shown in the table no.2.
Table no.3.
*mean of each 3 reading.
Precision
Precision of the analytical method is expressed as the series of the measurement. It was
ascertained by replicate estimation of the drug by the proposed method as shown in table
no.3.
Drug name
Sr. no.
Level (%)
Amt. taken (µg/ml)
Amt. Added (µg/ml)
Absorbance Mean* ± S.D.
Amt. recovered Mean *±S.D.
%Recovery Mean *± S.D.
GLB
1 80 6 4.8 0.321 ± 0.0004 4.22 ± 0.02 87.91± 0.35
2 100 6 6 0.521 ± 0.0004 5.75± 0.01 95.88 ± 0.18
3 120 6 7.2 0.655 ± 0.0004 7.03± 0.01 97.62± 0.15
MET
1 80 6 4.8 0.397 ±0.0004 3.58±0.01 74.67±0.26
2 100 6 6 0.497 ± 0.0004 4.56± 0.01 75.97± 0.21
Table no. 4. Drug
name
Conc. In µg/ml
Inter day Intra Day
Mean*± S.D. Amt. Found % Amt. Found Mean*± S.D. Amt. Found %Amt. Found GLB
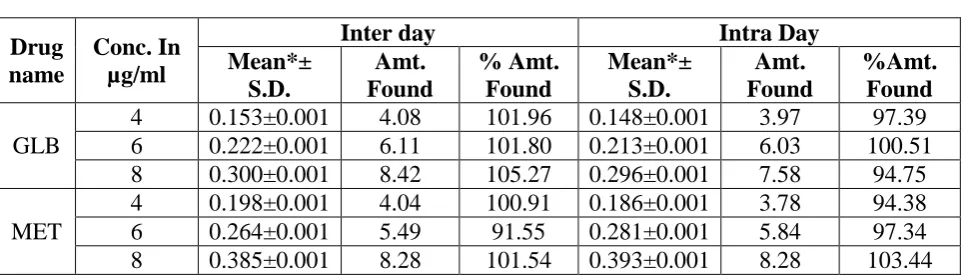
4 0.153±0.001 4.08 101.96 0.148±0.001 3.97 97.39
6 0.222±0.001 6.11 101.80 0.213±0.001 6.03 100.51
8 0.300±0.001 8.42 105.27 0.296±0.001 7.58 94.75
MET
4 0.198±0.001 4.04 100.91 0.186±0.001 3.78 94.38
6 0.264±0.001 5.49 91.55 0.281±0.001 5.84 97.34
8 0.385±0.001 8.28 101.54 0.393±0.001 8.28 103.44
*mean of each 3 reading.
Repeatability
Repeatability was ascertained by getting the sample analyzed by different analyst and
carrying out analysis for no. of times. The results are shown in table no. 04.
Table no. 5.
Sr.No. Conc Abs Amt Found % Amt Found
GLB MET GLB MET GLB MET GLB MET
1 6 6 0.187 0.289 5.06 6.02 84.31 100.36
2 6 6 0.186 0.288 5.03 6.00 83.82 100.00
3 6 6 0.184 0.296 4.97 6.17 82.84 102.90
4 6 6 0.185 0.287 5.00 5.98 83.33 99.64
5 6 6 0.182 0.286 4.91 5.96 81.86 99.28
6 6 6 0.186 0.289 5.03 6.02 83.82 100.36
7 6 6 0.187 0.287 5.06 5.98 84.31 99.64
8 6 6 0.188 0.286 5.09 5.96 84.80 99.28
9 6 6 0.181 0.287 4.88 5.98 81.37 99.64
10 6 6 0.180 0.288 4.85 6.00 80.88 100.00
MEAN 0.185 0.285 4.99 6.01 83.14 100.11
SD 0.003 0.003 0.077 0.060 1.28 1.00
% RSD 1.42 1.42 1.54 1.00 1.54 1.00
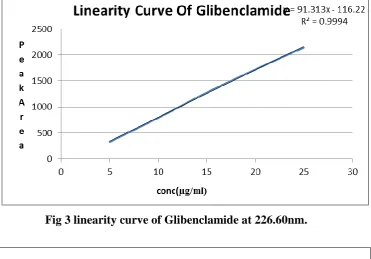
Linearity and Range
The suitable aliquots were taken to obtain 2, 4, 6, 8, 10 µg/ml. from GLB stock solution. The
suitable aliquots were taken to obtain 2, 4, 6, 8, 10 µg/ml from MET stock solution. The
Fig 3 linearity curve of Glibenclamide at 226.60nm.
Fig. 4 linearity curve of Meformin HCL at 233nm.
Ruggedness
Ruggedness of the proposed method is determined by analysis of aliquots from homogenous
slot by different analysts using similar operational and environmental conditions. The results
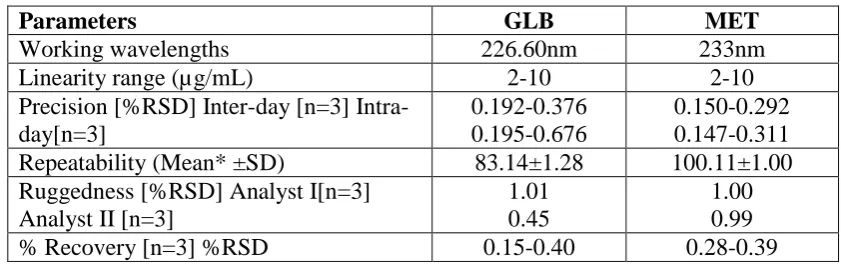
Table no. 6: Validation Parameter.
RESULTS AND DISCUSSION
In this method precision was studied as repeatability (% RSD < 2) and inter and intra-day
variations (%RSD < 2) for both drugs. The accuracy of method was determined by
calculating mean percentage recovery. It was determined at 80,100 and 120 % level. The
ruggedness of the methods was studied by two different analysts using the same operational
and environmental conditions. The % recovery, repeatability data, ruggedness data were
presented in Table-6.
CONCLUSION
The developed was found to be accurate, precise, economic, rapid and rugged. Further, the
developed method is simple and can usually be used for estimation of both these drugs in
their combined dosage form. This method is used for routine analysis of drugs in bulk and
pharmaceutical formulation.
REFERENCES
1. Drell, D.W. and Notkins, A.L. Multiple immunological abnormalities in patients with
type 1 (insulin dependent) diabetes mellitus. Diabetologia, 1987; 30(3): 132-143.
2. Martindale: The Complete Drug Reference, Pharmaceutical Press, 2007; 411.
3. Seema M. Dhole1, Pramod B. Khedekar, Nikhil D. Amnerkar, UV Spectrophotometric
Absorption Correction Method for the Simultaneous Estimation of Pioglitazone HCl,
Metformin HCl and Glibenclamide in Multicomponent Formulation, Int. J. Analytical &
Bioanalytical Chem, 2013; 3(1): 18-22.
4. Subhashini Edla and B. Syama Sundhar, New Analytical Method Development And
Validation For The Simultaneous Estimation Of Metformin And Glibenclamide in Bulk
And Tablet Dosage Form Using Rp-Hplc, RJC, 2014; 7(1): 55-63.
Parameters GLB MET
Working wavelengths 226.60nm 233nm
Linearity range (µg/mL) 2-10 2-10
Precision [%RSD] Inter-day [n=3] Intra-day[n=3]
0.192-0.376 0.195-0.676
0.150-0.292 0.147-0.311
Repeatability (Mean* ±SD) 83.14±1.28 100.11±1.00
Ruggedness [%RSD] Analyst I[n=3] Analyst II [n=3]
1.01 0.45
1.00 0.99
5. Narendra Nyola and Govinda Samy Jeyabalan, Method Development of Simultaneous
Estimation Of Sitagliptin And Metformin Hydrochloride In Pure And Tablet Dosage
Form By Uv-Vis Spectroscopy, WJPPS, 2012; 1(4): 1392-1401.
6. Patil Sudarshan S., Bonde C. G., Development and Validation of analytical method for
Simultaneous Estimation of Glibenclamide and Metformin HCl in Bulk and Tablets
using UV – visible spectroscopy, Int. J. Chem Tech Res., 2009; 1(4): 905-909.
7. Narsimha rao. Doredla, Shanmugasundaram. P, Hemant vaishnav, Method Development
and Validated of Simultaneous Estimation of Metformin Hydrochloride, Pioglitazone
Hydrochloride and Glibenclamide in Pure and Tablet dosage form by Spectrophotometric
Multi component Method, Int. J. ChemTech Res., 2011; 3(4): 2011-2017.
8. Abida Bilal, Kanwal Rehman, Muhammad Sajid Hamid Akash, Khalid Hussain,
Muhammad Ibrahim and Syed Saeedul Hussan, Development and Validation of
Analytical Method for Qualitative and Quantitative Determination of Glibenclamide in
Different Brands of Tablet Dosage form Using UV-Visible Spectroscopy, J Mol Genet
Med, 2013; 7(3): 1-6.
9. Shweta s. Havele,sunil r. Dhaneshwar, Determination of Glibenclamide, Metformin
Hydrochloride And Rosiglitazone Maleate By Reversed Phase Liquid Chromatographic
Technique In Tablet Dosage Form, Chem. Ind. Chem. Eng. Q., 2014; 20(1): 39−47.
10.Amruta B. Loni, Minal R. Ghante, S. D. Sawant, Simultaneous UV Spectrophotometric
Method for Estimation of Sitagliptin phosphate and Metformin hydrochloride in Bulk and
Tablet Dosage Form,Der Pharma Chemica, 2012; 4(3): 854-859.
11.Asit Kumar De, Ayan Kumar Dey, Angshuman Biswas, Simultaneous Estimation Of
Metformin Hydrochloride And Glibenclamide By Rphplc Method From Combined Tablet