U.V. SPECTROPHOTOMETRIC METHOD DEVELOPMENT AND
VALIDATION FOR ESTIMATION OF FLUCONAZOLE
Yadav Anandkumar*, Sonali Kapse-Mistry, Pramod Kadu
SVKMs Dr. Bhanuben Nanavati College of Pharmacy, Vileparle (W), Mumbai 400056,
India.
ABSTRACT
A rapid, simple, selective and precise U.V. Spectrophotometric method
for estimation of Fluconazole content has been developed. The
spectrophotometric detection was carried out at maximum absorption
wavelength 260.8nm in water. Linearity was observed at concentration
range of 25 to 500μg/ml with correlation coefficient of 0.999. LOD
and LOQ were found to be 1.59 and 4.82µg/ml. The developed method
was validated according to ICH guidelines for linearity, precision,
accuracy, robustness, LOD and LOQ.
KEYWORDS: U.V. Spectroscopy, Fluconazole, ICH guideliness, Validation.
1. INTRODUCTION
Fluconazole is a synthetic antifungal agent belonging to the group of triazoles. This drug is
structurally related to the antifungal agents that are imidazole derivative. Drug was approved
by FDA in the United States on January 9, 1990.[2] Fluconazole is a hygroscopic, crystalline powder freely soluble in methanol and slightly soluble in water. Fluconazole occurred in
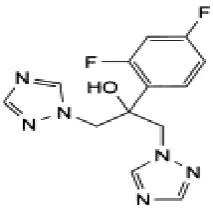
polymorphic form with different melting points, Form I : 135-136oC, Form II : 138 – 140oC, Form III : 137 – 138oC.[2] Fluconazole is chemically 2-(2,4-Difluorophenyl)-1,3-bis(1H-1,2,4-triazol-1-yl)propan-2-ol and is available in tablet, suspension, parentral and gels for
treatment of local, systemic fungal infection and deep organ candidiasis.[2,7] It acts as fungistatic agent by inhibiting fungal cytochrome P450 enzyme14α- demythylase and
prevents the conversion of lanosterol to ergosterol, an essential component of the fungal
cytoplasmic membrane, and subsequent accumulation of 14α-methyl sterols.[25]
Mammalian
demethylase activity is much less sensitive to Fluconazole than fungal demethylase.[6,25]
Volume 4, Issue 9, 1472-1480. Research Article ISSN 2277– 7105
Article Received on 01 July 2015,
Revised on 24 July 2015, Accepted on 16 Aug 2015
*Correspondence for
Author
Yadav Anandkumar
SVKMs Dr. Bhanuben
Nanavati College of
Pharmacy, Vileparle (W),
Mumbai 400056, India.
Fungal resistance to drugs (azole class) tends to occur gradually over the course of prolonged
drug therapy, resulting in clinical failure in immune-compromised patients (e.g., patients with
advanced HIV receiving treatment for thrush or esophageal Candida infection).[5] In C. albicans, resistance occurs by way of mutations in the ERG11 gene, which codes for
14α-demethylase. These mutations prevent the azole drug from binding, while still allowing
binding of the enzyme's natural substrate, lanosterol. Development of resistance to one azole
confers resistance to all drugs in the class. Another resistance mechanism employed by both
C. albicans and C. glabrata is increasing the rate of efflux of the azole drug from the cell, by
both ATP-binding cassette and major facilitator superfamily transporters. Other gene
mutations are also known to contribute to development of resistance.[5]
Adverse drug reactions associated with Fluconazole therapy include: rash, headache,
dizziness, nausea, vomiting, abdominal pain, diarrhea, and/or elevated liver enzymes.[30] Fluconazole is secreted in human milk at concentrations similar to plasma. Therefore, the use
of Fluconazole in lactating mothers is not recommended.[26] Some people are allergic to azoles. Some azole drugs may disrupt estrogen production in pregnancy, affecting pregnancy
outcome.[22]
Fluconazole is an inhibitor of the human cytochrome P450 system, particularly the isozyme
CYP2C9 (CYP3A4 to lesser ex-tent), therefore, fluconazole decreases the metabolism and
increases the concentration of any drug metabolized by these enzymes. (e.g. Phenytoin, Ca++
channel blocker, Warfarin, and other anticoagulant, Sulphonylurea, HMG CoA reductase
[image:2.595.244.351.545.651.2]inhibitor etc). In addition, it prolong QT interval increases the risk of cardiac arrhythmia.[7]
Fig. 1- Chemical Structure of Fluconazole
Numerous method has been reported in literature for analysis of Fluconazole in
Pharmaceutical preparation and biological sample such as UV spectrophotometric[10,20,26], High Performance Liquid Chromatography in pharmaceutical dosage form[1,3,24] and High
densiometry[14], Spectrofluorimetry[11], Gas Liquid Chromatography[15] and Micro-biological assay.[15,21]
2. MATERIALS AND METHODS 2.1. Materials
Fluconazole was obtained as gift sample from Symed Labs Limited, Hyderabad. Methanol,
Potassium Dihydrogen ortho-Phosphate, Sodium Hydroxide was purchased from SD Fine
Chemicals, Mumbai. Distilled water was used for the experiment. All the materials used were
of analytical grade.
2.2. Method Development 2.2.1. Instrumentation
Spectroscopy performed using double beam Shimadzu UV-Visible Spectrophotometer,
(Model UV1800) installed with software “UV Probe 2.33”.
2.2.2. Solvent Selection
Fluconazole is freely soluble in methanol and was used as solvent to aid solubilisation of
Fluconazole in distilled water to form homogeneous solution.
2.2.3. Preparation of Standard Stock Solution
Fluconazole (50 mg) was dissolved in 12.5ml methanol and volume was made with distilled
water to 100 ml to obtain stock solution of 500µg/ml (stock I). Subsequent concentration of
25, 50, 100, 200, 300, 400, 500µg/ml was prepared by diluting 0.25, 0.5, 1, 2, 3, 4, 5 ml from
stock I to 10 ml with water.
2.2.4. Wavelength Selection
Stock solution was scanned in UV range of 200nm to 400nm against water to determine
λmax.
2.3. Method Validation
Validation of method was done according to ICH guidelines Q2 (R1) with respect to linearity,
precision, accuracy, robustness, LOD and LOQ.
2.3.1. Linearity
Standard calibration curve of absorbance with working standard of varying concentration
2.3.2. Accuracy
Accuracy was determined with four different level of drug concentrations prepared from
three independent stock solution (n=9). Accuracy was validated by % Recovery.
2.3.3. Precision and Repeatability
Intraday precision (repeatability) was determined by analyzing sample in thrice a day at
interval of 2hr.
Interday precision (Intermediate precision) was determined by analyzing sample on four
different days with four different level of concentration prepared from independent stocks.
Data obtain was analyzed by standard deviation, % RSD.
2.3.4. Robustness
Robustness of method was determined with four different level of concentration by varying
the wavelength by 1nm.
2.3.5. LOD and LOQ
LOD and LOQ were determined by using standard calibration curve equation and can be
expressed as
LOD =3.3r/S and LOQ = 10r/S
Where S is the slope of the calibration curve and r is the standard deviation of y-intercept of
regression equation.
3. RESULT AND DISCUSSION
The proposed method was found to be simple, rapid, selective and precise and non expensive
for routine analysis of drug content in the formulation.
3.1. Wavelength selection
Scan performed from 200nm to 400nm showed two characteristic adjacent peaks at 265.4nm
Fig.3.1.1. – Scan of Fluconazole in water
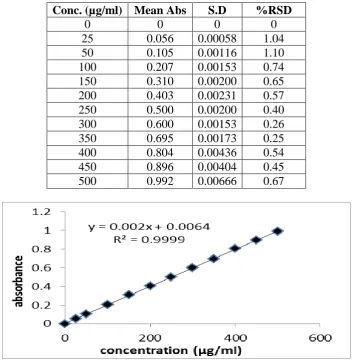
3.2. Linearity
Linearity is range within which the solution concentration is directly proportional to
concentration of analyte present in solution.
[image:5.595.121.477.384.745.2]Linearity was found between 25 to 500µg/ml in water with correlation coefficient of 0.9999.
Table 3.2.1. – Absorbance of Fluconazole in water at 260.8 nm Conc. (µg/ml) Mean Abs S.D %RSD
0 0 0 0
25 0.056 0.00058 1.04
50 0.105 0.00116 1.10
100 0.207 0.00153 0.74
150 0.310 0.00200 0.65
200 0.403 0.00231 0.57
250 0.500 0.00200 0.40
300 0.600 0.00153 0.26
350 0.695 0.00173 0.25
400 0.804 0.00436 0.54
450 0.896 0.00404 0.45
500 0.992 0.00666 0.67
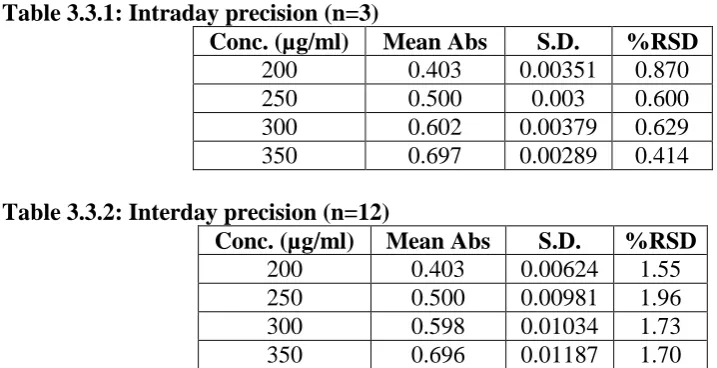
3.3. Precision
The precision of an analytical procedure is the closeness of agreement between a series of
measurements obtained from multiple sampling of the same homogeneous sample under
[image:6.595.71.430.190.374.2]prescribed condition.[19] The %RSD value was found to be < 2% for intraday and interday precision.
Table 3.3.1: Intraday precision (n=3)
Conc. (µg/ml) Mean Abs S.D. %RSD
200 0.403 0.00351 0.870
250 0.500 0.003 0.600
300 0.602 0.00379 0.629
350 0.697 0.00289 0.414
Table 3.3.2: Interday precision (n=12)
Conc. (µg/ml) Mean Abs S.D. %RSD
200 0.403 0.00624 1.55
250 0.500 0.00981 1.96
300 0.598 0.01034 1.73
350 0.696 0.01187 1.70
3.4 Accuracy
Accuracy is the closeness of the obtained value with respect to true value. The % recovery
was found to be in range of 98 to 99 % and % RSD value was found to be ≤ 2%.
Table 3.4.1: Accuracy (n=9)
Conc. (µg/ml) Mean Abs ± SD % RSD Measured Conc.
(µg/ml) ± SD % Recovery
200 0.401 ± 0.008 2.01 197.67 ± 4.04 98.83
250 0.501 ± 0.009 1.97 247.50 ± 4.92 99.00
300 0.597 ± 0.011 1.87 296.00 ± 4.92 98.67
350 0.697 ± 0.012 1.71 345.67 ± 5.97 98.76
3.5 Robustness
Robustness is the ability of method to resist small change in method parameter. The %
recovery after altering λmax by ± 1nm was found to be within 98 to 100 percent range.
Table 3.5.1: Robustness (n=3)
Conc. (µg/ml) Mean Abs ±SD % Recovery
200 0.396 ± 0.00255 98.21
250 0.491 ± 0.00325 98.20
300 0.589 ± 0.00382 98.22
350 0.683 ± 0.00545 98.25
3.6 LOD and LOQ
LOD (limit of detection) is the lowest amount of analyte in a sample that can be detected but
not necessarily quantified as exact value. LOQ (limit of quantification) is lowest amount of
analyte in a sample that can be quantified with suitable precision and accuracy.[19]
Table 3.6.1: LOD and LOQ
Slope Intercept ± SD LOD (µg/ml) LOQ (µg/ml)
0.002 0.0064 ± 0.001 1.59 4.82
3.7. CONCLUSION
The proposed method was found to be simple, rapid, selective, precise and non expensive for
routine analysis of drug content in the formulation.
ACKNOWLEDGEMENTS
The author thanks Symed Labs Limited, Hyderabad for providing the gift sample of
Fluconazole.
REFERENCE
1. Abdel-Moety E M, Khattab F I, Kelani K M & AbdEl-sattar A, II Farmac, 2007; 57:
931-938.
2. Alekha K. Dash and William F. Elmquist, Analytical Profile of Drug Sustances and
Excipients., 27: 67-111.
3. Al-Rimawi F, Jord J Chem, 2009; 4(4): 357-365
4. Amit Singh, Pramod Kumar Sharma and Deepak Kant Majumdar, Development and
validation of different UV-spectrophotometric methods for the estimation of Fluconazole
in bulk and in solid dosage form, Indian Journal of Chemical Technology., Sep 2011; 18:
357-362.
5. Bennett J.E. (2011). Chapter 57. Antifungal Agents. In L.L. Brunton, B.A. Chabner, B.C.
Knollmann (Eds), Goodman & Gilman's The Pharmacological Basis of Therapeutics, 12e.
Retrieved May 22, 2012 from
http://www.accessmedicine.com.ezp1.lib.umn.edu/content.aspx?aID=16678770.
6. C.M. Bhaskar Reddy, Spectro-photometric estimation of Fluconazole in pure drug and
pharmaceutical formulation, International Journal of Scientific and Engineering Research,
Vol. 3, Issue 9, September- 2012.
8. Cociglio M, Brandissou S & Alric R, J Chromatogr B, 1996; 686: 11-17.
9. Debruyne D,Ryckelynck J P & Bigot M C, J Pharm Sci, 1998; 77: 534-535.
10. Ekiert R J & Krzek J, Acta Pol Pharm, 2009; 66(1): 19-24.
11. El-Bayoumi A, El-Shanawany A A, El-Sadek M E & Ab dEl-Sattar A, Spectrosco Lett,
1997; 30(1): 25-46.
12. F. Al-Rimawi, Development and validation of Analytical Method for Fluconazole and
Fluconazole related compounds in Capsule Formulation by HPLC with UV Detection,
Jordan Journal of Chemistry., 2009; 4(4): 357-365
13. Gil Yosipovitch, Ilana Kaplan, Shlomo Calderon, Michael David, Yiong Huak Chan And
Abraham Weinberger, Distribution of Mucosal pH on the Bucca, Tongue, Lips and
Palate, Acta Derm Venereol., 2001; 81: 178–180.
14. Hillis J, Morelli I, Neville D, Fox J & Leary A C, Chromatogr, 2008; 67(11/12): 995-998.
15. Hurtado F K, Souza M J, Melo J & Rolim Clarice M B, Lat Am J Pharm 2008; 27(2):
224-228.
16. Indian Pharmacopoeia., 2010.
17. International Conference on the Harmonization of Technical Requirements for
Registration of Pharmaceutical for Human Use, Validation of Analytical Procedures: Text
and Methodology Q2(R1)
18. Jalali F & Rajabi M J, Chin J Chem, 2007; 25(9): 1300-1303.
19. Kelly M. Braj J Pharma Sci., 2009; 45(4): 693-700
20. Kragie, Laura; Turner, Stephanie D.; Patten, Christopher J.; Crespi, Charles L.; Stresser,
David M. (2002). "Assessing Pregnancy Risks of Azole Antifungals Using a High
Throughput Aromatase Inhibition Assay". PMID 12489563
21. Lakshmi K. S., Ilango k., Mathi N., Balaji S., Kibe Victor D.W. and Sathish Kumar V.,
Spectrophotometric Method for Estimation of Ceftriaxone Sodium in Vials, International
Journal of Pharma Sci. 2009; I(1): 22-25.
22. Limpiti D, Lhieochaiphant D & O-ariyakul N, CMU, 2006; 5(3): 341-349
23. Pfizer Australia Pty Ltd. Diflucan (Australian Approved Product Information). West
Ryde (NSW): Pfizer Australia., 2004.
24. Sadasivudu P, Shastri N & Sadanandam M, Int J Chem Tech Res, 2009; 1(4): 1131-1136.
25. Saleh Al Dgither, Ahmed Yusuf, Muhammad M Hammami, Fluconazole: Stability and
analysis in human plasma by simple high performance liquid chromatography, FABAD J.
Pharm. Sci., 2009; 34: 179-186.
27. Thomas L. Lemke, David A. Williams Victoria F. Roche, S William Zito, Foyes Principal
of Medicinal Chemistry, Sixth Edition, Wolters Kluwer publication,
ISBN-13:978-81-89960-30-8.