A VALIDATED UV SPECTROSCOPIC ASSAY METHOD
DEVELOPMENT FOR THE ESTIMATION OF DEFERIPRONE IN
BULK AND ITS FORMULATION
A. Padma*1, Dr. K.Thejomoorthy2, A. Pallavi3, B. Snehith3 and Mala Prashanth Kumar3
1
Assistant Professor, Department of Pharmaceutical Analysis, Sankar Reddy Institute of
Pharmaceutical Sciences, Salakalveedu (v), Bestavaripeta (M), Prakasam (Dist) Andha
Pradesh Pin -523370.
2
Associate Professor, Malineni Lakshmaiah College of Pharmacy, Kanumalla Road,
Singaryakonda, Prakasam Dt-523101.
3
Department of Pharmaceutical Analysis, Jntua- Oil Technological and Pharmaceutical
Research Institute, Ananthapuramu-515001, A. P, India.
ABSTRACT
The objective of work was to develop and validate a UV
spectrophotometric method for deferiprone in bulk and its dosage
form. The solvent and wavelength of detection were optimized in order
to maximize sensitivity of proposed method. The method was validated
for different parameters like linearity, precision, specificity, accuracy,
limit of detection (LOD), limit of quantitation (LOQ) and robustness as
per ICH guidelines (Q2). A wavelength maximum absorption of
Deferiprone in 50% v/v ethanol was monitored at 278nm. The method was found to be linear in the range of 2 to 12μg/ml with a correlation
coefficient (R2) of 0.999. The accuracy of the method was studied by
recovery study and % recovery was found to be 101.07%. The LOD
and LOQ were found to be 0.1808μg/ml and 0.547μg/ml respectively.
The method is simple, accurate and requires relatively inexpensive
instrument. The method was used successfully for determination of
Deferiprone in bulk and its pharmaceutical dosage form.
KEYWORDS: Deferiprone, Spectrophotometric method, ICH Guidelines, validation.
Volume 8, Issue 5, 1163-1169. Research Article ISSN 2277– 7105
Article Received on 12 Feb. 2019,
Revised on 04 March 2019, Accepted on 25 March 2019
DOI: 10.20959/wjpr20195-14686
*Corresponding Author
Prof. A.Padma
Assistant professor,
Department of
Pharmaceutical Analysis,
Sankar Reddy Institute of
Pharmaceutical sciences,
Salakalveedu (v),
Bestavaripeta(M),
Prakasam(Dist) Andha
Pradesh Pin -523370.
INTRODUCTION
Deferiprone is an oral iron chelator used as a second line agent in the treatment of
Thalassemia [1] when iron overload from blood transfusionoccurs.[2-6] Deferiprone has higher
binding affinity for iron than other metals such as copper, aluminium, and zinc.[7-9]
Thalassemia is a type of hereditary anaemia due a defect in the production of haemoglobin.
As a result, erythropoiesis, the production of new red blood cells, is impaired. It is chemically
3-hydroxy-1, 2-dimethyl-1, 4-dihydropyridin4-one.[10] The chemical structure of deferiprone
was shown in Figure 1. From the thorough literature survey very few analytical methods have
been reported for the determination of Deferiprone in pure drug and pharmaceutical dosage
forms using UV Spectroscopy.[8-10] Hence an attempt was made to develop and validate
simple, rapid and reliable analytical method to quantify Deferiprone in bulk and its
formulation. The developed method to be validated in accordance to ICH Q2 (R1)
guidelines.[11]
Fig.1 Chemical structure of Deferiprone
MATERIALS AND METHOD
Chemicals and Reagents: An analytically pure sample of Deferiprone was procured as gift sample from MSN laboratories (Hyderabad, India). Capsule formulation [Kelfer], Cipla
Formulation Pvt. Ltd. India] was purchased from a local pharmacy with labelled
amount250mg. Analytical reagent grade ethanol was purchased from SD Fine Chem. Pvt. Ltd
and distilled water was used as diluent for further preparations of the drug.
Instruments Used: For the current study UV/VIS double beam spectrophotometer, Shimadzu 1800 incorporated with UV probe as chemstation was used for the sample data
analysis and was scanned using 1 cm matched quartz cell.
Method Development
Solution, Methanol, Ethanol. Finally, Ethanol 50%v/v was chosen as the solventfor
Deferiprone depending on absorption at itsanalytical wavelength.
Preparation of stock solutions: Deferiprone pure drug 10 mg was weighed and transferred to a 10 ml volumetric flask and was dissolved in 50% v/v ethanol. It was dissolved properly
and diluted up to the mark with diluent to obtain final concentration of 1000μg/ml. From the
stock solutionvarious aliquots were prepared using distilled water.
Analysis of Marketed formulation (Sample Preparation): Weight equivalent of 10 mg of Deferiprone capsule formulation was takenand transferred into 10 ml volumetric flask. The
contents were dissolved with 50% v/v ethanol and sonicated for 5 min to enhance solubility
of the drug and then finally made up to the volume. From thisaliquot of 6μg/ml-1 was
prepared and used.
Validation of developed method
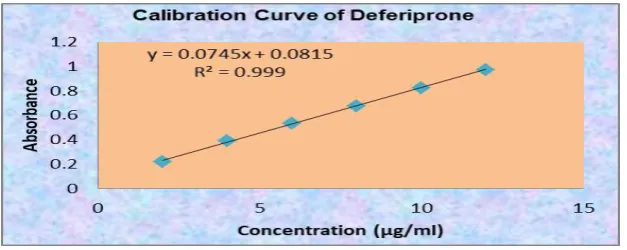
Linearity and Range: From the standard stock solution six aliquots of drug solutions were prepared to obtaindynamic linearity range between 2-12μg/ml, obeys Beer’s law. Standard
calibration curve was plotted from the absorbance values obtained for the six aliquots of drug
solutions by taking concentration (μg/ml) on x-axis and absorbance values on
y-axis.Calibration curve was shown in Figure 4. The linear regression equation was found to be
Y= 0.0745x+0.0815 and R2 as0.999. The results were tabulated intable 1.
Accuracy: Accuracy is determined as the closeness of the true value of analyte concentration. To determine the accuracy of the proposed method the recovery studies were
carried out at different levels (50%, 100% and 150%). The procedure was repeated for three
times. The mean percent recovery was calculated and shown in table 2.
Precision: It is an analytical procedure expressed as repeatability of set of results under the prescribed conditions. The precision studies were carried for both repeatability and
intermediate precision (interday) and %RSD was calculated. Intraday studies were carried for
all the samples and absorbance (n=6) was recorded. Inter-day studies were carried for
repeated days and absorbance (n=6) was recorded. The %RSD for both interday and intraday
Limit of Detection and Quantification (LOD& LOQ): The LOD and LOQ were calculated from the slope of regression equation obtained from calibration curve and standard deviation
was taken from precision studies. The result obtained was 0.18 and 0.547μg/ml respectively.
Robustness: The evaluation of robustness is a measure of its capacity to remain unaffected by small, but deliberate variations in method parameters and provides an indication of its
reliability during normal usage.By using working standard solutions of Deferiprone the
Robustness was performed at altered wave length of ± 2 nm. The %RSD was calculated and
found to be less than 2 and hence method was robust.
RESULTS AND DISCUSSION
The results obtained shows the method was novel, simple, economic and accurate
spectrophotometric method for the effective quantitative determination of Deferiprone as an
active pharmaceutical ingredient as well as in pharmaceutical preparations without the
interferences of other constituent in the formulations. The maximum absorption for the drug
was shown in figure 2 and overlay spectra for respective concentrations is shown in figure 3.
The developed method was validated in accordance with ICH Q2(R1) guidelines and overall
summary of validation parameters were tabulatedin Table 3.
[image:4.595.150.448.449.755.2]Fig. 2: UV Spectra of Deferiprone.
Table. 1: Results of calibration curve for Deferiprone.
S. No Concentration (μg/ml) Absorbance ± Std Dev
1 2 0.217±0.002 2 4 0.393±0.012 3 6 0.534±0.015 4 8 0.678±0.010 5 10 0.824±0.009 6 12 0.973±0.004
Regression value must be not more than 0.999. Llinearity of Deferiprone within 2-12µg/ml
[image:5.595.137.466.91.195.2]with regression value of 0.999.
Fig. 4 Linearity curve for Deferiprone.
Table. 2: Determination of Accuracy results for Deferiprone.
S. No Spike Level Absorbance (n=3)
Amount Added μg/ml
Amount Found
μg/ml % Recovery
1 50 % 0.279 1.48105 1.5 101.35
2 100 % 0.554 5.92417 5.98 101.035
3 150 % 0.805 13.3294 13.11 100.846 The mean % recovery was found to be 101.07%.
Table 3: The total Summary of Optical characteristics and Other Parameters.
S No. Parameters Results
1. Beer’s-Lambert’s range (μg/ml) 2-12
2. Regression equation (y) Y = 0.0745x - 0.0815 3. Slope (b) 0.0745
4. Intercept (a) 0.0815 5. Correlation coefficient (r2) 0.999 6. Intraday precision (% RSD) 0.24 7. Interday precision (% RSD) 0.56 8. Accuracy (% mean recovery) 101.07 9. Limit of detection (μg /ml) 0.18083 10. Limit of quantification (μg / ml) 0.547 11. Assay of tablets (%Purity) 100.083
[image:5.595.142.456.248.373.2]CONCLUSION
UV spectrophotometric method has been developed and validated according to ICH
guidelines. The proposed study describes a novel UV spectrophotometric method for the
estimation of Deferiprone in bulk and pharmaceutical dosage form using suitable diluent. The
present UV spectrophotometric method was found to be simple, sensitive, accurate, precise,
reproducible and robust relatively inexpensive. So, the developed method can be easily
applied for the routine Quality Control analysis of Deferiprone in pharmaceutical
preparations.
AKNOWLEDGEMENT
I thank MSN laboratories, Hyderabad for providing a gift sample of deferiprone. I would also
like to thank Director, JNTUA-OTPRI for providing necessary facilities to carry out this
research work.
REFERENCES
1. Savulescu J. (Thalassaemia major:the murky story of deferiprone). BMJ, 2004;
328(7436): 358–359.
2. Wanless IR, Sweeney G, Dhillon A P et al. (Lack of progressive hepatic fibrosis during
long-term therapy with deferiprone in subjects with transfusion-dependent
bete-thalassemia, Blood), 2002; 100: 1566–1569.
3. Olivieri NF, Brittenham GM.(Long-term trials of deferiprone in cooley’s anemia). Ann.
N. Y. Acad. Sci., 1998; 80: 217–222.
4. Yadegari H, Jabbari A, Heli H, Moosavi-Movahedi AA, Majidi S. (Electrochemistry of
deferiprone as an orally active iron chelator and HIV-1 replication inhibitor and its
determination). J. Braz. Chem. Soc, 2008; 19: 1017–1022.
5. Goddard JG, Kontoghiorghes GJ. (Development of an HPLC method for measuring
orally administered 1-substitiutd 2-alkyl-3-hydroxyprid-4-one iron chelators in biological
fluids). Clin. Chem, 1990; 36: 5–8.
6. Goncalves S, Paupe V, Dassa EP, Rustin P. (Deferiprone targets aconitase. Implication
for Fridreich’s ataxia). BMC Neurol, 2008; 8: 20–25.
7. Manzoor Ahmed. (Development and validation of first order derivative
spectrophotometric method for the estimation of deferiprone in bulk and capsule dosage
8. G. Venkateshwarlu. (Kinetic spectrophotometric determination of drugs Based on
oxidation by alkaline kmno4). WJPR, 2016; 5(6): 1429-1443.
9. Hinesha Barot, Darshil Shah, Dr. Dilip Maheshwari. (Development of stability indicating
UV Spectroscopy method development for the estimation of deferiprone in
pharmaceutical formulation). Am. J. Pharm Tech Res., 2015; 5(1): 622-632.
10.Vinod Kumar Jangade. (Development and validation of first order derivative
Spectrophotometric method for the estimation of Deferiprone in bulk and capsule dosage
form). Int J of uni pharma and bio Sci., 2016; 4(3): 169-176.
11.ICH Q2A, Text on validation of analytical procedures, International conference on