Bank of Canada
Banque du Canada
Working Paper 2004-26 / Document de travail 2004-26
Regulatory Changes and Financial
Structure: The Case of Canada
by
ISSN 1192-5434
Bank of Canada Working Paper 2004-26
July 2004
Regulatory Changes and Financial
Structure: The Case of Canada
by
Christian Calmès
Monetary and Financial Analysis Department Bank of Canada
Ottawa, Ontario, Canada K1A 0G9
The views expressed in this paper are those of the author. No responsibility for them should be attributed to the Bank of Canada.
iii
Contents
Acknowledgements. . . iv Abstract . . . v Résumé . . . vi 1 Introduction . . . 1 2 Indirect Finance . . . 22.1 Canadian banks and other financial institutions . . . 2
2.2 The loans business . . . 4
2.3 A credit-equivalent series for Canadian banks . . . 7
3 Regulatory Changes and the Financial Trend . . . 12
4 Additional Facts . . . 15
4.1 The perspective of global regulation. . . 15
4.2 Interpretation. . . 16
5 Conclusion . . . 23
Bibliography . . . 24
Appendix A: Data Sources and Equations . . . 26
iv
Acknowledgements
I thank Alejandro Garcia for his impeccable technical assistance throughout the study. I also thank Veronika Dolar for co-authoring the original version of this paper. Finally, I thank Joseph Atta-Mensah, Pierre St-Amant, and Carolyn Wilkins for their suggestions.
v
Abstract
The author documents some stylized facts about the Canadian financial structure. He explores these empirical facts in the context of Canadian financial legislation and finds that, over the 1990s, Canadian businesses became more heavily dependent on financial markets as their primary source of external funding. Data display a trend towards a more “market-oriented” financial system. The analysis suggests that this new trend started after the 1980 amendments to banking legislation and was considerably accentuated after the 1992 amendments. The author constructs a new series for the off-balance-sheet activities of Canadian banks that converts the non-interest income of banks into a credit equivalent. Combined with other evidence, this credit-equivalent series suggests a healthy growth trend in banking activity. Financial institutions are broadening their business lines and participating more actively in the arrangement of market financing. Regarding direct finance, the data indicate that Canadian firms issue a substantial share of their bonds in the U.S. bond market, and an increasing share of their stocks in the U.S. stock market. The author conjectures that there is some form of incompleteness in the Canadian markets. A noticeable fraction of Canadian issuances in the United States involves riskier firms for which U.S. markets seem more mature.
JEL classification: G20, G21
Bank classification: Financial institutions; Financial services; Recent economic and financial developments
Résumé
L’auteur présente des données à l’appui de certains faits stylisés sur la structure du système financier canadien et les examine à la lumière des changements législatifs intervenus au Canada. Il constate que, durant les années 1990, les entreprises canadiennes se sont tournées de plus en plus vers les marchés de capitaux, qui sont ainsi devenus leur principale source de financement externe. Une évolution vers un système financier davantage axé sur le marché se dégage des données. Cette tendance serait apparue après l’entrée en vigueur des modifications apportées à la législation bancaire en 1980 et se serait grandement accentuée après les changements législatifs de 1992. Pour analyser l’évolution des activités hors bilan des banques canadiennes, l’auteur construit une nouvelle série en convertissant les revenus autres que les intérêts en un équivalent de crédit. Combinée à d’autres informations, la série obtenue indique une saine progression de l’activité bancaire. Les institutions financières ont étendu la gamme de leurs secteurs d’activité et participent plus activement à la configuration de l’offre de financement sur les marchés. Les
vi
données font aussi ressortir la place importante du marché obligataire américain et le rôle grandissant de son pendant boursier dans le financement direct des entreprises canadiennes. D’après l’auteur, le caractère relativement incomplet des marchés canadiens expliquerait ce fait : une part non négligeable des émissions de titres canadiens aux États-Unis concerne des
entreprises à risque pour qui les marchés de ce pays paraissent présenter davantage de maturité.
Classification JEL : G20, G21
Classification de la Banque : Institutions financières; Services financiers; Évolution économique et financière récente
1
Introduction
This study documents some stylized facts regarding the financing provided to Canadian companies by external sources, rather than by retained earnings. In particular, I describe the trend in the way firms obtain their external financing. The main observation is that the Canadian financial system is becoming more market-based, with a greater proportion of financing being done through corporate bonds and equity. Moreover, the intermedi-aries that provide indirect financing to Canadian firms are also more “market-oriented,” because they are becoming increasingly involved in financial market activities such as underwriting securities.
This paper relates this new trend to Canadian legislative developments, which allowed financial intermediaries, especially banks, to become more market-oriented. The regu-lar revisions to Canadian financial legislation often happen when market conditions shift (Daniel, Freedman, and Goodlet 1992, Engert et al. 1999). They are usually followed by a series of financial innovations as intermediaries adjust to the new regulatory environment and take advantage of it. In turn, these financial innovations can potentially lead to a structural break in external financing.
This study is motivated by a simple intuition. Persistent market conditions contribute to developments in the trend of external financing. For example, Freedman (1992) notes that
. . . the increasing use of securities markets by corporate borrowers was prob-ably the single most important factor driving the integration of the banking and securities industries. As the traditional bank loan lost ground to the bond, equity, and especially, the paper market (including bankers’ acceptances), as well as to Euro-Canadian dollar and foreign currency issues, the banks became increasingly concerned about their ability to operate profitably and to com-pete effectively with both domestic securities dealers and with foreign banks and securities dealers.
The legislative restructuring is related to market conditions (Daniel, Freedman, and Goodlet 1992), and both have led to structural changes in the Canadian financial system. Consequently, in this paper, I consider Canadian legislative developments and market con-ditions interchangeably, and discuss how they can potentially contribute to the change in the trend of external financing.1
1
In this paper, I also consider financial regulation changes in global terms. For example, persistent shocks can originate from changes in foreign regulation: if U.S. regulation al-lows a new financial product not available elsewhere, then some Canadian borrowers may be better served by an expanding (i.e., more complete) U.S. market. In other words, when a new financial product is offered only abroad, the Canadian financial system becomes, in relative terms, more incomplete than the foreign market; Canadian firms find the rela-tively more complete foreign market more attractive. Hence, the evolution of the financial system is also driven in part by global regulation (and financial innovations). Canadian firms have, in fact, been able to take advantage of the larger diversity of financial products provided in the United States.2
More precisely, data show that Canadian businesses rely more or less equally on the Canadian and U.S. bond markets, the U.S. stock market being increasingly used throughout the 1990s to finance high-risk projects. The use of the U.S. market is indirectly related to regulation discrepancies between Canada and the United States, and is directly related to the high-yield market developments in the United States. For that reason, this paper considers global regulation and innovation to be potentially significant factors in explaining the evolution of the Canadian financial system during the 1980s and 1990s.
The Canadian financial system has evolved from its traditional four-pillar structure into a resilient, complex financial web.3
It is reasonable to assume that this transformation is closely related to legislative revisions. Section 2 describes the trends I draw from the data, and section 3 explains them. A simple econometric exercise suggests that regulatory revisions may help explain the structural trend-breaks observed in the data. Section 4 discusses a few additional facts about the structure of the Canadian financial system. Section 5 concludes and notes additional policy considerations.
2
Indirect Finance
2.1
Canadian banks and other financial institutions
Indirect finance involves a financial intermediary that stands between lender-savers and borrower-spenders and helps transfer funds from one to the other. The principal financial intermediaries that exist in Canada are: (i) chartered banks, (ii) trust and mortgage loan
2
The U.S. bond market was encouraged to develop and become deeper than in other countries because banking regulations kept the U.S. banking system artificially fragmented.
3
The four traditional pillars were: banking, insurance, securities, and trust services. Participants in each of these pillars were generally confined to offering products and services within their respective core businesses. For a more detailed definition of the traditional financial system, see Binhammer (1993).
Figure 1: Shares of Non-Financial Canadian Business Loans Extended by Financial In-stitutions (in Canadian dollars)
1970 1972 1974 1976 1978 1980 1982 1984 1986 1988 1990 1992 1994 1996 1998 2000 0 10 20 30 40 50 60 70 80 90 Chartered Banks
Trust and Mortgage Loan Companies
Nondepository Credit Intermediaries
Credit Unions and Caisses Populaires
Life Insurance Companies
Percentage
Note: The vertical lines represent the years in which significant revisions were made to the Bank Act.
companies, (iii) non-depository credit intermediaries, (iv) credit unions and caisses pop-ulaires, and (v) life insurance companies. Figure 1 shows the 30-year evolution of loan provision to non-financial businesses in these five categories.4
In the figure, the category of Chartered banks includes business loans, foreign currency loans to residents, bankers’ acceptances, non-residential mortgages, and leasing receivables. Securitization is not in-cluded, since it does not constitute a purely indirect financing activity. The series for non-residential mortgages and leasing receivables begin in October 1972 and July 1977, respectively. Therefore, these two series are backcasted to January 1969, which is the starting point for most of the series used.5
The loans extended by the category of Trust
and mortgage loan companies are composed of non-residential mortgages, leasing
receiv-4
For a detailed description of the data, see Appendix A.
5
ables, and short-term business loans. The category of Non-depository credit intermediaries also consists of business loans, non-residential mortgages, and leasing receivables. The category of Credit unions and caisses populaires is composed of short-term business loans and non-residential mortgages; Life insurance companies includes only non-residential mortgages.
The figure shows that trust and mortgage loan companies grew gradually until the early 1990s, when they started to be bought up by the large Canadian banks. Recently, 75 per cent of loans have been provided by Canadian banks, having risen slowly from a low point of around 65 per cent in 1992. The increasing share of banks has also been at the expense of life insurance companies, which have seen shares decline slowly since 1994. As Freedman (1998) explains, this situation is partly related to the change in bank-ing regulations that permitted banks to own trust subsidiaries. Indeed, after the 1992 amendments, most of these banks acquired trust subsidiaries either by purchase or cre-ation. This is obvious from Figure 1: the vertical bar that marks the 1992 amendments coincides with the reversal of a declining trend for banks. Since that time, banks have been gaining market share, primarily at the expense of the trust and mortgage loan in-dustry, but also from life insurance companies. Hence, with the regulatory amendments, the loan business has been increasingly absorbed by Canadian banks.
2.2
The loans business
While the share of Canadian banks has been stable relative to other lending institutions, the financial institutions together have been losing market share to the financial markets in providing external funds to Canadian non-financial businesses. As Figure 2 illustrates, the trend in the Canadian financial structure is towards a more market-based system. In the figure, the Loans category is the total of all intermediary or indirect lending described in Figure 1. More specifically, the Loans category includes total short-term business credit excluding commercial paper and securitization. It is the sum of business loans, chartered bank foreign currency loans to residents, bankers’ acceptances, plus other business credit by institutions (non-residential mortgages and leasing receivables). The Bonds category includes bonds and debentures plus commercial paper issued by non-financial corpora-tions, and the Stocks category consists of shares outstanding. The category of Other includes other sources of external funds, such as special-purpose corporations (securitiza-tion); it captures those items that can neither be defined as a purely direct nor indirect type of financing.
Figure 2: Sources of External Funds for Canadian Non-Financial Businesses 1970 1972 1974 1976 1978 1980 1982 1984 1986 1988 1990 1992 1994 1996 1998 2000 2002 0 10 20 30 40 50 60 70 Loans Bonds Stocks Other Percentage
Figure 3: Direct/Indirect Private Lending 1968 1970 1972 1974 1976 1978 1980 1982 1984 1986 1988 1990 1992 1994 1996 1998 2000 0.4 0.6 0.8 1.0 1.2 1.4 1.6 1.8 2.0 2.2 -5 0 5 10 15 20 25 Direct/Indirect Ratio Inflation Direct/Indirect Lending
Note: The vertical lines represent the years in which significant revisions were made to the Bank Act.
The vertical bars again correspond to periods of significant amendments in financial regulation. Indirect financing clearly decreased, in relative terms, in the 1990s, and has returned to the same level as in the late 1960s. In other words, Canadian financial institu-tions have been experiencing a relative decline in the market share of their loan portfolios. More precisely, there has been a relative drop in loan business, from approximately 60 per cent of external financing in the early 1980s to just under 40 per cent in recent years. At the same time, bonds, equity, and other categories have all increased as a share of external funding.
To confirm this empirical fact, I divide the sum of bonds, shares, and others by loans extended by financial institutions. The computation of this ratio is plotted in Figure 3, which displays a U-shaped direct/indirect lending ratio, as expected. Indirect financing provided by financial institutions was gaining market share until the early 1980s, when
the situation stabilized. After ten years of little change, until around 1991 or 1992, direct financing started to capture a growing share of external funding and has increased steadily ever since.
As Engert et al. (1999) point out, the Canadian financial system is undergoing no-ticeable restructuring. The traditional operations of Canadian banks are changing as a result. For example, advances in computer technology enable financial firms to design and sell different types of financial instruments that are sometimes more closely related to direct market financing than to traditional loan business (Engert et al. 1999). Diverse financial innovations give banks more flexibility than they used to within the conven-tional business of lending (see Daniel, Freedman, and Goodlet 1998). Freedman (1992, 373) states that “while the Canadian financial system was historically characterized by a separation of functions among the different institutions, the separation has been blur-ring over the past 25 years or more, with the penetration by each group into the others’ primary areas of business accelerating over the recent period.” Hence, the relative de-cline of the loan business can be considered the result of a historical trend towards the blurring of the boundaries between financial intermediation and direct financing: there has been a shift toward direct financing and an increased involvement of banks in the securities-underwriting business (Journal of Financial Intermediation 2001).
2.3
A credit-equivalent series for Canadian banks
Several indicators show that the Canadian banking sector is growing well despite the de-creasing trend in the loan business. The banks’ total assets as a percentage of nominal gross domestic product indicates that Canadian banks are quite healthy6
: these findings are similar to those of Boyd and Gertler (1994) for the U.S. banks. Indeed, as Figure 4 shows, although the loan portfolios by financial intermediaries have been slowly declin-ing relative to nominal GDP, total assets of financial intermediaries have been markedly increasing relative to nominal GDP. The balance-sheet numbers indicate a continual in-crease in banking relative to overall economic activity over the entire period.
Even more important is the increase in off-balance-sheet (OBS) activities, which gener-ate non-interest income outside of the traditional activities; i.e., OBS activities including market-related activities.7
For that reason, they are generally overlooked: it is customary to analyze the evolution of banks’ assets in the balance sheet only (e.g., D’Souza and
6
Obviously, other indicators are required to assess their overall health.
7
For a complete definition of non-interest income, see Canada (Statistics Canada 2001) and Appendix B of this paper.
Figure 4: Total Assets, Credit Equivalent, and Commercial Loans Extended by Financial Intermediaries as a Percentage of Nominal Gross Domestic Product
1984 1985 1986 1987 1988 1989 1990 1991 1992 1993 1994 1995 1996 1997 1998 1999 2000 2001 2002 0 100 200 300 400 500 600 700
Total Assets of Financial Intermediaries Total Loans Extended by Financial Intermediaries Credit Equivalent
Total Assets + Credit Equivalent
Percentage
Figure 5: Non- and Net Interest Income 1982 1984 1986 1988 1990 1992 1994 1996 1998 2000 0 5000 10000 15000 20000 25000 Non-Interest Income Net Interest Income
Millions of Dollars
Lai 2003). If assets are increasing, income derived from them also must be increasing. The use of balance-sheet assets as a measurement of bank profitability substantially un-derestimates their “true value,” since balance sheets do not account for OBS activities. Hence, to get a clear picture of the banks, the non-interest income associated with these OBS assets must be accounted for. Indeed, in 2000, non-interest income of Canadian financial institutions rose to $23.8 billion, a 19.5 per cent increase from the previous year (and a 74.3 per cent gain for corporate and institutional finance services): “The growth in non-interest income, which continued the trend seen over the last several years, indi-cated a shift away from income earned by deposits and loans to income earned mostly by providing fee-based services” (Canada. Statistics Canada. 2002, 6).
As Figure 5 shows, non-interest income has grown much faster than net interest in-come. The data are consistent with Freedman’s (1998, 36) observation that “[a]nother important trend in the operations of Canadian banks in recent years, in line with
devel-opments in other major banks worldwide, has been the shift towards off-balance-sheet activities and fee income.” This has been particularly true during the last decade, and more precisely since the 1992 (and 1997) Bank Act amendments. The financial restruc-turing described earlier8
explains why a growing share of bank activities is done OBS. The markets for these alternative instruments have experienced high rates of financial innovation over the last decade or so.
OBS activities are, by definition, not reported as traditional lending, so it is difficult to get an accurate measure of bank activities in these areas. Following Boyd and Gertler’s (1994) methodology, I use the non-interest income series to assess the importance of OBS activities. I build a new credit-equivalent series for these Canadian bank activities. The idea is to transform the non-interest income series into an asset-equivalent series— conditional on some simplifying assumptions—as if this non-interest income had been generated from tangible assets in the same manner as regular lending. To account for the OBS activities, I adjust the measure of banks’ assets by adding the credit-equivalent component. Bank profits, π, can be expressed as a function of interest income, Ib, interest
expense, Eb, loan-loss provision, Pb, total assets, A, non-interest income, Yo, and
non-interest expense, No:
π = (Ib− Eb− Pb) + (Yo− No), (1)
where the subscript o stands for OBS and b stands for on-balance sheet. I assume that the income flow, Yo− No, is generated by some unknown asset, Ao, which has the same
properties as Ab. I want to compute the unknown Ao as a credit equivalent of Yo − No.
Since these assets are generated by the same sources of capital, I assume that Ab and Ao
generate the same average profit and returns.9
That is, their profit ratios are πb/Ab =
πo/Ao and
Ao = Ab∗ (Yo− No)/(Ib− Eb− Pb). (2)
Ao is the credit-equivalent series for OBS items. It is the level of on-balance-sheet-like
assets that would have generated a net interest income (Yo− No), the actual non-interest
income generated.
Figure 4 shows that, after the 1992 and 1997 amendments, this credit-equivalent es-timate of OBS items began to grow more quickly. Thus, in the last ten years, much of the growth in total (adjusted) banks’ assets, on- and off-balance sheet, has in fact come
8
See Engert et al. (1999): financial firms design and sell different types of financial instruments that are sometimes more closely related to direct market financing than to traditional loan business.
9
Figure 6: Short-Term and Other Business Credit Securitization 1989 1990 1991 1992 1993 1994 1995 1996 1997 1998 1999 2000 2001 2002 0 5000 10000 15000 20000 25000 30000 35000 40000 700000 750000 800000 850000 900000 950000 1000000 1050000 1100000 Securitization GDP Millions of Dollars
from non-interest income. To the extent that banks are competing over service fees, this growth is unlikely to come from increased prices in fee-based services: although a de-tailed analysis of non-interest income is beyond the scope of this study, it is reasonable to assume that the growth is driven by market-related activities such as trading income (Stiroh 2002, Stiroh and Rumble 2003). Securitization is yet another example of such non-traditional activities that contribute to non-interest income.10
As Figure 6 shows, the use of securitization started in the early 1990s, and exploded a few years later.
The transition towards a more sophisticated system of financial intermediation is tak-ing place not only in Canada but abroad. The increase in OBS activities corresponds to a transition driven by regulatory changes, financial innovations, and the technological
10
Freedman (1998, 33) notes that banks increasingly participate “in the rapidly growing securities lending and repo markets, as well as to the use of securities to hedge interest rate swaps and other derivatives transactions.”
progress that is accompanying them. For example, for the United States, “[c]redit deriva-tives, loan sales markets, and the buying and selling of credit risk provide hedges, and bankers have become much more receptive to using these approaches with the evolution of computer support”(United States of America 2002, 4).
This common transition translates into more sophisticated relationships between firms, banks, and investors (Olson 2002). Financial institutions provide more services to in-vestors, while at the same time they service the firms at different levels; i.e., the nature of their relationships has changed in a number of ways. As the financial system becomes more complex, financial intermediaries play the role of an expert adviser for both investors and firms (Allen and Gale 2000).
3
Regulatory Changes and the Financial Trend
The size and profitability of banks have not declined: consistent with the transition de-scribed in section 2.3, data suggest only a relative decline in indirect financing (e.g., lend-ing by Canadian banks, trust, other financial intermediaries) and a structural break in the trend of the direct-indirect financing ratio. In recent history, the 1980 amendments—the 1980 change in the Canadian financial regulation—was the first of a series that had a per-sistent effect on banks and other financial institutions. Canadian banks are all federally incorporated and regulated under the Bank Act, which defines their range of activities. A very important element of this banking legislation is the “sunset” clause, which requires a periodic reassessment and updating of the laws that govern Canadian banks. In the past, the legislation provided for a decennial review. The 1992 Bank Act, however, shortened the review period from ten to five years. The formal review process led to significant Bank Act amendments in 1980, 1987, 1992, and 1997.
The 1980 Bank Act is important, because it allowed banks to have subsidiaries in different areas such as venture capital and mortgage loans. This led to the creation or purchase of mortgage loan companies by the banks. Following the financial reforms in 1987 and 1992, the banks entered into a range of new businesses with a particular em-phasis on OBS activities.
In 1987, Canadian banks were permitted to invest in corporate securities, as well as distribute government bonds (Freedman 1998). All major banks made substantial in-vestments in the securities business and purchased control of most of the existing large investment dealers. The legislative amendment of 1987 was put in place to address ac-companying market pressures. The 1987 amendments allowed financial intermediaries to
conduct brokerage activities (Freedman 1998) (Canada. Department of Finance 1985). As Freedman (1998) explains, during the early 1980s Canadian banks were “concerned about their loss of business to direct market financing” and they “entered the securities business in a major way following the 1987 legislative change.” Figure 3 shows this pat-tern: the financial structure displays a trend toward a more market-oriented system, with a pronounced trend-break associated with the implementation phase of the 1987 amend-ments. More precisely, the transition occurred between 1987 and 1989, as customers of banks began to be able to invest in financial markets directly through their banks. After the change in legislation, and with the help of financial innovations, Canadian financial intermediaries became more market-oriented. In other words, intermediaries embraced and promoted the trend toward market financing through greater direct involvement in financial markets.
In 1992, banks were given the right to enter the trust business through the establish-ment of, or acquisition of, trust companies. Over the next few years, the major banks bought most of the trust companies still in operation. The financial difficulties many trust companies experienced following the collapse of the speculative real estate boom in the late 1980s contributed to the ability of banks to acquire them. Also in 1992, banks were permitted to offer in-house activities such as portfolio management and investment advice. As banks started these new types of activities, a larger fraction of depositors may have been attracted to investing in financial markets directly through their banks. In 1997, new legislation included various changes to update and refine the amendments made in 1992.
These amendments can be credibly assumed to constitute one of the underlying sources of the market-oriented trend. Indeed, part of the trend can be explained by the financial cycle and such factors as general economic conditions, market conditions, interest rates, inflation, exchange rates, technology, and changes in the regulatory environment. The accompanying regulation also plays a significant role. Figure 3 depicts the realization of a stochastic variable, the direct/indirect lending ratio (Ratio), that follows a data-generating process with shifts in its trend. To determine whether there is evidence that these shifts coincide with the amendment dates to the Bank Act (1980, 1987, 1992, and 1997), I estimate a simple regression using dummy variables that correspond to these dates. More precisely, I assume that there is a phase-in period of six months for adjusting to new legislation, and I start the shifts two quarters after the amendments.11
For example, to capture the effect of the amendments that took place in 1980Q4, I use a dummy variable
11
at 1981Q2. After investigating various specifications, I find the following to be the most appropriate (based on Chow tests):
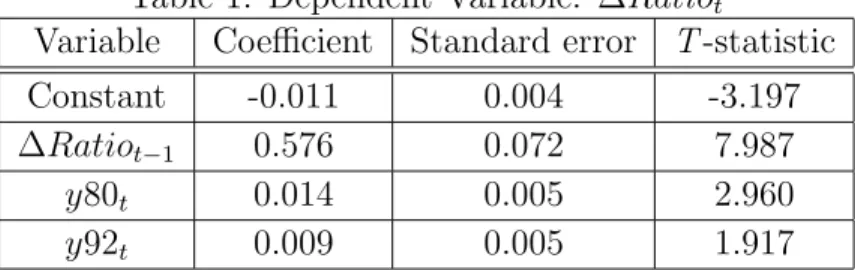
∆Ratiot= α + β1∆Ratiot−1+ β2y80t+ β3y92t+ εt, (3)
where ∆Ratiot represents the first difference in the ratio of direct to indirect financing,
and y80tand y92trepresent two amendment dummies. These dummy variables are defined
as follows:
y80 = 1 from 1981Q2 on; 0 otherwise, y92 = 1 from 1993Q2 on; 0 otherwise.
Table 1 shows the results of the estimation using quarterly data. Shifts in the AR slope coefficient prove to be significant. Dummy variables for the 1987 and 1997 Bank Act amendments are also significant. These dummies do have the expected positive sign. Since y92t is significant, one interpretation of the result is that the biggest impact
oc-cured not only because the banks were permitted to enter the securities business in 1987, but also because they were permitted to expand their in-house activities in 1992, ren-dering financial investment more attractive to their client depositors. Before 1980, the
Table 1: Dependent Variable: ∆Ratiot
Variable Coefficient Standard error T -statistic Constant -0.011 0.004 -3.197 ∆Ratiot−1 0.576 0.072 7.987 y80t 0.014 0.005 2.960 y92t 0.009 0.005 1.917 Note: R2 = 0.631, Durbin-Watson statistic = 1.861
direct to indirect financing ratio is characterized by negative drift, as illustrated by Figure 3 and the significantly negative constant. After 1980, however, the drift term shifts to become slightly positive but insignificant (+0.003). The next significant change arrives with the 1992 amendment dummy, which raises the overall drift term to 0.012. Given these estimates, direct finance could again (as in 1969) become twice as large as indirect bank finance.
Obviously, this specification for the data-generating process of Ratio is very simple and ignores possibly important cyclical and other economic, regulatory, and technological factors (e.g., fiscal changes of the 1990s). It simply highlights the significant impact that the concomitant regulatory changes may have had on the financing mix, among other possible factors.
Figure 7: Gross New Issues of Bonds and Stocks by Canadian Non-Financial Businesses 1966 1968 1970 1972 1974 1976 1978 1980 1982 1984 1986 1988 1990 1992 1994 1996 1998 2000 0 10 20 30 40 50 60 70 80 90 100 In Canada In U.S. Elsewhere Percentage
Note: The vertical lines represent the years in which significant revisions were made to the Bank Act.
4
Additional Facts
4.1
The perspective of global regulation
With direct financing, businesses borrow funds directly from savers in financial markets by selling them securities (bonds or stocks). Stocks are equities (residual claims) on the bor-rower’s future assets; bonds are claims on the borbor-rower’s future income and assets. Figure 7 plots gross new issues of securities (bonds plus stocks)12
by non-financial businesses.13
The category of In Canada is composed of all corporate preferred shares, common shares, and warrants, plus bonds, issued in Canada. The category of In the United States, as its name suggests, includes corporate shares and bonds issued in the United States; the
12
I am interested in the external-financing requirements of Canadian firms. I judge the gross new issues measure to be appealing, but it is possible to consider net new issues as well.
13
category Elsewhere contains the same securities issued in all other countries such as the United Kingdom, Switzerland, Japan, and Germany.
The figure shows that, abstracting from the volatility, there has been a relative de-crease in gross new issues of securities (stocks and bonds) by non-financial corporations in Canada since the early 1980s. The data reveal that the share of issues in Canada fell from around 80 per cent in the 1960s, 1970s, and early 1980s to approximarely 65 per cent in the 1990s and recent years.
At the same time, the share of issues placed in the United States rose from less than 10 per cent in the 1980s to more than 35 per cent in recent years. This suggests that the market-oriented trend of firms that Canada is experiencing might benefit U.S. markets
relatively more than Canadian markets. More precisely, the trend has probably fed several
U.S. markets, including the high-yield bond market, in which approximately 40 per cent of the recent Canadian high-yield issuances in the United States came from the telecom-munications sector.
There has been an increase in Canadian-based stock issues interlisted on U.S. ex-changes. Figures 8 and 9 show that the relative decrease in the issues of securities (bonds and stocks) in Canada can be almost entirely accounted for by a relative decrease in stock issues. Figure 8 shows that, in the 1980s and 1990s, there was a relative decline in gross new issues of stocks in Canada, offset by an increase of shares placed in U.S. exchanges. Figure 9 shows that, despite the volatility, the Canadian bond market kept its relative share generally stable, and on average accounted for approximately 50 per cent of total Canadian bond issuances. This helps explain how Canadian bond issuances have been preserved.
Based on the outstanding amounts, stocks rather than bonds are the largest component of direct financing. This was particularly true in the early seventies, when bonds accounted for approximatly 20 per cent of external financing, and stocks accounted for more than 45 per cent. In recent years, bonds have become a more important source of financing, jumping to around 30 per cent. Equity and other financing now represent only a slightly higher proportion of external funding (for similar findings, see Miville and Bernier 1999).
4.2
Interpretation
The fluctuations of the three main components of the financial structure (loans, bonds, and stocks) are often market-driven. For example, the change in the financial structure that occurred in the 1970s is partly attributable to the business cycle. In particular,
Figure 8: Gross New Issues of Stocks by Canadian Non-Financial Businesses 1966 1968 1970 1972 1974 1976 1978 1980 1982 1984 1986 1988 1990 1992 1994 1996 1998 2000 0 20 40 60 80 100 120 In Canada In U.S. Elsewhere Percentage
Figure 9: Gross New Issues of Bonds by Canadian Non-Financial Businesses, Issued in Canada and Abroad
1966 1968 1970 1972 1974 1976 1978 1980 1982 1984 1986 1988 1990 1992 1994 1996 1998 2000 0 10 20 30 40 50 60 70 80 90 100 In Canada Abroad. Percentage
inflation was so severe at the time that it likely had a deep and persistent impact on the Canadian financial trend itself. The extended period of high inflation would have induced businesses and lenders to shift in favour of short-term loans and away from long-term instruments such as stocks and bonds. This can help explain why the equity portion of financing fell quickly throughout the 1970s, and why loans were increasing. (The frac-tion of bonds was relatively stable, despite the absence of floating-rate bonds at the time.) The high-inflation environment of the 1970s, however, might have helped convince policy-makers to change the Bank Act, as they did in 1980. Engert et al. (1999) note that three economic factors drove the legislative restructuring: the technological revo-lution, an aging population, and the variability of inflation and interest rates. There is evidence that high inflation can cause financial innovation as agents attempt to deal with the erosion of wealth,14
and it is plausible that it triggers regulatory changes. Data suggest that, in turn, these changes might have contributed to the evolution in external financing. They could also explain some of the recent increase in the use of stocks and bonds. Over the 1990s, the low-inflation, high-growth environment may have contributed to the increasing share of direct financing, with regulation accommodating these market conditions (Daniel, Freedman, and Goodlet 1992, Freedman 1992, and Engert et al. 1999). Interestingly, the composition of external financing in Canada seems different from that in most other countries, and somewhat contrary to theory. Theory would predict that a firm should first rely on internal financing, followed by, in order, loans, bonds, and, stocks, because a firm wants to avoid the dilution of its ownership.15
In contrast, Figure 2 shows that the relative share of bonds is quite modest, and actually inferior to equity’s share of external financing; possibly this occurs because, in Canada, dividends and capital gains have a tax advantage over interest income. A lower average tax rate on dividend, resulting from the dividend tax credit, will create a demand-side effect in favour of equity. Unique to Canadian experience is the maturation process of the Canadian corporate bond market (see Chouinard and Lolani 2001). This process originated in the early 1990s, when government borrowing started to decrease and corporate bonds started to fill the gap—public “crowding in.” During that phase, the Canadian corporate bond market was left with lower liquidity, whereas the U.S. bond market was already quite mature. Indeed, in the past, owing to regulation, the fragmented U.S. banking system encouraged companies to rely on the bond market earlier than elsewhere. Canadian firms might have benefited from the early maturity of the U.S. bond market.
14
For a theoretical explanation, see Alexopoulos (2002).
15
Figure 10: Total Loans at Chartered Banks: Canadian Dollars versus Foreign Currency 1995 1996 1997 1998 1999 2000 2001 2002 0 50000 100000 150000 200000 250000 300000
Chartered Banks’ Loans in Canadian Dollars Chartered Banks’ Loans in Foreign Currency Total Foreign Currency Loans to Canadian Residents
Millions of Dollars
Recently, Canadian banks lent more to foreign companies (Figures 10 and 11) and, with consecutive amendments, they became more market-oriented, while Canadian firms started to rely more on financial markets. Data suggest that Canadian businesses have never relied more on bond markets than today. Ranked sixth in size (Miville and Bernier 1999), the Canadian bond market is relatively large by international standards. The in-terest of Canadian firms in issuing bonds involves foreign bond markets. Indeed, there is evidence that the Canadian bond market keeps lagging behind the United States in finan-cial maturity. For example, the lack of a meaningful high-yield market in Canada can be considered as one of the main reasons that a number of Canadian companies issue debt in the United States (high-yield credits account for roughly 40 to 50 per cent of the value of U.S.-dollar new [Canadian] issues each year). By comparison, between 1996 and 2001, new issues of high-yield bonds in Canada accounted for only 3 per cent of total bond issues. Nevertheless, the fact that Canadian firms rely on the more-mature U.S. bond
Figure 11: Total Liabilities at Chartered Banks: Canadian Dollars/Foreign Currency 1960 1965 1970 1975 1980 1985 1990 1995 2000 0.5 1.0 1.5 2.0 2.5 3.0 3.5 4.0 4.5
5.0 Total Liabilities at Chartered Banks
market is not necessarily a concern, although it may constitute a poor diversification of funding. Further investigation of this matter leads to a simple conclusion: the U.S. bond market might allow some risky Canadian firms to finance themselves more easily in the United States than in Canada.
The U.S. bond market could have the advantage of a “first entrant”: it was developed earlier than the Canadian one and offers a high degree of liquidity and many finan-cial products (liquidity and completeness being related). This can be espefinan-cially true for Canadian firms involved in risky projects. With a high-risk profile, a firm may encounter difficulty when dealing with the Canadian financial system, since Canadian investors seem reluctant (or not well-enough informed) to fund some types of high-risk projects. Because Canadian markets are less liquid—and in the quasi-absence of a meaningful low-rating bond market in Canada—these firms are sometimes left with no choice but to rely on the less risk-averse, more developed, U.S. bond market.
Ultimately, it is possible for Canadian companies that consider bonds or stocks as their source of external financing to issue them either in Canadian or U.S. markets. When choosing where to issue, companies consider several factors: the level of risk firms present to the market, the cost involved, and the size of the investment they require. The com-bination of these three factors determines whether companies go to the United States or rely on Canadian markets.16
The first hurdle companies face is the level of risk for the liability they plan to issue. If it is too high, they are limited to the U.S. market, since the Canadian high-yield market does not yet have the liquidity to make it attractive to investors. Second, if the level of risk is appropriate for the Canadian market, then the size and the cost of the investment are the determinants. The larger the size, the more attractive the U.S. market. Third, regarding Canada, the increasing use of derivatives during the last decade has lowered the cost and made the Canadian market more acces-sible, as well.
Regarding the financial innovations factor, the availability of derivatives, such as cur-rency swaps, permits Canadian companies to issue in U.S. dollars, while hedging against currency fluctuations and still having access to the corresponding value in Canadian dol-lars.17
Thus, as the use of derivatives became more popular in the early 1980s, it became possible for Canadian companies to increase their exposure in the U.S. financial markets, accessing a larger pool of funds while mitigating their currency risks. Moreover, risky
16
Numerous other factors can be invoked as well, such as basic quality signalling, whereby a firm listed in the United States attracts more attention.
17
Canadian companies also relied on the U.S. NASDAQ market, since no equivalent market existed in Canada until recently. That might help explain the downward slope of the In
Canada stocks series of Figure 6 for the last decade.
5
Conclusion
I have found evidence that the regulation that accompanies market pressures influences the trend of the financial structure. Regulatory factors help explain the relative decrease of indirect financing since 1980. This decrease coincides with an increase in the credit equivalent I built for the banks’ non-interest-income component. The adjusted total asset level of banks grew quickly after the 1987 and 1992 regulatory amendments.
The change in the Canadian financial system does present challenges to regulators and to the authorities who develop the legislation. Obviously, one of the challenges is the need to take account of regulation more globally; that is, to consider the impact of foreign regulations and their associated series of financial products.
Furthermore, if it were confirmed that medium-sized Canadian firms relied more on foreign markets for their issuances of high-yield bonds, because of tax, cost, or regulation concerns, and that small and some risky firms were somewhat credit-constrained (without easy access to high-yield bond markets or Canadian stock market), it might also be appro-priate to revise regulations for risky investment like high-yield bonds, angel investment, and venture capital to enhance their performance. For example, for angel investment, Canada has some (fiscal) regulation differences with the United States. Finally, half of the time, high-yield bond issuers are firms involved in risky businesses. It appears that foreign investors are willing to finance risky Canadian firms.
The financial system is not influenced only by regulation. As I have suggested several times, the system is also heavily influenced by market and international macroeconomic conditions. Research into how the Canadian financial structure evolves throughout a fi-nancial cycle might better assess the stance of the fifi-nancial system.
Future research must determine whether the current financial trend is beneficial to Canadian banks, or whether they would be better served by limiting their OBS activities.
Bibliography
Allen, F. and D. Gale. 2000. Comparing Financial Systems. London: The MIT Press. Alexopoulos, M. 2002. “Inflation and Technological Advancement in Financial Institu-tions.” University of Toronto. Photocopy.
Binhammer, H. 1993. “Money Banking and the Canadian Financial System.” Scarbor-ough: Nelson Canada.
Boyd, J. and M. Gertler. 1994. “Are Banks Dead? Or Are the Reports Greatly Exagger-ated?” Federal Reserve Bank of Minneapolis Quarterly Review, Summer 18(3): 2-23. Canada. Department of Finance. 1985. The Regulation of Canadian Financial
Institu-tions: Proposal for Discussion. Catalogue F 2-63/1995 (April).
Canada. Statistics Canada. 2001. Reporting Guide. Catalogue 5-6100-131.3:2001-01-18. Canada. Statistics Canada. 2002. The Daily 25 January 2002.
Chouinard, E. and Z. Lolani. 2001. “The Canadian Fixed-Income Market: Recent De-velopments and Outlook.” Bank of Canada Review (Winter): 15–25.
Crawford, A. 2002. “Trends in Productivity Growth in Canada.” Bank of Canada Review (Spring): 19–32.
Daniel, F., C. Freedman, and C. Goodlet. 1992. “Restructuring the Canadian Financial Industry.” Bank of Canada Review (Winter): 21–45.
D’Souza, C. and A. Lai. 2003. “Is Diversification Good for Bank Efficiency?” Bank of Canada, unpublished manuscript.
Engert, W., B. Fung, L. Nott, and J. Selody. 1999. “Restructuring the Canadian Finan-cial System: Explanations and Implications.” Prepared for the autumn meeting of G-10 central bank economists. Bank for International Settlements, May 1998.
Freedman, C. 1992. “Universal Banking: The Canadian View.” In Financial Regulation:
Changing the Rules of the Game, edited by D. Vittas, 369–90. Washington, D.C.: The
Freedman, C. 1998. The Canadian Banking System. Technical Report No. 81. Ottawa: Bank of Canada.
Freedman, C. and C. Goodlet. 1998. The Financial Services Sector: Past Changes and
Future Prospects. Technical Report No. 82. Ottawa: Bank of Canada. Journal of Financal Intermediation. 2001. Special Issue. 10 (3-4): 209-338.
Miville, M. and A. Bernier. 1999. “The Corporate Bond Market in Canada.” Bank of
Canada Review (Autumn): 3–8.
Olson, M. 2002. “A Look at the Banking Industry in 2002.” Speech to the 107th annual convention of the Maryland Bankers Association, Palm Beach, Florida, 21 May.
OSFI. 2002. “What it Means to be Regulated.” The Office of the Superintendent of Financial Institutions. Available at http://www.osfi-bsif.gc.ca/eng/how/what/index.asp. Stiroh, K. 2002. “Diversification in Banking: Is Noninterest Income the Answer?” Fed-eral Reserve Bank of New York.
Stiroh, K. and A. Rumble. 2003. “Diversification in Banking: Evidence for U.S. Bank Holding Companies.” Federal Reserve Bank of New York. Photocopy.
United States of America. Federal Reserve Bank of Atlanta. 2002. EconSouth. First Quarter.
Appendix A: Data Sources and Equations
All the data discussed are taken from the Bank of Canada Banking and Financial
Statistics.
The data refer to non-financial businesses (corporations) only. Each component or cat-egory under review is carefully determined by adding and/or subtracting all relevant parts. For example, in the case of sources of external funds for non-financial businesses (section A.1), the Loans category is constructed by adding total short-term business credit minus total commercial paper issued by non-financial corporations plus other business credit and subtracting securitization, bonds, debentures, equity, and warrants. If necessary, the component Other is also constructed by subtracting all parts under review from the ob-served aggregate of all components (total), to ensure that all components add up to 100 per cent. The data are normally reported over the span of 37 or 33 years, beginning in 1965 or 1969 and ending in the first quarter of 2002. The only two exceptions are the figures of securitization and non-interest income, where the data are not available before 1990 and 1983, respectively.
When used, the shares in percentage terms of each presented part are determined using the following equation:
(Component under review / Total of all components) ∗ 100
Some of the series do not go all the way back to 1969. Those series are backcasted as described in the subsections below.
A.1: Shares of Non-Financial Business Loans Extended by Financial
Institutions (In Canadian Dollars)
Chartered Banks:
B2300 + B2312 + B2313 + B2303 + B2308 • B2300 - Business loans at chartered banks
• B2312 - Chartered bank foreign currency loans to residents • B2313 - Banker’s acceptances
• B2303 - Non-residential mortgages at chartered banks (Backcasted series) • B2308 - Leasing receivables at chartered banks (Backcasted series)
The backcast for B2303 is based on an average growth rate of 1.66 per cent computed from the initial date of the series up to December 1979.
The backcast for B2308 is constructed by using an average growth of 2.97 per cent (the average growth rates from the initial date of the series up to December 1979).
Trust and Mortgage Loan Companies:
Short-term business credit at trust and mortgage loan companies + B2304 + B2309 • Short-term business credit - provided by the Bank of Canada for internal use only • B2304 - Non-residential mortgages at trust and mortgage loan companies (Backcasted
series)
• B2309 - Leasing receivables at trust and mortgage loan companies (Backcasted series) The backcast for B2304 is constructed using an average growth of 1.67 per cent by ob-serving the average growth rates over the period January 1973 to December 1979. The backcast for B2309 is constructed using an average growth of 2 per cent by observing the average growth rates over the period January 1984 to December 1989.
Non-Depository Credit Intermediaries: B2333 + B2334 + B2335
• B2333 - Business loans at non-depository credit
• B2334 - Non-residential mortgages at non-depository credit intermediaries
• B2335 - Leasing receivables at non-depository credit intermediaries (Backcasted series) The backcast for B2335 is constructed using an average growth of 0.84 per cent by ob-serving the average growth rates over the period February 1976 to December 1979.
Credit Unions and Caisses Populaires:
Short-term business credit at credit unions and caisses populaires + B2305
• Short-term business credit - provided by the Bank of Canada for internal use only • B2305 - Non-residential mortgages at credit unions and caisses populaires
Life Insurance Companies: B2306
A.2: Sources of External Funds for Canadian Non-Financial Businesses
Loans:
B2317 - B2329 - B2330 + B155 - B2318 - B2319 - B2332 • B2317 - Total short-term business credit
• B2329 - Total commercial paper issued by non-financial corporations
• B2330 - Special-purpose corporations - securitization (Short-term business credit) • B155 - Other business credit
• B2318 - Bonds and debentures • B2319 - Equity and warrants
• B2332 - Special-purpose corporations - securitization (Other business credit)
Bonds:
B2318 + B2329
• B2318 - Bonds and debentures
• B2329 - Commercial paper issued by non-financial corporations
Stocks:
• B2319 - Equity and warrants
Other:
B2320 - Loans - Bonds - Stocks • B2320 - Total business credit
A.3: Direct/Indirect Lending
Direct:
B2318 + B2319
• B2318 - Bonds and debentures • B2319 - Equity and warrants
Indirect:
B2317 - B2329 + B155 -B2318 - B2319 - B2330 - B2332 • B2317 - Total short-term business credit
• B2329 - Total commercial paper issued by non-financial corporations • B155 - Other business credit
• B2318 - Bonds and debentures • B2319 - Equity and warrants
• B2330 - Special-purpose corporations - securitization (Short-term business credit) • B2332 - Special-purpose corporations - securitization (Other business credit)
TSE 300 Composite Index Provided by the Bank of Canada
A.4: Total Assets, Credit Equivalent, and Commercial Loans
Ex-tended by Financial Intermediaries as a Percentage of Nominal
Gross Domestic Product
Assets:
I subtract the two financial institutions (MBNA and AMEX), to avoid double-counting. Those two institutions are already reported in the total assets of non-depository credit intermediaries. All data on total assets are for domestic total assets, and come from Statistics Canada, unless otherwise noted.
(B20 - (MBNA + AMEX) + B672 + B4054 + B2150 + B4027 + B4046 + Total assets of investment funds)/D14816
• B20 - Total assets of non-depository credit intermediation • MBNA + AMEX
• B672 - Total assets of chartered banks, worldwide (Bank of Canada data) • B4054 - Total assets of trust and mortgage loan companies
• B2150 - Total assets of local credit unions and caisses populaires
• B4027 - Total assets of life insurers (including accident and sickness branches) • B4046 - Total assets of segregated funds
• Total assets of investment funds - Bank of Canada data • D14816 - Gross domestic product at market prices
Loans:
(B2317 - B2329 + B155 - B2318 - B2319 - B2330 - B2332)/D14816 • B2317 - Total short-term business credit
• B2329 - Total commercial paper issued by non-financial corporations • B155 - Other business credit
• B2318 - Bonds and debentures • B2319 - Equity and warrants
• B2330 - Special-purpose corporations - securitization (Short-term business credit) • B2332 - Special-purpose corporations - securitization (Other business credit) • D14816 - Gross domestic product at market prices
Credit Equivalent:
Noninterest income / (Total interest income including dividends Total interest expense -Charge for impairment)
• Non-interest income - From Consolidated Statement of Income, provided by the Bank of Canada
• Total interest income, including dividends - From Consolidated Statement of Income pro-vided by the Bank of Canada
• Total interest expense - From Consolidated Statement of Income provided by the Bank of Canada
• Charge for impairment - From Consolidated Statement of Income provided by the Bank of Canada
A.5: Non- and Net Interest Income
The series listed below are from Consolidated Statement of Income provided by the Bank of Canada.
Non-Interest Income:
Provided by the Bank of Canada Net Interest Income:
Provided by the Bank of Canada
A.6: Short-Term and Other Business Credit Securitization
B2330 + B2332
• B2330 - Special-purpose corporations - securitization (Short-term business credit) • B2332 - Special-purpose corporations - securitization (Other business credit)
A.7: Gross New Issues of Bonds and Stocks by Non-Financial
Businesses
The series listed below are from the Bank of Canada, unpublished. In Canada:
• Non-financial corporate preferred shares issued in Canada
• Non-financial corporate common shares and warrants issued in Canada • Non-financial corporate bonds issued in Canada
In the United States:
• Non-financial corporate preferred shares issued in the United States
• Non-financial corporate common shares and warrants issued in the United States • Non-financial corporate bonds issued in the United States
Elsewhere:
• Non-financial corporate preferred shares issued elsewhere
• Non-financial corporate common shares and warrants issued elsewhere • Non-financial corporate bonds issued elsewhere
A.8: Gross New Issues of Stocks by Non-Financial Businesses
The series listed below are from the Bank of Canada, unpublished. In Canada:
• Non-financial corporate preferred shares issued in Canada
• Non-financial corporate common shares and warrants issued in Canada
In the United States:
• Non-financial corporate preferred shares issued in the United States
• Non-financial corporate common shares and warrants issued in the United States
Elsewhere:
• Non-financial corporate preferred shares issued elsewhere
• Non-financial corporate common shares and warrants issued elsewhere
A.9: Gross New Issues of Bonds by Non-Financial Businesses
The series listed below are from the Bank of Canada, unpublished. In Canada:
• Non-financial corporate bonds issued in Canada
In the United States:
• Non-financial corporate bonds issued in the United States
Elsewhere:
A.10: Total Loans at Chartered Banks: Canadian Dollars vs
Foreign Currency
The series listed in the first two categories below are from the Consolidated Monthly Balance Sheet provided by the Bank of Canada.
Chartered Banks’ Loans in Canadian Dollars:
(Total leasing receivables from non-mortgage loans - Foreign currency leasing receivables from non-mortgage loans) + (Total non-mortgage loans to individuals and others for business pur-poses - Foreign currency non-mortgage loans to individuals and others for business purpur-poses) + (Total reversed repurchased agreements from non-mortgage loans - Foreign currency reversed repurchased agreements from non-mortgage loans) + (Total non-residential mortgages - Foreign currency non-residential mortgages)
Chartered Banks’ Loans in Foreign Currency:
Foreign currency leasing receivables from non-mortgage loans + Foreign currency non-mortgage loans to individuals and others for business purposes + Foreign currency reversed repurchased agreements from non-mortgage loans + Foreign currency non-residential mortgages
Total Foreign Currency Loans to Canadian Residents:
• B498 - Total foreign currency loans to Canadian residents
A.11: Total Liabilities at Chartered Banks: Canadian Dollars/Foreign
Currency
(B650 - B692 - B693 - B694 - B696) / B675 • B650 - Total chartered banks’ liabilities
• B692 - Common capital stock of shareholders’ equity • B693 - Preferred capital stock of shareholders’ equity • B694 - Contributed surplus of shareholders’ equity • B696 - Retained earnings of shareholders’ equity • B675 - Total foreign currency liabilities
Appendix B: Definitions
Swap:
Contractual agreement in which two counterparties agree to exchange streams of pay-ments over time.
(Source: Klein and Lederman 1994.) “The Handbook of Derivatives and Synthetics,” Probus Publishing Company.
Currency Swap:
The counterparties exchange specific amounts of two different currencies at the outset and repay over time, according to a predetermined rule that reflects both interest payments and amortization of principal.
(Source: Klein and Lederman 1994.) Non-interest income:
Non-interest income covers all sources of revenue other than interest charges. Examples include revenue from brokerage and other securities services, credit services, net invest-ment securities gains and losses, trading income, deposit and payinvest-ment service charges, mutual fund management, card services, foreign exchange non-trading, insurance, securi-tization revenues, trans-sectoral income other than interest, and earnings or loss from the sale of assets.
(Source: Canada. Statistics Canada 2001.) Loan-loss provisions:
A loan-loss provision is essentially recognition by a financial institution that it is unlikely to receive all the money owed to it by a specific customer or customers. In Canada, The Office of the Superintendent of Financial Institutions (OSFI) monitors institutions to ensure that they maintain sufficient provisions to recognize likely losses. (Source: OSFI 2002. “What it Means to be Regulated.” The Office of the Superintendent of Financial Institutions. Available at http://www.osfi-bsif.gc.ca/eng/how/what/index.asp)
Bank of Canada Working Papers
Documents de travail de la Banque du Canada
Working papers are generally published in the language of the author, with an abstract in both official languages. Les documents de travail sont publiés généralement dans la langue utilisée par les auteurs; ils sont
cependant précédés d’un résumé bilingue.
Copies and a complete list of working papers are available from:
Pour obtenir des exemplaires et une liste complète des documents de travail, prière de s’adresser à:
Publications Distribution, Bank of Canada Diffusion des publications, Banque du Canada
2004
2004-25 Money Demand and Economic Uncertainty J. Atta-Mensah
2004-24 Competition in Banking: A Review of the Literature C.A. Northcott
2004-23 Convergence of Government Bond Yields in the Euro Zone:
The Role of Policy Harmonization D. Côté and C. Graham
2004-22 Financial Conditions Indexes for Canada C. Gauthier, C. Graham, and Y. Liu
2004-21 Exchange Rate Pass-Through and the Inflation Environment
in Industrialized Countries: An Empirical Investigation J. Bailliu and E. Fujii
2004-20 Commodity-Linked Bonds: A Potential Means for
Less-Developed Countries to Raise Foreign Capital J. Atta-Mensah
2004-19 Translog ou Cobb-Douglas? Le rôle des durées
d’utilisation des facteurs E. Heyer, F. Pelgrin and A. Sylvain
2004-18 When Bad Things Happen to Good Banks:
Contagious Bank Runs and Currency Crises R. Solomon
2004-17 International Cross-Listing and the Bonding Hypothesis M. King and D. Segal
2004-16 The Effect of Economic News on Bond Market Liquidity C. D’Souza and C. Gaa
2004-15 The Bank of Canada’s Business Outlook
Survey: An Assessment M. Martin and C. Papile
2004-14 National Saving–Investment Dynamics and
International Capital Mobility F. Pelgrin and S. Schich
2004-13 Contraintes de liquidité et capital humain
dans une petite économie ouverte F. Pelgrin
2004-12 Durées d’utilisation des facteurs et fonction de
production : une estimation par la méthode des
moments généralisés en système E. Heyer, F. Pelgrin, and A. Sylvain
2004-11 Estimating New Keynesian Phillips Curves
Using Exact Methods L. Khalaf and M. Kichian