APPLICATION OF ALGORITHM OF RUNGE
RECOVERY IN OIL WELLS OF NIGER DELTA IN NIGERIA
Department of Chemical/Petrochemical Engineering, Rivers State University of Science and Technology, Nkpolu, P.M.B. 5080, Port Harcourt, Nigeria.
ARTICLE INFO ABSTRACT
This paper focuses on the mechanisms using algorithm of Runge
predicting the microbial entrained oil recovery (MEOR) in Nigeria Delta Oil wells. The microorganisms isolated and identified was cultured as well inoculated into
up to examine the degradation of the heaver hydrocarbon, which leads to the production of lighter hydrocarbon considering properties of the enzymes involved in the biodegradation of the heavier hydrocarbon leading to formation of lig
build up the pressure of the reservoir in most circumstances. The dynamic models developed in this paper were simulated to study the behaviour of the system. The algorithm of Runge method
models developed. The functional parameters that influence the process were evaluated and a series of test has been carried out in which petroleum hydrocarbon was used as t
component. All test results revealed that microorganisms are capable of reactivity the oil wells, suggestion that the mechanism of the MEOR process is basically, a simple combination of biodegradation parameters and factors that influence biodeg
INTRODUCTION
The idea of oil recovery using microorganisms has attracted a lot of research interest. The technique varies ranging from injecting dead microbes at various concentrations through sandstones cores aim at achieving the desired plugging. Such investigation as conducted by various research groups yielded little results (Zobell, 1974; Soko, 1987; Jack and Diblasio, 1985; Silfanus, 2001; Bryant and Barchfield, 1989; Aksu, 2005; Acuner and Dilek, 2004; Huo, Kim and Chiang, 1999 and Myslak, 1998). However, one may ask what is the usefulness of the micro organisms? In the Niger Delta, there are several wells that have been abandoned due to low pressure. The low pressure is experienced due to heavier hydrocarbon left over in the reservoir (oil well). The microorganisms isolated identified and characterized are culture and re-introduced into the oil well. Furthermore, when microorganisms are injected into the system (oil well), biochemical processes take place such as: aerobic will oxidize the heavier hydrocarbons to lighter hydrocarbons, both liqu and gases. The gases will generate another pressure and the micro organisms will be left in the oil well for some time so that the bonds of heavier hydrocarbons are broken as well as anaerobic and facultative ascorbic (Rajaguru, Kalaisler, Palanivel, Sulbburam, 2000; Adedayo, Javadpour, Taylor, Aderson, Moo-Young, 2004 and Hsneh and Chen, 2007).
*Corresponding author:[email protected]
ISSN: 0975-833X
International Journal of Current Research Vol. 3, Issue,
Article History:
Received 05th
September, 2011 Received in revised form 07th
October, 2011 Accepted 20th
November, 2011 Published online 31th
December, 2011
Key words:
Runge-Kutta method, MEOR,
Enzymes, Biodegradation,
RESEARCH ARTICLE
APPLICATION OF ALGORITHM OF RUNGE-KUTTA METHOD IN MICROBIAL ENTRAINED OIL
RECOVERY IN OIL WELLS OF NIGER DELTA IN NIGERIA
Ukpaka, C.P.
Department of Chemical/Petrochemical Engineering, Rivers State University of Science and Technology, Nkpolu, P.M.B. 5080, Port Harcourt, Nigeria.
ABSTRACT
This paper focuses on the mechanisms using algorithm of Runge-Kutta method in monitoring and predicting the microbial entrained oil recovery (MEOR) in Nigeria Delta Oil wells. The microorganisms isolated and identified was cultured as well inoculated into
up to examine the degradation of the heaver hydrocarbon, which leads to the production of lighter hydrocarbon considering properties of the enzymes involved in the biodegradation of the heavier hydrocarbon leading to formation of lighter hydrocarbon in the oil, it is suggested that the process build up the pressure of the reservoir in most circumstances. The dynamic models developed in this paper were simulated to study the behaviour of the system. The algorithm of Runge method was applied in solving the numerical integral expression obtained from the dynamic models developed. The functional parameters that influence the process were evaluated and a series of test has been carried out in which petroleum hydrocarbon was used as t
component. All test results revealed that microorganisms are capable of reactivity the oil wells, suggestion that the mechanism of the MEOR process is basically, a simple combination of biodegradation parameters and factors that influence biodegradation process.
Copy Right, IJCR, 2011, Academic Journals
microorganisms has attracted a lot of research interest. The technique varies ranging from injecting dead microbes at various concentrations through sandstones cores aim at achieving the desired plugging. Such groups yielded little results (Zobell, 1974; Soko, 1987; Jack and Diblasio, 1985; Silfanus, 2001; Bryant and Barchfield, 1989; Aksu, 2005; Acuner and Dilek, 2004; Huo, Kim and Chiang, 1999 and Myslak, 1998). However, one may ask what is the the micro organisms? In the Niger Delta, there are several wells that have been abandoned due to low pressure. The low pressure is experienced due to heavier hydrocarbon left over in the reservoir (oil well). The racterized are introduced into the oil well. Furthermore, when microorganisms are injected into the system (oil well), biochemical processes take place such as: aerobic will oxidize the heavier hydrocarbons to lighter hydrocarbons, both liquid and gases. The gases will generate another pressure and the micro organisms will be left in the oil well for some time so that the bonds of heavier hydrocarbons are broken as well as anaerobic and facultative ascorbic (Rajaguru, Kalaisler, lbburam, 2000; Adedayo, Javadpour, Taylor,
Young, 2004 and Hsneh and Chen, 2007).
The need to examine the principle of operation of microbial enhanced oil recovery shows that an oil well left
period of time can still produce oil. Also, the study has enabled one to know that other lighter hydrocarbons can be produced from the microbial decomposition of heavier hydrocarbons in an oil well. However, various researches have been conducted on the characteristics of oil well in other to decide the suitable micro-organism to perform the function of MEOR in non-producing oil wells in Niger Delta Area of Nigeria. The purpose of this study is to model the microbial activity on oil well for dynamic characterization of influence of microbial entrained oil recovery and applying the suitable mathematical approach in solving the dynamic model for simulation.
The study has several contributions to life and society. The following are contributions to knowledge: which includes, maximizing production of an oil well, to know suitable microorganism for a particular oil well and to reactivate the dead oil well by the action of microorganism. The study was aimed on the dynamics model for characterizing an
for the influence of microbial entrained oil recovery and, the solution of the dynamic model. Studies for implementation of various project conducted has been a major concern to resources, particularly addressing issue such as selecting the microbes for the degradation of petroleum hydrocarbon and associated compound (Maier, Kandelbauer, Ertacher, Cavaco Paulo, Gubitz, 2004; Wong, Yuen, 1990; Mali Mahajan, Patil,
ternational Journal of Current Research Vol. 3, Issue, 12, pp.126-132, December, 2011
INTERNATIONAL
OF CURRENT RESEARCH
KUTTA METHOD IN MICROBIAL ENTRAINED OIL
Department of Chemical/Petrochemical Engineering, Rivers State University of Science and Technology,
Kutta method in monitoring and predicting the microbial entrained oil recovery (MEOR) in Nigeria Delta Oil wells. The microorganisms isolated and identified was cultured as well inoculated into the oil bioreactor set up to examine the degradation of the heaver hydrocarbon, which leads to the production of lighter hydrocarbon considering properties of the enzymes involved in the biodegradation of the heavier hter hydrocarbon in the oil, it is suggested that the process build up the pressure of the reservoir in most circumstances. The dynamic models developed in this paper were simulated to study the behaviour of the system. The algorithm of Runge-Kutta was applied in solving the numerical integral expression obtained from the dynamic models developed. The functional parameters that influence the process were evaluated and a series of test has been carried out in which petroleum hydrocarbon was used as the testing component. All test results revealed that microorganisms are capable of reactivity the oil wells, suggestion that the mechanism of the MEOR process is basically, a simple combination of
radation process.
Copy Right, IJCR, 2011, Academic Journals. All rights reserved.
The need to examine the principle of operation of microbial enhanced oil recovery shows that an oil well left over for some period of time can still produce oil. Also, the study has enabled one to know that other lighter hydrocarbons can be produced from the microbial decomposition of heavier hydrocarbons in an oil well. However, various researches have cted on the characteristics of oil well in other to organism to perform the function of producing oil wells in Niger Delta Area of Nigeria. The purpose of this study is to model the microbial ynamic characterization of influence of microbial entrained oil recovery and applying the suitable mathematical approach in solving the dynamic model for
The study has several contributions to life and society. The to knowledge: which includes, maximizing production of an oil well, to know suitable microorganism for a particular oil well and to reactivate the dead oil well by the action of microorganism. The study was aimed on the dynamics model for characterizing an oil well for the influence of microbial entrained oil recovery and, the solution of the dynamic model. Studies for implementation of various project conducted has been a major concern to resources, particularly addressing issue such as selecting the bes for the degradation of petroleum hydrocarbon and associated compound (Maier, Kandelbauer, Ertacher, Cavaco-Paulo, Gubitz, 2004; Wong, Yuen, 1990; Mali Mahajan, Patil,
Kulkami, 2000; Tan, Berger, Slenders, Svileiskaya, Letting, 2000; Wade, 2002; Sonakya, Raizada, Hausner, Wilderer, 2007; Song and Kataya Ma, 2005; Tringe and Rubin, 2005; Vitas, Sabate, Espuny and Solanas, 2005; Wawrik, Kerkhof, Kukur and Zylstra, 2005; Singleton, Furlong; Rathbun; Whitman, 2001; Sambrook, Fristseh and Manialis, 1989). Premuzic and his group used different microbial formulation of thermophilic, acid- and chemophilic, under various experimental conditions of temperature (30 °C — 80 °C). The result of their work revealed that pressure of 12.8 mpa and pH range of 1.5 — 7.5. There are changes in both physical and chemical properties of crude oil. These changes include sulphur and nitrogen associated compounds and various groups. These changes were not limited to lighter hydrocarbons only but also heavy hydrocarbons (Khehra, Sami, Sharma, Vhadhas and Chimno, 2005; Zhang, Chen, Chen, Chang, Hsueh, 2010; Khaild, Arshad and Crowley, 2009; Ghodake, Jadhar, Dawkar, Govindwar 2006, Mazzoli, Pressione, Giuffrida, Fatton and Barello, 2007).
Although projects on microbial enhance oil recovery may seem to be straight forward, there has been a lot of failures from field test. These failures are attributed to none existence of proper strategy such as reservoir simulation that could predict the microbial metabolic activities. However, another area of interest is the selective plugging of higher permeability zones where slime-producing bacteria where found suitable. T his study gave an insight of the plugging technique, despite the failure of the field test (Grifohi, Bazziealupo, Di-Serio, Funcelli and Fani, 1995; Banat, Nigam, Singh and Marchant, 19996; Kumar, Tamura, Jakobsen, Nei, 2001; Moutaouakkil, Zeroual, Zohra, Talbi and Lee, 2003; Lee, Malthews, Paviostathis, 2005). However, the efforts in improving microbially enhanced oil recovery like any of the technique needs to be encourage in view of the economic viability and friendliness (O’ Donnell, Young, Rusbton, Shirley, Crawford, 2007; Pearson, Krannz, Sessions, Dekas, Leavilt, Edwanls, 2008; Roling, Milner, Jones, Fratepietro, Swannell, Danel and Head, 2004; Sanche, Ferreral, Vignes, Gareiade Oteyza, Gnmalt, Mas, 2006; Tyson, Chapman, Hugenholtz, Allen, Ram, Rechardson, Solovyer, Rubin, Rokhsar, Banfield 2004 and Cheng and Kinkle, 2001; Bryant and Burchfield, 1989; Jack, and Diblasio, 1985; Ukpaka, 2011; Silfanus, 2008.
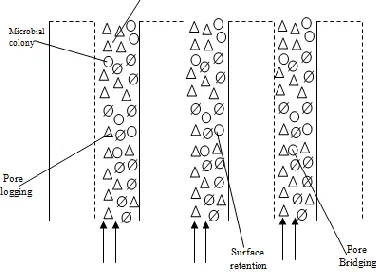
However, the plugging depends on the average throat size of the pore in the formation, the microbe and the aggregates. The diagram is shown below: Porous The question of plugging of the porous media and the transport phenomena of microbes in the subsurface cannot be separated. T his could be explain by the differential movement of the microbes in the columns of the porous media which ash severally been demonstrated in sand filters, soil and sandstone (Altas, 1975; Bento, Camargo, Okeke and Frankenberger, 2005; Ferrari, Binnerup, Gillings, 2005; Fierer and Jackson, 2006; Guenero, and Berlanga, 2006; Hack, Zechmeister-Boltensterm, Bodrossy and Sessitseh, 2004; Sokol, 1987; Steven and Raymond, 2007 and Jenneman, Knapp, Melnemey, menzie and Revue, 1984). The sorption and nonsorption of the microbes is associated with forces which could be repulsive or attractive and depends on the type of microbes and adsorbent surface ((Hamamura, Olson, Ward and Inskeep, 2006; Handelsman, 2004; Hill, Walsh, Harris, Moffelt, 2003; Huritigand San Schastian, 2005; Kaeberlein, Lewis, Eptem, 2002; Lin, Chung, Kim, Choi, Jang, Chung,
[image:2.612.331.519.86.222.2]CLo and Lee, 2005 and Margesin, Labbe, Schinner, Greer and Whyte, 2003).
Fig. 1: Plugging in the column of the porous medial microbe
Fig. 2: Forces of sorption
However, a close study of adsorption showed that apart from the surface energies or charges, several forces are responsible for this process. Bitton and Marshall in investigating these force explained that the hydro dynamic and diffusion forces are required to bring the particles to have contact to the sorption surface. A relationship of the force can be illustrated in figure
MATERIALS AND METHODS
Materials
The following materials were used in carrying out the research work on the development of mathematical model that will characterize an oil well upon the influence of microbial entrained oil recovery. Reactor Oil well, Microbes, Water and Petroleum product in oil well
Selecting Microbes
[image:2.612.320.538.259.422.2]pH range of 1.5-7.5 there are changes in both physical and chemical properties of the crude oil. The microbes used in carrying out the investigation were isolated and identified based on the samples collected from the various oil well. The microbial culture was done using the Buchana and Gibbons, (1974).
Determination of Microbial and Substrate Concentration
The determination of biomass (microbial) and substrate left after the action of microbes were done using the dynamic models at a particular time. These models were obtained from first principles (material and energy balance) and oil well system. The dynamic models simulated using visual basic 6.0 compiler.
Mathematical Model Development
When the microbes are added to the oil well to enhance production, the microbes reduces the heavy hydrocarbons into lighter once by biodegradation. However, biodegradation is the removal of organic compounds from oil well by using micro-organism that feeds on the organic compounds. During the process, mineralization, bioaccumulation and polymerization take place. As the micro-organism is inoculated into the oil well containing the necessary nutrients with suitable temperature, pH and pressure, it converts organic substrate into carbon dioxide, and energy is released. At the same time, some of the carbon in the organic substrate was convert to cell constituent, which results to increase in microbial population. As the organic substrate degrades, there is a net loss of live cell mass. Furthermore, the biodegradation process pathway would be: Micro-organism + organic substance - inorganic + new cell (formed) + energy. At intermediate complex is formed during bio-degradation process, is broken down to new cell mass and other products. The biodegradation path could be expressed as:
X
(
X
.
S
)
X
Metabolite (1)The accumulation of the biomass on the pore surface is a common experience in microbial enhanced oil recovery. This has been attributed to the biomass growth, retention and detachment. The last two terms are associated with the planktonic phase and sessile phase. Considering the sessile phase Zany presented a biomass conservation equation as follows:
BS d r
B
R
R
R
r
P
q
T
1
(2)
Models of an Oil Well System
Microorganism in activated system like that of sludge experience death at all stages, even at the exponential phase. The crease in the microbial growth rate is proportional tot eh microbial concentration. The first order equation for the general rate of biomass growth is expressed as:
X
R
t
d
x
d
x
(3)The specific growth rate
is defined by Monod as;
s s
s
C
K
C
max
(4)In biochemical process, a portion of the substrate is used for microbial growth. Hence, in the substrate balance one can make use of the yield, defined as:
consumed
ce
subs
of
mass
formed
cell
of
mass
Y
tan
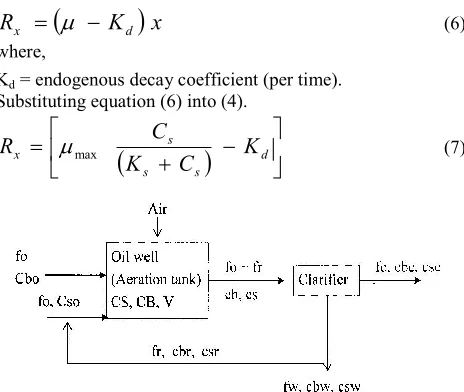
(5)However, the endogenous decay is the energy required for cell maintenance, death and predation that takes place along side with growth. The net growth rate will be given as:
K
x
R
x
d (6)where,
Kd = endogenous decay coefficient (per time). Substituting equation (6) into (4).
ds s
s
x
K
C
K
C
[image:3.612.316.548.210.406.2]R
max (7)Fig. 3: Hypothetical representation of an oil well system
where, fo, cso, C8o are he inlet flow rate, initial concentration substrate and biomass.
V = volume of the rector
C, CB = Concentration of substrate and biomass Fe, Cse, Cbe = effluent flow rate, concentration of substrate and biomass in the effluent stream.
Fw, Csw, Cbw = flow rate of the waste stream, concentration of the substrate and biomass in the waste stream. Fr, Csr, Cbr = flow rate of the recycled sludge, concentrating of the substrate and biomass in the recycled sludge. Also, no microbial activities occur in the clarifier.
Mass Balance
The principle of conservation of mass is used to determine the component mass balance for the substrate and biomass and it is given as
Mass Balance for Microbes (Biomass)
V R C f f C F C f t d
C V
CB B r o r R Bo o b
It is assumed that the biomass in the inlet stream is sterile, so CBO = 0
V R C f f C F C f t d C V CB B r o r R Bo o b d
( ) (10)
Let
o R o
f
F
f
V
,
and dividing equation (7) by fo(11)
C
Br
1
C
B
R
CB (12)Where,
and
are the hydraulic retention time and recycle ratio respectively.Therefore, equation (12) can be written in terms of changes in the hydraulic retention time, which gives the expression in equation (13).
CB B Br bR
C
C
t
d
dC
1
(13)Where RCB = Rx, which is the rate of reaction of the biomass (microbes).
Substitute equation (7) into (13), the equation becomes.
x Kd Cb K Cb C C t d dC s B Br b max 1 (14)
Mass Balance for Substrate (A Hydrocarbons)
f C
f f
C R VC f t d dC V CS s R o sr R so o
s
(15)
The biodegradation takes place in the oil well. That means the concentration of the substrate leaving the oil well is the same as that in the clarifier system and effluent i.e Cs = CSR = SCE
V
R
C
f
C
f
t
d
dc
V
cs s o so os
(16)
Divide equation 12 by V
cs s o so o s
R
V
C
f
C
f
t
d
dC
(17)
so s
cso s
R
C
C
V
f
t
d
dC
(18)Where, Rcs is defined as the maximum rate of the substrate (oil or hydrocarbons) utilization per mass of the biomass (microbes).
y
x
R
cs
(19)Combining equations (19) and (4) we have
s s s csC
K
C
y
x
R
max (20)Substitute equation (20) into (18), the equation becomes:
s s s s so o s C K Y X C C C V f t d dC max )(
(21)Equations (14) and (21) are dynamic models for the concentration of the biomass (microbes) and substrate (hydrocarbon) for the oil well.
Solution Technique
The numerical integral of the developed models can be taken when CBo, CBr, CSo, Kd, fo, fR, V, Ks and
max as well as thesteady state values for the ordinary differential equations are given and fourth order Runge Kutta method is used to solve the dynamic models.
Algorithm of Runge-Kutta Method
The algorithm computes the solution of the initial value problems as:
,
)
(
)
,
(
1h
at
y
x
y
and
y
x
f
o
o
(22)So that x1 = xo + h, x2 = xo + 2h, (23) x3 = xo + 3h … Xn = Xo + nh (24)
where, f is such function or equation developed with solution on the interval (Xo, Xn) for input: Initial values xo, yo at step size, h for number of steps n. For output: approximate yn +1n = xn + nh
where
n = 0,1,2 … n -1 (25)
K1 = hf (xi,yi) (26)
K2 = hf(xi + h/2, yi + K
1
/2) (27)
K3 = hf (xi + h/2, yi + K
2
/2) (28) K2 = hf (xi + h/2, yi + K3) (29) y1+1 = yi + 6/h (K1 + 2K2 + 2K3 + K4)(30)
xi+1 = xi + h (31)
where i is the number of iteration(s) and the models are solved using this algorithm for the visual Basic 6.0 program.
Obtained Parameters
[image:4.612.343.520.564.658.2]The tables below shows the data or parameter needed to compute the dynamic models in the computer program.
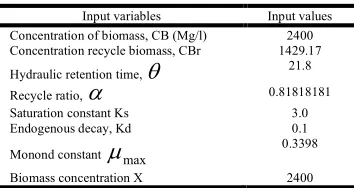
Table 1: Inputs for Biomass (microbes)
Input variables Input values Concentration of biomass, CB (Mg/l) 2400 Concentration recycle biomass, CBr 1429.17
Hydraulic retention time,
21.8 Recycle ratio,
0.81818181 Saturation constant Ks 3.0Endogenous decay, Kd 0.1
Monond constant
max 0.3398Biomass concentration X 2400
RESULTS AND DISCUSSION
the model was close to that of plant data obtained. The model prediction shows a deviation of 3.10% from the plant data obtained. Table 4 below shows the model result with plant data, as well as percentage deviation.
Table 2: Input for substrate (hydrocarbons)
Input variables Input values
Flow rate of substrate fo 0.055
Volume of oil well, V (L) 1.2
Initial concentration of substrate, CSo (Mg/L) 250 Concentration of substrate, Cs (mg/L) 250
Saturation constant Ks 3.0
Monod constant
max 0.3398Yield coefficient y (mg cell/ mg substrate) 1.2 Biomass concentration X
Table 3: Plant data with microbial growth
Inputs Influent
concentration (mg/L)
Plantdata (mg/L)
Hydrocarbon 250 0.050
Biomass 2400
Table 4: Comparison of Model Results with Plant Data
Inputs Influent concentration
(mg/L)
Model prediction of the effluent (Mg/L)
Deviation (%)
Plant data (mg/L) Hydrocarbons
Biomass
250 2400
0.0516 3.10 0.050
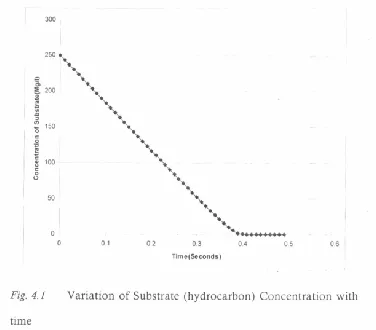
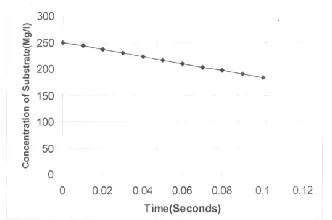
The result shows that the substrate (oil) concentration decreases from initial value of 250 mg/L at time, t = 0 to 0.0516 mg/L at time, t = 0.49 hours. At this stage, the concentration of the hydrocarbon substrate is low meaning that the microbes or microorganism have converted the bond of heavy hydrocarbons in oil well to lighter hydrocarbons. These lighter hydrocarbons which are gases will generate pressure so that the oil well can produce again. The products of oil well are water, gases and oil (hydrocarbons).
Effects of Microbes on Substrate Concentration
The simulation of the models shows that as time increase, the substrate or hydrocarbon concentration decreases, Figure 4 shows the variation of substrate (hydrocarbon) concentration with time.
However, the decrease in concentration of substrate or hydrocarbon is as a result of the action of the microbes, what makes the oil well not to produce normally is too much heavy
hydrocarbon left in the oil well. The microbes were injected into the oil well and allowed for some time to degrade or breakdown the heavy bonds of the hydrocarbons to a lighter one. At time, t = 0.45 hour(s), the concentration was slightly constant.
Effectiveness of Biomass (Microbes)
The result of the model shows that as time increases, the biomass concentration increases as well. Figure 5 shows the variation of Biomass (microbes) concentration with time.
Fig. 5: Variation of Biomass (Microbes) Concentration with time
However, the increase in concentration of biomass (microbe) with increase in time is due to conversion of the hydrocarbon (substrate) into carbon dioxide and energy is release. A t the same time, the microbes concern some of the carbon in the organic substrate to cell constituent which results to increase in microbial population.
Model Simulation
The dynamic models developed were simulated to study the behaviour of the system. The effect varying saturation constant (Ks) to see how concentration will change with time for substrate (hydrocarbon) and biomass (microbes) was conducted (microbes).
Effect of Saturation Constant on Biomass Concentration with Time
[image:5.612.84.272.528.693.2]It was observed that as saturated constant (Ks) was increased to Ks = 4.0, the biomass concentration increased further with time. Figure 3 shows the effect of saturation constant on the biomass concentration with time.
[image:5.612.341.526.590.707.2]From the above graph, the increase in biomass concentration with time increases the microbial population, which means for the microbial population to increase so as to enhance biodegradation of the hydrocarbons (substrate), the saturation constant should be increased.
Effect of Saturation Constant on Substrate Concentration with Time
[image:6.612.81.247.203.313.2]It was also observed that as saturation constant (Ks) was changed to Ks = 4.0, the substrate (hydrocarbon) concentration decreases. Figure 7 shows the effect of saturation constant on the substrate concentration with time.
Figure 7: Effect of saturation constant on the Substrate Concentration with time
From the figure 7 above, the decrease in substrate concentration was as a result of increase in microbial population with increase instauration constant (Ks) to four more microbes now feed on the substrate with time.
Conclusion
Most oil wells are left over for years without production, not that these oil wells do not have needed hydrocarbons. However, these oil wells can be made to produce again with the influence of microbial entrained oil recovery, by this one means the use of microorganisms to enhance the biodegradation of some hydrocarbons in the oil well especially the heavy ones and also production of such oil well. Furthermore, two dynamic models were developed from first principle by applying material balance principle. Michael Menten enzyme kinetic model and biodegradation kinetics were also used in developing the models. Also, the models were solved by writing a programe with visual basic 6 - 0 compilers using the fourth order Runge Kutta algorithm. The result obtained from the model simulation was close to plant data obtained. The biomass (microbes) degrades the hydrocarbon from 250 mg/L at time, t = 0 to 0.0516 mg/L at time, t = 0.49 hours. The result shows that after 0.49 hours, the oil well was able to produce and the deviation was 3.10% from plant data.
Nomenclature
= pore fraction occupied by the retained biomass (dimensionless)PB = mass density of the biomass (mg/l) Rr = biomass retention (cell mg/day)
Rd = Biomass detachment (cell mg/day)
RBS = Biomass growth (cell mg/l3/day)
= nutrient (mg) = recycle ratio (dimensionless)
= oil (mg)
= hydraulic retention time (day-1)O = microbe (cell mg)
F0, FR, Fr = volumetric flow rate (m 3
/day0
x = cell mass/unit culture volume (cell mg/l)
Ks = Saturated constant (mg/l)
Cs = substrate concentration (mg/day) RS = specific rate of the substrate (mg/day)
S = substrate concentration (mg%)
max = maximum specific rate of microbial growth (cell mg/day)
= specific rate of microbial growth (cell
mg/day)
Rx = specific rate of the biomass (cell mg/day)
Kd = equilibrium constant of decay rate
Y = yield coefficient
REFERENCES
Acuner E, Dilek FB (2004). Treatment of Tectilon Yellow 2G
by Chiorella Vulgaris Process. Biochem., vol. 39, pp
623-631.
Aksu Z, Donmez G. (2005). Combined Effects of molasses Sucrose and Reactive dye on the Growth and dye Bioaccumulation Properties of Candida Tropicalis Process. Biochem., vol. 40, pp. 2443-2454.
Banat I. M, Nigam P. Singh D., Marchant R. (1996), Microbial Decolorization of Testile-Dye-Containing Effluents: A review Bioresour Technol., vol.58, pp. 217-227.
Bryant R. S. and Burchfield T. B. (1989), Review of Microbial Technology for improving oil Recovery, The William and Whisking, pp.82-90.
Buchana, R.E and Gibbons, N. E (1974), Bergey’s manual of determination Bacteriology (7th edition) Baltimore. The William and Whisking, p. 274.
Ghodake G., Jadhav S., Dawkar V., Govindwar S. (2009), Biodegradationof Diazo Dye Direct Brown MR by Acinetobacter Calcoaceticus NCIM 2890. Int Biodeterior
Biodegradation, vol.63, pp.433-439.
Hao O.J, Kim H; Chiang P.C (1990), Decolorization of wastewater. Critic Rev. Environ Sci. Technol, vol. 30, pp.449-505.
Hsueh C.C Chen B.Y. (2007), Comparative Study on Reaction Selectively of Azo Dye Decolorization by Pseudomonas Luteola. J. Hazard Mater vol.141, pp.842-849.
Jack T. R. and Diblasio E. (1985), Selective Plugging for Heavy Oil Recovery, Microbes and Oil recovery, Int.
Bioresource Journal eds. Zajic and Donaldson, vol.1 pp.
205 —212.
Jenneman, D.E. Knapp R.M, Melnemey, M. J. Menzie D. E., and Revue D.E. (1984). Experimental Sludgies of in-situ Microbial enhanced oil Recovery, SPD Journal, vol.32, no.4, pp.30-38.
Khalid A, Arshad M. Crowley D. E (2009), Biodegradation Potential of Pure and Mixed Bacterial Cultures for Removal of 4-Nitroanline from Textile Dye Wastewater Res., vol. 43: pp.1110-1116.
Dye Decolorization by Indigenous Decolorizers, Bioresour Technol, vol. 101: pp.2651-2656.
Kumar S. Amura K., Jakobsen I.B., Nei, M. (2001) MEGA2 Molecular Evolutionary Genetics Analysis Software,
Bionformatics vol.17, pp.1244-1245.
Lee Y.H., Matthews R.D., Pavlostathis S.G (2005) Biological Declorization of Reactive Anthraquinone and Phthalocyanine Dyes Under Various Oxidation Reduction Conditions. Water Environ Res, vol.78, pp.156-169. Maier J., Kandelbauer A., Erlacher A., Cavaco-Paulo A.,
Gubitz G.M. (2004). A New Alkali-Thermostable Azoreductase from Bacillus sp. Strain SF. Appl Environ
Microbiol, vol,70, pp.837-844.
Mali P.L., Mahajan M.M., Patil D.P., Kulkarni M.V., (2000), Biodecolorization of Members of Triphenylmethanes and
Azo Groups of Dyes J. Sci. Ind. Res. vol.59, pp.221-224.
Mazzoli R., Pessione E, Giuffrida M.G., Fatton P., Barello C., et al., (2007), Degradation of Aromatic Compounds by Acinetobacter Radioresistens S13: Growth Characteristics on Single Substrates and Mixtures. Arch Microbiol vol.188: pp.55-68.
Moutaouakkil A., Zeroual Y., Zohra Dzyri F., Talbi M., Lee, K. et al., (2003), Purification and Partial Characterization of Azoreductase From Enterobacter Agglomerans. Arch
Biochem Biophys, vol.413, pp.139-146.
Myslak, Bolt (1998), Occupational Exposure to Azo Dyes Risk of Bladder Cancer Zbl. Arbeitsmed, vol. 38: pp.310-321.
O’Donnell A.G Young I.M., Rushton S.P., Shirley M.D., Crawford J.W (2007) Viatualization, Modeling and Prediction in Soil Microbiology. Nation Rev. Microbial, vol.5, pp.689-699.
Ukpaka, C.P. (2011). Environmental Assessment of Petrochemical Wastewater discharge into Eleme River: A case study of Petrochemical Industry in Nigeria,
International Journal of Current Research vol.3, no.6,
pp.154-159.
Pearson A., Kraunz K. S Sessions A.L., Dekas A. E., Leavitt W.D., Edwards K.J (2008), Quantity Microbial Utilization of Petroleum Hydrocarbons in Salt Marsh Sediments by Using the 13C Content of Bacterial RRNA.
Appl. Environ Microbial, vol.74, pp.1157-1166.
Roling W.F., Milner M.G Jones D.M, Fratepietro F., Swannell R.P., Daniel F, Head I. M., (2004), Bacterial Community Dynamics and Hydrocarbon Degradation During a Field-Scale Evaluation of Bioremediation on a Mudflat Beach Contaminate with Buried Oil. Appl Environ Microbiol , vol.70, pp.2603-2613.
Sambrook J., Fritsch E. F. Maniatis T., (1989), Molecular Cloning: A Laboratory Manual, 2nd Edn. Cold Spring Harbor Laboraory Press, Cold Spring Harbor, N.Y., pp.73-78.
Sanchez O, Ferrera I., Vigues N., Garcia de Oteyza T., Grimalt J. Mas J. (2006) Presence of Opportunistic Oil-Degrading Microorganism Operating at the Initial Steps of Oil Extraction and Handling. Int. Micobiol, vol.9, pp.119-124.
Silfanus, N.J. (2008). “Microbial Mechanism for enhanced Oil Recovery” from High Salinity Core environments, pp.300-310.
Sokol, W. (1987). Oxidation of an inhibitory substrate by washed cells (Oxidation of phenol by Psuedomonas putida)” Biotechnology, Bio. Eng vol. 30, pp. 921-927. Song D., Katayama A., (2005), Monitoring Microbial
Community in a Subsurface Soil Contaminated with Hydrocarbons by Quinone Profile. Chemsophere, vol.59, pp.305-14.
Sonkaya V., Raizada N. Hausner M. Wilder P.A (2007), Microbial Populations Associated with Fixed and Floading-Bed Reactors During a Two-Stage Anaerobic process Int. Microbiol vol.10, pp.245-251.
Steven C.C. and Raymond P.C. (2007). Numerical Methods
for Engineers, Fifth edition, Tata McGraw-Hill Tnc. New
Delhi, pp. 589.
Tan N.C.G, Borger A, Slenders P., Svitelskaya A, Lettinga G.
et al. (2000), Degradation of Azo Dye Mordant Yellow
10 in a Sequential Anaerobic and Bioaugmented Aerobic Bioreactor. Water Sci. Technol vol.42, pp.337-344. Tringe S.G., Rubin E.M. (2005), Metagenomics: DNA
Sequencing of Environmental Samples, Nat Rev Genet, vol. 6, pp.805-814.
Tyson G.W, Chapman J., Hugenholtz P., Allen E.E, Ram R.J Richardson P.M, Solovyev V.V, Rubin EM, Rokhsar D.S, Banfield JP (2004), Community structure and Metabolism Through Reconstruction of Microbial Genomes from the Environment. Nature, vol.428, pp.37-43.
Wawirk B. Kerkholf I., Kukor J., Zylstra G (2005), Effect of Different Carbon Sources on Community composition of Bacterial Enrichments from Soil. Appl Environ Microbiol, vol.71, pp6776-6783.
Zhana M. M, Chen W.M, Chen B.Y, Chang C. T, Hsueh C. C
et al., (2010) Comparative Study on Characteristics of
Azo Dyes Bacterial Consortuim Dyes Pigm, vol.67: pp.55-61.
Zobell, C. E. (1974). Bacterial release of oil from sedimentary material oil and Gas. SPE Journal, vol. 46, No. 13, pp.62-65.