http://www.scirp.org/journal/jbm ISSN Online: 2327-509X
ISSN Print: 2327-5081
DOI: 10.4236/jbm.2018.64007 Apr. 27, 2018 85 Journal of Biosciences and Medicines
Pattern of MRI Findings in Patients with Low
Back Pain at National Orthopaedic Hospital,
Enugu Nigeria
Emmanuel Chino Iyidobi, Benard Onyilo Obande, Remigius Tochukwu Ekwunife
National Orthopaedic Hospital, Enugu, Nigeria
Abstract
BACKGROUND: Low back pain is a major cause of referral to the Spine clinic. In the adult population 50% - 90% may present with low back pain at least once in their life time. Currently, the gold standard for diagnosing the etiology of low back pain is MRI. The protocol at NOHE is to request MRI for patients whose clinical patterns are indicative for invasive intervention. OBJECTIVE: To determine the pattern of MRI findings in patients with low back pain attending spine clinic at NOHE. METHODS: This is a retrospective study of 60 MRI of adult patients with low back pain with clinical need for invasive intervention. The scan was carried out with A Basda BTI 0.35T MRI System using the standard protocol, with sagital and axial T1 and T2-weighted and STIR. Images were from Onis 2.5 digital co. limited. RESULT: Thirty five (58.3%) were males while 25 (41.7%) were females with majority aged be-tween 40 - 59 years. About 90% of the images had disc prolapse while 73% had disc height reduction. The commonest cause of spinal canal stenosis was disc prolapse, thickened ligamentum flavum, spondylolisthesis and osteophytes. Six (10%) of the patient did not have any lesion on MRI. L4/5 was the com-monest affected segment while 90% of abnormal cases had multilevel in-volvement. CONCLUSION: There is high yield of diagnosis with MRI scan among low back pain patients with clinical need for invasive intervention, hence an excellent navigating tool. L4/L5 disc level remains the commonest culprit.
Keywords
Pattern, MRI Findings, Low Back Pain, Enugu
1. Introduction
Low back pain is a major cause morbidity among the working population [1].
How to cite this paper: Iyidobi, E.C., Obande, B.O. and Ekwunife, R.T. (2018) Pattern of MRI Findings in Patients with Low Back Pain at National Orthopaedic Hospital, Enugu Nigeria. Journal of Biosciences and Medicines, 6, 85-94.
https://doi.org/10.4236/jbm.2018.64007
Received: March 12, 2018 Accepted: April 24, 2018 Published: April 27, 2018
Copyright © 2018 by authors and Scientific Research Publishing Inc. This work is licensed under the Creative Commons Attribution International License (CC BY 4.0).
DOI: 10.4236/jbm.2018.64007 86 Journal of Biosciences and Medicines Plain radiographs primarily rule out infection, malignancy, fractures, and in-flammatory conditions [2]. MRI is the gold standard for the investigation. It can outline soft tissues; it is non-invasive, and has multi-planar imaging capabilities with no ionizing radiations [3]. The intervertebral discs, nerve roots, spinal canal and foraminae are clearly elucidated [3][4] [5]. Though MRI findings do not always correlate with clinical findings; positive findings in the presence of sig-nificant clinical features are a useful navigation tool for the spine surgeon [5]. Correlating clinical findings with MRI pattern prevent the failed back surgery hence the need to evaluate the pattern of findings among patients who clinically qualify for invasive intervention. According to Ebubedike U. R. et al.[6] in Ni-geria, 99% of their study population had some changes on their MRI while San-gani S. G. et al.[7] in India recorded that 97.5% of the patients had abnormali-ties on their MRI. The common abnormaliabnormali-ties from MRI scan include disc des-sication, disc height reduction and disc herniation which occur in about 59% of patients according to Irurhe et al. Surendra K. et al.[8] also noted that 56.25% of patients MRI had disc herniations.
Spinal canal sternosis is also a common finding in the MRI of patients with low back pain, Irurhe et al. in Nigeria recorded 27.5%. This is similar to the 24.5% recorded by SaeidiborojenI R. H. et al.[9] in Iran, while most patients had multilevel abnormalities, predominantly at L4/5 and L5/S1.
2. Methodology
This is an observational retrospective study of 60 MRI images of patients with the complaint of low back pain attending the spine clinic at the National Ortho-paedic Hospital Enugu. A single 64 MRI scan of 64 patients with low back pain and who had attended our spine clinic for more than three months were studied; four were excluded due to improper documentation. The patients had low back pain or radicular pain. These patients that had MRI done were thought to be candidates who will benefit from some invasive interventions.
The data collected were patient’s bio data from their folders and MRI findings. All the MRI were done by the same MRI scanner using the standard protocols, the lumbosacral spine were exposed. The parameters assessed include; disc pro-lapse, spinal canal narrowing, hypertrophic ligamentous flavum > 5 mm and stenosed spinal canal < 11.5 mm, prescence of Spondylolisthesis, Osteophytes, and vertebral collapse were also noted.
A Basda BTI 0.35T MRI System was used for all the MRI, The scans consisted of sagittal and axial T1-weighted (repetition time/echo time (TR/TE) of 500/19 ms) and T2-weighted (TR/TE of 1200/120 ms) turbo spin echo and STIR images. The slice thickness of 4 mm was used for both sagittal and axial images. The in-terslice gap of 1 mm used with 192 by 256 matrix and a field of view of 260 mm were used for sagittal images, and 192 by 256 matrix and a field of view of 200 mm for axial images.
DOI: 10.4236/jbm.2018.64007 87 Journal of Biosciences and Medicines SPSS version 20.00. Results of statistical analysis are presented in texts, tables, pie and bar charts. Chi square and student t test were used to test for significance whose value was set at a p < 0.05
3. Results
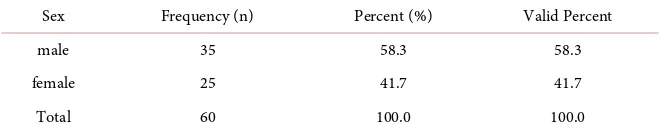
Thirty five (58.3%) were males while 25 were females with a male to female ratio of 3:2.
Most of the populations are between the ages of 40 - 59 years of age. Only 5% of the population are older than 70 years.
Six (10%) out of the 60 patient that presented with low back pain do not have any lesion on MRI.
Disc prolapse and height reduction are the commonest lesion followed by Canal sternosis.
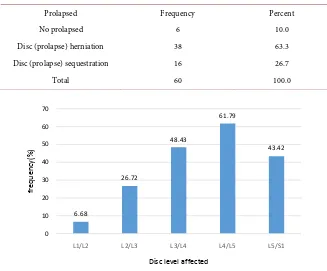
Ninety Percent of the patients have disc prolapse; while 63.3% fall within the spectrum of disc bulge to herniation, about 26.7% fall within the spectrum from disc extrusion to sequestration.
Table showing disc herniation and is seen to increase with age. (X2 = 26.029, p = 0.004).
Changes like canal stenosis, presence of osteophytes and disc height reduction are seen to increase with age and are statistically significant as there p-value < 0.05.
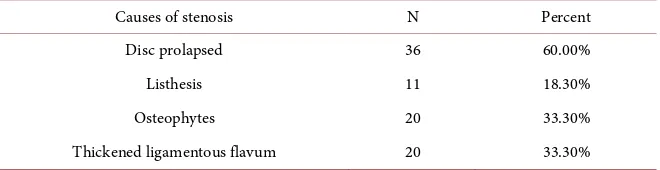
From the table above, disc prolapsed account as the commonest cause of canal stenosis.
From the table L4/L5 (61%) and L3/L4 (48%) narrowing account for the most affected disc space in the population and the least being L1/L2. L5/S1 level affec-tation is also not uncommon.
More loss of lumber lordosis is seen among men than in women with p value < 0.05, the other lesions did not have any sex difference.
4. Discussion
This study shows the pattern of MRI findings amongst among patients with fea-tures of lumbar spinal stenosis with the clinical need for invasive intervention. The protocol of this selective scan is due to the high cost of the scan in our envi-ronment as well as the poor socioeconomic condition of the people who also have no universal health insurance. This protocol is similar to that reported by Omoke et al. in their study [10] but differ from the USA and Europe where most lower back pain patients are sent for MRI as well as CT Scan if pain persist for more than six weeks [11].
DOI: 10.4236/jbm.2018.64007 88 Journal of Biosciences and Medicines
Table 1. Sex distribution of sample population.
Sex Frequency (n) Percent (%) Valid Percent
male 35 58.3 58.3
female 25 41.7 41.7
Total 60 100.0 100.0
However a study by in Uganda by Gulukande et al.[12], noticed higher preva-lence of low back pain among women.
The age distribution of the patient as represented Figure 1 showed that about 77% were aged 40 years and above, while 55% were aged 50 years and above. This suggests that spinal stenosis is principally a disease of middle age and el-derly. This pattern is similar to reports by Irurhe who found 87% were less than 60 years and one third of this (32%) were in the age group 50 - 59 years and they had the highest incidence of low back pain. It also corroborates the negative ef-fects of lower back pain on productivity and economy [1].
The number of subjects for MRI Scan in this study increases with age and peaks at 50 - 59 years as represented in Figure 1. This is similar to the report by Uduma et al.[3] that found the largest studied population with low back pain, 31.25% was in the 50 - 59 age. The decrease in the number after the age of 70 years is likely to be from low life expectancy of less than 54 years in Nigeria, such that less number of people get to 70 years and beyond [13]. This is unlike the western population in which the typical patient with multilevel lumbar spinal stenosis is an elderly male [14].
A review of the MRIs of the patients in this study in Figure 2 shows that 90% have one or more lesion on the spine, while as much as 10% had no lesion noted despite being clinically adjudged to need intervention. This 10% negative MRI finding is critical and may contribute to failed back surgery. This underscores the need to also evaluate patients holistically including psychiatric and psycho-logical evaluation before embarking on spine surgery for low back pain [15].
The 90% positive finding on MRI agrees with the study by Irurhe et al. [4] who noted that most low back pain patients present with MRI changes which are mostly degenerated in nature, Jarvik et al.[16] who noted that 64 % had disc changes and 56% had reduction in disc height in a study among normal popula-tion, this figure is lower than our findings and the study population may have accounted for this. Similarly Uduma et al. attributed his 10% negative MRI findings among low back pain patients to severe back pain of non mechanical origin [3].
DOI: 10.4236/jbm.2018.64007 89 Journal of Biosciences and Medicines Figure 1. A bar chart showing the age distribution of population.
Figure 2. A pie chart showing presence of lesion on the MRI.
Figure 3. A bar chart showing the distributions of various lesion on MRI.
to disc herniation, similar to the findings recorded by Irurhe et al.[4]. Disc ex-trusion-sequestration accounts for the other 26% as represented in Table 2. This high number of disc sequestration could have been due to the late pres-entation of patients in this region couple with few skilled personnel in spine surgery [18].
With respect to location of lesions, single disc level of L4/5 is the most stenosed segment, occurring in 61.79% of cases as represented in Figure 4. Similar studies
6.67
16.67
21.67
31.67
18.33
5
0 5 10 15 20 25 30 35
15-29 yrs 30-39 yrs 40-49 yrs 50-59 yrs 60-69 yrs >70 yrs
fr
eque
nc
y %
Age(years)
63.33
21.67 40
23.33 40
30 90
73.33
0 10 20 30 40 50 60 70 80 90 100
fr
eq
uen
cy
(%)
[image:5.595.244.500.429.581.2]DOI: 10.4236/jbm.2018.64007 90 Journal of Biosciences and Medicines
Table 2. The distribution of disc prolapsed (herniation and sequestrum).
Prolapsed Frequency Percent
No prolapsed 6 10.0
Disc (prolapse) herniation 38 63.3 Disc (prolapse) sequestration 16 26.7
Total 60 100.0
Figure 4. A bar chart showing disc level mostly affected.
also recorded the highest level of affectation to be L4/5 [4][10]. In addition to being the commonest site of disc prolapse, L4/5 has also been cited as the com-monest site of degenerative spondylolisthesis which significantly contributes to lumber canal stenosis [4][19][20]. This is likely to be due to the high mobility and hence the degenerative prone nature of L4/5 lumber segment. L5/S1 is also not uncommon as it is next to L4/5 in frequency.
Disc prolapsed as represented on Table 3 is also seen to increase with age, this is statistically significant with a p-value < 0.05. In addition to disc displacement, osteophytes and spinal canal sternosis as represented on Table 4 were found to increasingly occur in a statistically significant manner with increasing age, p < 0.05. This is also similar to that reported by park at al [14].
Canal stenosis has been found in 80% of the MRI images of subjects aged 70 years and above [21]. This has been attributed largely to degenerative conditions of the spine including osteophytes, facet joint arthropathy, thickened ligament-ous flavum and bulging degenerated intervertebral disc. These account for most of the lumber stenosis [22]. This corroborates our finding that disc prolapse is the commonest cause of canal stenosis accounting for 60% (36) as shown on Ta-ble 5, followed by thickened ligament flavum and osteophytes with 33% (20) re-spectively.
The high number of subjects with sternosis causing abnormality 54 (90%) which we observed as represented in Figure 2 is higher than that reported by Irurhe et al. (23%) [4]. This could have been accounted for by the protocol in our clinic where only those with features of spinal stenosis who are thought to
6.68
26.72
48.43
61.79
43.42
0 10 20 30 40 50 60 70
L1/L2 L2/L3 L3/L4 L4/L5 L5/S1
fr
eq
uen
cy
(%)
DOI: 10.4236/jbm.2018.64007 91 Journal of Biosciences and Medicines
Table 3. The Age distribution of disc prolapsed.
Age. no prolapsed Disc herniation Disc sequestrum Total.
15 - 29 0 3 1 4
30 - 39 5 3 2 10
40 - 49 1 9 3 13
50 - 59 0 11 8 19
60 - 69 0 9 2 11
above 70 0 3 0 3
[image:7.595.211.539.258.442.2]Total 6 38 16 60
Table 4. The age distribution of some lesions.
Age (years)
15 - 29 30 - 39 40 - 49 50 - 59 60 - 69 70 above total p-value Lesion(n)
Canal stenosis. 1 3 8 13 10 1 36 0.004 Thick Ligamentun
flavum. 1 2 5 7 7 2 24 0.349 Listhesis. 1 1 1 6 3 1 13 0.569 Collapse vert
height. 1 1 1 8 2 1 14 0.232 Lordisis. 1 0 4 6 5 2 18 0.184 Osteophytes. 0 0 4 8 10 2 24 0.000 Reduction in
disc height. 3 3 11 15 10 2 44 0.028
Table 5. A table showing lesion contributing to canal stenosis.
Causes of stenosis N Percent
Disc prolapsed 36 60.00%
Listhesis 11 18.30%
Osteophytes 20 33.30%
Thickened ligamentous flavum 20 33.30%
benefit from spinal decompression are the ones usually sent for MRI studies be-cause of cost and the low socioeconomic status of most of our patients.
The stenosed segments were found to be either single or multiple. Two level canal stenosis is most common, 31% while more than 3 canal stenosis is un-common (3.3%) as shown in Figure 5. This is in line with the report of the re-view of Han Wu et al. that single level stenosis occurs mostly at L4/5, two level at L3-L5 and three level stenosis at L2-L5 [23] [24]. This is higher than the 17% with multilevel disc affectation observed by Jani et al.[25]. This may because his study was carried out in a normal population.
[image:7.595.210.540.472.557.2]DOI: 10.4236/jbm.2018.64007 92 Journal of Biosciences and Medicines
Table 6. Sex distibution of leisions.
Leision\sex Male Female Total P-value Canal sternosis 23 13 36 0.285 Thich Lig flavum 15 9 24 0.593
Listhesis 10 3 13 0.125
Vert hight reduction 10 4 14 0.256 Lordosis loss 15 3 18 0.010
Osteophytes 15 9 24 0.593
Disc hight reduction 26 18 44 0.844
Figure 5. A bar chart showing percentage of the number of level.
shown to be significantly higher in male (see Table 6), however in the study by Ebubedike et al.[6], canal stenosis and spinal mass was the only lesion noted to have a significant sex difference (more in females). The higher loss of lordosis among males in this study could also be attributable to the naturally higher lumber lordosis in females [26]. In another study by Modic et al.[11], male pa-tients (48%) were more likely to have an extrusion or multiple herniation than the female patients.
5. Conclusion
There is high yield of diagnosis with MRI scan among low back pain patients with clinical need for invasive intervention, hence an excellent navigating tool. L4/L5 disc level remains the commonest culprit while multiple pathologies and multi-level stenosis predominate.
References
[1] Ramdan, N.S.A., Hashim, A.Y.B., Kamat, S.R., Mokhtar, M.N.A. and Asmai, S.A. (2014) On Lower-Back Pain and Its Consequence to Productivity. Journal of Indus-trial and Intelligent Information, 2, 83-87. https://doi.org/10.12720/jiii.2.2.83-87 [2] Hanley, E.N. and David, S.M. (1999) Current Concepts Review—Lumbar
Arthrode-10
26.67
31.67
28.33
3.33
0 5 10 15 20 25 30 35
no level 1 level 2 level 3 level 4 level
Fr
eque
nc
y(
%
)
DOI: 10.4236/jbm.2018.64007 93 Journal of Biosciences and Medicines sis for the Treatment of Back Pain. The Journal of Bone and Joint Surgery, 81, 716-730. https://doi.org/10.2106/00004623-199905000-00015
[3] Uduma, U., Ongolo, P., Assam, G., Fokam, P. and Motah, M. (2011) Evaluation of Pattern of Magnetic Resonance Images of Lumbo—Sacral Spine in Cameroon—A Pioneer Study. Global Journal of Medical Research, 11, 30-41.
[4] Irurhe, N.K., Adekola, O.O., Quadri, A.R., Menkiti, I.D., Udenze, I.C. and Awolola, N.A. (2012) The Magnetic Resonance Imaging Scan Findings in Adult Nigerians with Low Back Pain. World Journal of Medical Sciences, 7, 204-209.
[5] Orege, J.A., Abuya, J.M. and Onditi Elias, G.D. (2013) Common Magnetic Reson-ance Imaging (MRI) Patterns in Patients with Low Back Pain in Eldoret, Kenya. Journal of Scientific & Innovative Research, 2, 260-279.
[6] Ebubedike, U.R., Umeh, E.O., Ogbole, G.I., Ndubuisi, C.A., Mezue, W.C. and Ohaegbulam, S.C. (2017) Low Back Pain in Adults: Pattern of Abnormal Findings on MRI Lumbosacral Spine Images in South-East Nigeria. Orient Journal of Medi-cine, 29, 85-90.
[7] Sangani, S.G., Joshi, M.M., Sangani, C.S. and Dave, K.A. (2014) Correlation of Magnetic Resonance Imaging Findings in Low Back Pain Patients with Daily Travel Time and Mode. International Journal of Advances in Medicine, 1, 206-212. https://doi.org/10.5455/2349-3933.ijam20141103
[8] Surendra, K.W. and Neha, D. (2014) Correlation of Pain and Disability with MRI Findings in Patients with Lumbar Discogenic Back Pain. International Journal of Physiotherapy and Research, 2, 418-423.
[9] Saeidiborojen, I.R.H., Shobeiri, E. and Saeidiborojeni, S. (2012) Magnetic Reson-ance Imaging Findings in Low Back Pain and Lower Extremity Radicular Chronic Pain. Journal of Injury and Violence Research, 4, 37.
[10] Omoke, N.I. and Amaraegbulam, P.I. (2016) Low Back Pain as Seen in Orthopedic Clinics of a Nigerian Teaching Hospital. Nigerian Journal of Clinical Practice, 19, 212-217. https://doi.org/10.4103/1119-3077.175964
[11] Modic, M.T., Obuchowski, N.A., Ross, J.S., Brant-Zawadzki, M.N., Grooff, P.N., Mazanec, D.J. and Benzel, E.C. (2005) Acute Low Back Pain and Radiculopathy: MR Imaging Findings and Their Prognostic Role and Effect on Outcome. Radiology, 237, 597-604. https://doi.org/10.1148/radiol.2372041509
[12] Galukande, M., Muwazi, S. and Mugisa, D.B. (2005) Aetiology of Low Back Pain in Mulago Hospital, Uganda. African Health Sciences, 5, 164-167.
[13] This Day Live (2017) Tackling Low Life Expectancy in Nigeria, 2016.
http://www.thisdaylive.com/index.php/2016/07/22/tackling-low-life-expectancy-in-nigeria/
[14] Park, D.K., AN, H.S., Lurie, J.D., et al. (2010) Does Multilevel Lumbar Stenosis Lead to Poorer Outcomes? A Subanalysis of the SPORT Lumbar Stenosis Study. Spine, 35, 439-446.https://doi.org/10.1097/BRS.0b013e3181bdafb9
[15] Atlas,S.J. andDeyo,R.A. (2001) EvaluatingandManagingAcuteLowBackPainin thePrimaryCareSetting. Journal of General Internal Medicine,16, 120-131. https://doi.org/10.1111/j.1525-1497.2001.91141.x
[16] Jarvik, J.J., Hollingworth, W., Heagerty, P., Haynor, D.R. and Deyo, R.A. (2001) The Longitudinal Assessment of Imaging and Disability of the Back (LAIDBack) Study: Baseline Data. Spine, 26, 1158-1166.
https://doi.org/10.1097/00007632-200105150-00014
DOI: 10.4236/jbm.2018.64007 94 Journal of Biosciences and Medicines Acute Severe Lower Back Pain. Annals of Rehabilitation Medicine, 36, 47-54. https://doi.org/10.5535/arm.2012.36.1.47
[18] O’Donnell, O. (2007) Access to Health Care in Developing Countries: Breaking down Demand Side Barriers. CadernosdeSaúdePública, 23, 2820-2834.
http://www.scielo.br/scielo.php?script=sci_arttext&pid=S0102-311X2007001200003
&lng=en
[19] Jacob, M. (2011) Pattern of Spine Degenerative Disease among Patients Referred for Lumbar Magnetic Resonance Imaging at Muhimbili National Hospital, Dar es Sa-laam, Tanzania March-September-2010. Dissertation, Muhimbili University of Health and Allied Sciences, Muhimbili, Tanzania.
[20] Marek, S. and Robert, G. (2003) Lumbar Spinal Stenosis in the Elderly: An Over-view. European Spine Journal, 12, 170-175.
[21] Sasaki, K. (1995) Magnetic Resonance Imaging Findings of the Lumbar Root Path-way in Patients over 50 Years Old. European Spine Journal, 4, 71-76.
https://doi.org/10.1007/BF00278915
[22] Wong, H.K. and Bose, K. (1992) Spinal Stenosis: Results of Surgical Treatment. Journal of the Western Pacific Orthopaedic Association, 29, 37-41.
[23] Wu, H., Yu, W.-D., Jiang, R. and Gao, Z.-L. (2013) Treatment of Multilevel Dege-nerative Lumbar Spinal Stenosis with Spondylolisthesis Using a Combination of Microendoscopic Discectomy and Minimally Invasive Transforaminal Lumbar In-terbody Fusion. Experimental and Therapeutic Medicine, 5, 567-571.
https://doi.org/10.3892/etm.2012.812
[24] Jensen, M.C., Brant-Zawadzki, M.N., Obuchowski, N., etal. (1994) Magnetic Re-sonance Imaging of the Lumbar Spine in People without Back Pain. The New Eng-land Journal of Medicine, 331, 69-73.
https://doi.org/10.1056/NEJM199407143310201
[25] Jani, T., Jaro, K., Jaakko, N., Simo, T., Simo, N., Marjo-Riitta, J., Eero, K. and Osmo, T. (2009) Prevalence of Degenerative Imaging Findings in Lumbar Magnetic Re-sonance Imaging among Young Adults. Spine, 34, 1716-1721.