Considering Spatial and Temporal Flexibility in
Optimizing One-Way Electric Carsharing Systems
Burak Boyacı∗, Konstantinos G. Zografos
Centre for Transport and Logistics,
Lancaster University Management School, United Kingdom [email protected], [email protected]
1
Introduction
Carsharing is a shared-use vehicle model that allows users to rent cars for short periods of times. There are different types of systems according to their operational properties. In
round-trip carsharing systems users are expected to return vehicles to their pickup loca-tions. One-way systems relax this restriction and allows users to return cars to different drop-off locations. In station-based systems, there are designated parking locations to which vehicles should be returned. Free-floating systems relax this restriction and allow users to park vehicles to any legal parking locations within a designated area [1].
In this research we are dealing with operational planning decisions instation-based one-way electriccarsharing systems withdynamic relocations. Different than the previous work in literature [2, 3, 4, 5, 6], we introduce spatial and temporal flexibility to the system by considering multiple pick-up and drop-off times and locations at different prices to increase total profit of the system. In other words, we will assume that the operator could offer to users discounted prices for pick-up time, and pick-up and drop-off locations that differ from the originally requested. The rational of the proposed approach is to accommodate to the maximum possible extend the requests of the users while at the same time ensures the maximization of the total profit resulting from the operation of the system.
2
Modelling Framework
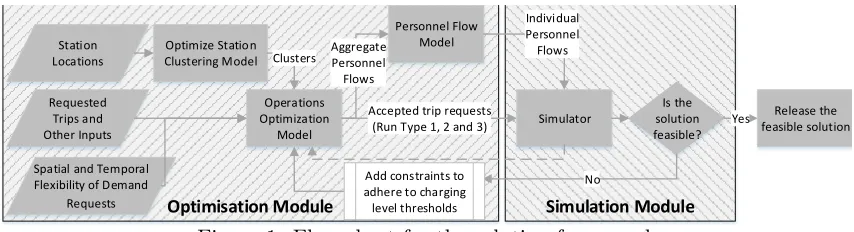
The modelling framework used in this work includes modules foroptimization and simu-lation. Optimization module introduces 3 separate mathematical models: (i) The station clustering, (ii) theoperations optimization and (iii) the personnel flow models. The flow chart used for the solution framework can be seen in Figure 1. The proposed framework
∗
Station Locations Requested Trips and Other Inputs Optimize Station Clustering Model Operations Optimization Model Clusters Personnel Flow Model Aggregate Personnel Flows Simulator Accepted trip requests
(Run Type 1, 2 and 3)
Individual Personnel Flows Is the solution feasible? Release the feasible solution No Yes
Optimisation Module Simulation Module
Add constraints to adhere to charging level thresholds Spatial and Temporal
[image:2.612.91.518.78.194.2]Flexibility of Demand Requests
Figure 1: Flow chart for the solution framework
is an extension of the framework presented in [2]. The added value in this new framework is the proposed clustering model and introduction of the spatial and temporal flexibility.
The proposed operations optimization model is an advanced network flow model. Each node represents a unique station-time interval pair. There are separate networks for all vehicles and different personnel shifts. Every rental request and relocation are represented with flows on one or multiple networks. For instance, a rental is a flow on the network of vehicles; a relocation with a vehicle is a flow in the networks of both vehicles and related personnel shift; a relocation without a vehicle is a flow in the network of related personnel shift only. Every option of the rental request is generated as a potential flow in the network of vehicles and at most one of these options is allowed to be realised [2].
The designated system handles relocations throughout the day if there are available personnel. This means that, there can be as many relocations as the number of time intervals times the number of stations squared. To decrease this number, we introduced virtual nodes to the system and re-route relocation arcs through these nodes. The sta-tions are clustered and assumed that the relocasta-tions are happening in three virtual steps: From (i) origin node to its cluster, (ii) between origin and destination nodes’ clusters and (iii) from destination node’s cluster to destination node. With this change, the number of variables and consequently the solution time are decreased dramatically. However, this simplification also introduces an error in the determining relocations. The cluster struc-tures affects the magnitude of the error. To keep the error emerging from the restructing of the network low, we develop and solve a mathematical model. This model takes travel times between stations as input and returns the set of clusters that minimises the error.
The station clustering model is used to create sets of stations for relocation flows. The mathematical model not only decides on the clusters of the stations, but also calculates the travel time between clusters and from/to stations to/from their clusters. Unfortunately, using clustering in the operations optimization model slightly overestimates the relocation durations. An objective function which minimises the weighted sum of the time difference between real and clustered relocation durations is used to minimise this effect. Since the relocation with and without vehicle speeds are assumed to be different, the model is executed twice at the very beginning of the solution process to create separate clusters of stations for both relocations with and without vehicles.
personnel flow model. Since the clusters are introduced, the solution of the operations optimization model represents relocations between clusters. The personnel flow model takes these output and creates feasible schedules for every relocation personnel. These individual relocation schedules are passed to the simulator for a feasibility check with the other parameters from the operations optimization model.
In the operations optimization model, vehicles’ movements are modelled as unit flows in a time-space network in order to keep model simple and efficient. However, this approach also prevents to track charging levels of the vehicles explicitely. The model regards every vehicle as identical flows. However, we can still check if the solution gives a schedule in which every vehicle has feasible charging levels or not. Furthermore, if the suggested schedule is infeasible, we can add more constraints to the model which forces these vehicles which were rented with infeasible charging levels to stay at their stations and to be charged. To detect infeasible charging levels of the vehicles, we developed a discrete event simulator which replicates an electric carsharing system. This simulator is used with the operations optimization and personnel flow models iteratively in the solution process. The output of these two models are tested in the simulator. If there are infeasibilities in the charging levels of the vehicles, the simulator informs the operations optimization model. Then the existing model is updated with additional constraints. This loop continues until the simulator does not detect infeasibilities of the car charging levels.
3
Preliminary Results and Conclusions
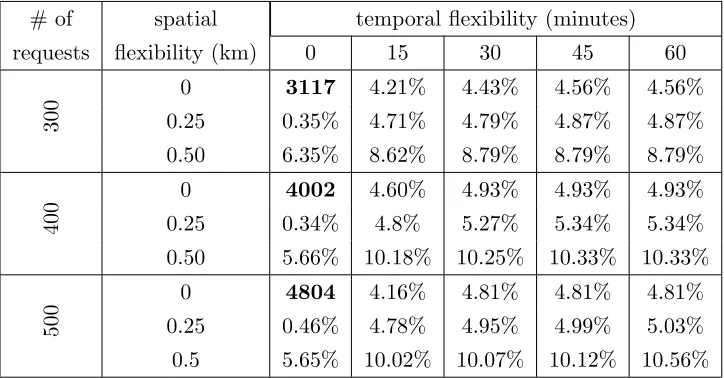
In the experiments, we used the locations and demand from the electric carsharing system operating in France [2]. In this system, we assumed that there are 3 parking places and one fully-charged available car at each station at the beginning of the day. Time intervals are set to 15min. There are four 4-hour working shifts to cover the entire 16 hours (6am-10pm) of operations. Three levels of demand (300, 400 and 500 rentals/day) are tested with 5 different levels of temporal flexibility in pick-up and drop-off times (0,±15,±30,±45 and
# of spatial temporal flexibility (minutes) requests flexibility (km) 0 15 30 45 60
300
0 3117 4.21% 4.43% 4.56% 4.56% 0.25 0.35% 4.71% 4.79% 4.87% 4.87% 0.50 6.35% 8.62% 8.79% 8.79% 8.79%
400
0 4002 4.60% 4.93% 4.93% 4.93% 0.25 0.34% 4.8% 5.27% 5.34% 5.34% 0.50 5.66% 10.18% 10.25% 10.33% 10.33%
500
[image:4.612.124.486.80.269.2]0 4804 4.16% 4.81% 4.81% 4.81% 0.25 0.46% 4.78% 4.95% 4.99% 5.03% 0.5 5.65% 10.02% 10.07% 10.12% 10.56%
Table 1: Preliminary experimental results
distance between their requested and offered stations during their pick-up and drop-off. Similarly, customers receivee9 per hour discount for early or late pick-up and drop-off.
Preliminary experimental results showed that both the spatial and temporal flexibility increases the profit of the operator. The results can be seen in Table 1. Bold figure in the first column and first row of each demand level of the table shows the average profit of the operator for the case without flexibility. The rest of the cells show the increase in profit from the base cases. As expected the profit of the operator increases with increased flexibility. However the highest marginal profit increase if observed when the temporal flexibility is 15min and the spatial flexibility is increased from 0.25km to 0.5km. The effect of temporal flexibility in particular is quite interesting. Implementing even a 15min flexibility to pick-up and drop-off times makes the operator profit over 4%. On the other hand, gain from spatial flexibility is also promising. The increase in the accessibility distance gives the operator to utilise its stations better. When the accessibility distance is increased to 0.5km, the number of stations that can be used for a pick-up (or drop-off) becomes 1.85 on average. This value is just 1.05 when the distance is 250 metres. Interestingly, the number of stations that can be used for pick-up when the accessibility distances are 0.75 and 1 km are 3.72 and 5.87 on average. Although we have excluded these cases in our preliminary analyses (since customers are expected to not willing to walk more than 500 metres), we will include in our future experiments to see how much the operator gains if they are implemented.
destination stations for their accepted requests. Although the first option could give more profitable schedules for the operator, users would prefer the third option more since the full information about their requests are received immediately. With extensive analyses, we want to see if different run types create substantial differences in profits or not.
References
[1] B. Boyacı, K. G. Zografos, N. Geroliminis, An optimization framework for the de-velopment of efficient one-way car-sharing systems, European Journal of Operational Research 240 (2015) 718–733. doi:10.1016/j.ejor.2014.07.020.
[2] B. Boyacı, K. G. Zografos, N. Geroliminis, An integrated optimization-simulation framework for vehicle and personnel relocations of electric carsharing systems with reservations, Transportation Research Part B 95 (2017) 214–237. doi:10.1016/j. trb.2016.10.007.
[3] M. Repoux, B. Boyacı, N. Geroliminis, Simulation and optimization of one-way car-sharing systems with variant relocation policies, in: 94th Annual Meeting of the Trans-portation Research Board, no. 15-1907, Washington D.C., 2015.
[4] D. Jorge, G. Molnar, G. H. de Almeida Correia, Trip pricing of one-way station-based carsharing networks with zone and time of day price variations, Transportation Research Part B: Methodological 81 (2) (2015) 461–482. doi:10.1016/j.trb.2015.
06.003.
[5] M. Nourinejad, M. J. Roorda, A dynamic carsharing decision support system, Trans-portation Research Part E: Logistics and TransTrans-portation Review 66 (2014) 36–50.
doi:10.1016/j.tre.2014.03.003.