Real-time Visual Landmark Recognition in Multi-view
Image Collections
Kwisha Hitesh Gohil
StudentDepartment of Information Technology Chandubhai S. Patel Institute of Technology
(CSPIT)
Charotar University of Science and Technology (CHARUSAT)
Sonal Pravinbhai Rami
Assistant ProfessorDepartment of Information Technology Chandubhai S. Patel Institute of Technology
(CSPIT)
Charotar University of Science and Technology (CHARUSAT)
ABSTRACT
Research and advancement in the Convolution Neural Network have been capable of solving many computer vision problems with higher accuracy than humans at some time. This paper, presents CNN along with its various layers for easy understanding. CNN algorithm has been used here for the landmark recognition problem. In the 3D Visual Phrasing method, SfM has been used to reconstruct a 2D image of a landmark to its 3D image for better classification. To solve the problem of landmark recognition, various approaches have been put forward. Each approach mentioned in the paper is an enhancement of the previously mentioned approach to obtain greater accuracy in landmark recognition.
Keywords
3D Visual Phrase, CleverHans, Convolution Neural Network, Deep learning, Keras, Landmark Recognition, Machine learning, Object detection, Pre-trained models, TensorFlow
1.
INTRODUCTION
Humans have proved to be one of the most intelligent species on the planet. But, with the advent of growing technological innovations, computers are not far behind. Humans have always been keen to know in which place their friend clicked that intriguing photo that has been posted on the social media page. The first attempt is always to figure it out by themselves before asking. In order to do so, cues from the images are picked out. These cues include architectural styles, landmarks, road signs, driving styles and other information that is available in the photo. Imagine a computer doing the same task for humans. It will save a lot of time.
2.
BACKGROUND THEORY
Computer Vision is the technology of making computers identify and process the images just like the humans do. The aim of computer vision is to extract all possible information and analyze it using various parameters to obtain useful information. It can use either a single image or a stream of images depending on its purpose. The technology giants like Microsoft and Google have made significant developments in this field. It gave rise to the Convolution Neural Network (CNN) which uses less pre-processing than other techniques for image classification. Classification is a technique in which the data is processed with the purpose of categorizing them in multiple target classes. Numerous models using the techniques of SVM, Linear Classifier, Bayes’ Classifier and Neural networks have been proposed for image processing. Convolution Neural Network has been used here.
3.
CONVOLUTION NEURAL NETWORK
Convolution Neural Network is a classification technique. It is a type of feed-forward Artificial Neural Network. It consists of weights that are learnable along with certain bias. For understanding CNN, an example of image is taken as shown below in the Fig. 1. The numbers in the figure represent the pixel values of the image.
67 96 42 77 84
94 120 112 64 62
100 76 96 88 54
72 43 68 97 117
85 78 80 111 90
Fig 1: 5 * 5 Image
3.1
Convolution Layer
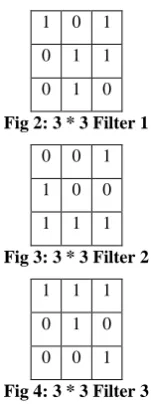
It takes the features from the images and moves the filters, whose size is decided previously, throughout the image while continuously multiplying the image pixel value with the filter pixel value and dividing the result with the total number of pixels. Appropriate user defined filters/features are selected from the image.
1 0 1
0 1 1
0 1 0
Fig 2: 3 * 3 Filter 1
0 0 1
1 0 0
1 1 1
Fig 3: 3 * 3 Filter 2
1 1 1
0 1 0
0 0 1
Fig 4: 3 * 3 Filter 3
[image:1.595.357.490.330.429.2] [image:1.595.386.462.511.714.2]58
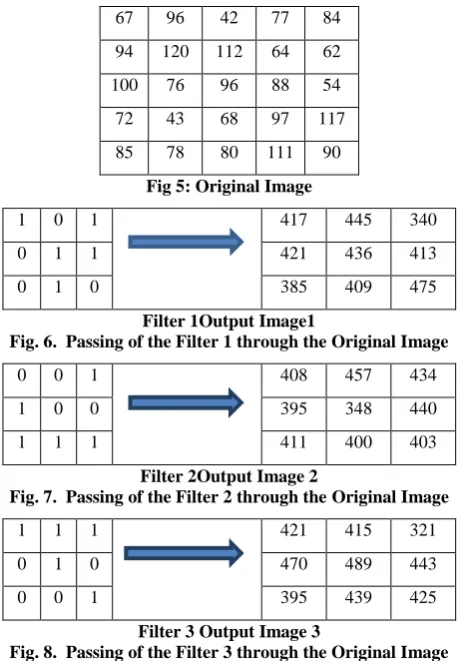
67 96 42 77 84
94 120 112 64 62
100 76 96 88 54
72 43 68 97 117
[image:2.595.56.288.69.400.2]85 78 80 111 90
Fig 5: Original Image
1 0 1 417 445 340
0 1 1 421 436 413
0 1 0 385 409 475
Filter 1Output Image1
Fig. 6. Passing of the Filter 1 through the Original Image
0 0 1 408 457 434
1 0 0 395 348 440
1 1 1 411 400 403
Filter 2Output Image 2
Fig. 7. Passing of the Filter 2 through the Original Image
1 1 1 421 415 321
0 1 0 470 489 443
0 0 1 395 439 425
Filter 3 Output Image 3
Fig. 8. Passing of the Filter 3 through the Original Image
LRF-Local Receptive Field
Output image value=LRF* Filter
(dot product of LRF and Filter)
Size of filter = 3x3
Size of input = 5x5
Stride = 1x1 (move 1 cell)
Padding = 0x0 (No padding)
3.1.1 Formula
Calculating Output size from the above equation,
Output size = (5-3) *1+1
Output size = 3x3
3.2
Pooling Layer
Pooling layer is used to shrink the image by taking a specific window size. There can be multiple pooling layers in a CNN.
Taking the maximum values of the result obtained from the above layers, the following matrix is obtained by keeping the parameters as follows:
Pool size = 2x2
Pool type = Max-pool
Stride = 2
Padding = 1
445 445
409 475
Fig. 9. Output After applying Max Pooling on Output Image 1
3.3
Relu Layer (Rectified Linear Unit)
ReLu is an activation Layer which is used to remove the negative values from the obtained matrix of the previous layer. The following equation is used at the ReLu Layer.
-47 94 0 94
[image:2.595.309.526.194.260.2]60 -77 60 0
Fig. 10. Output After Passing through ReLu Layer
3.4
Fully Connected Layer
[image:2.595.311.547.332.516.2]This layer converts the set of values obtained from all the previous layers to the type of values which have been given in the final output layer so that a precise comparison can be made between the two.
Fig. 11. Convolution Neural Network
4.
IMAGE DETECTION AND ITS
VARIOUS APPROACHES
A large number of approaches have been devised for image classification using various techniques.
This paper [1], uses Yahoo Flickr Creative Commons 100M(YFCC100M) dataset, consisting of a large number of images from Flickr. It also uses the Hashtag Context Feature of the Instagram along with the Visual Context Feature, which takes help of the surrounding images at the same location. It uses the Bayes’ Rule for solving of the problem which takes into consideration the co-ordinates of the geotagged image (the latitude and longitude of the image). The use of longitude and latitude helps to know the exact location of the image with the help of American Community Service (ACS). A tedious task when using this approach is to manually verify the discarded images so that they do not contain the classes that are of interest. However, this approach fails at obtaining accuracy for the images of car brands which are not location specific. This study, considers RL10 as optimal. (Here RL10 refers to the number of replicas of the radius learning layer).
dataset was confined to a similar number of images from only 5 countries from all over the world making the experiment a success only when the geo-locating was confined to a specific area. The best performance was obtained on visual data within 100km only. 100km can roughly be considered as the radius of a small country. This makes the approach infeasible for using on the entire map of the earth. If working on a small Dataset, this approach can be considered as useful.
An outstanding work done by google [3], is developing its PlaNet Model. By removing the parameters of latitude and longitude as these parameters would get elongated near the poles and replacing them by S2 cells from the Google’s open Source S2 geometry library, which increases the efficiency of the Advanced CNN model. For an even deeper analysis to the problem, LSTM architectures [4] have been used. This model was then tested on the INRIA Holiday dataset. This model fails at correctly determining the location of the images in the rural areas as the pictures taken in the rural areas will be less than that taken in the urban areas and the probability of the images in the rural areas having a landmark to detect via this model will be very low. When google compared PlaNet with humans in the Geoguessr challenge, it was found that both of these could only identify images at the country or the state level and had a lower success rate when the images reached below the street or the city level. Proving that this task was much more difficult than the Flickr and Im2GPS datasets.
5.
EXPERIMENTAL SETUP
The goal is to use a pretrained model in order to recognize the landmarks for processing the image. Maximum pooling is taken into consideration while doing it so that maximum accuracy is obtained in the model. The co-ordinates of the image (latitude and longitude) have been ignored as these parameters get elongated at the poles. The bag-of-words framework is not used as it has a few limitations. When BoW framework is used, it extracts features from irrelevant objects like road signs, faces, animals, etc. Apart from this, it ignores the geometric relationship between the database images.
The structure-from-motion (SfM) [5,6,7] is used to reconstruct 3D Models from a set ℐ of 2D images by maintaining the geometric relationship between the images and removing the irrelevant noisy objects.
The 3D model is covered by a point cloud composed of a set ℒ of 3D points. For each 3D point ℓ belongs to ℒ is selected if it corresponds to a point in the set ℐ of the reconstructed 3D Models. The points are selected based on the point popularity which means selecting a point having maximum occurrence. The selected points should be able to cover all the angles of the specific landmark. These points should collectively make a model of the entire landmark.
In the next step, several points are combined in a group such that the visual phrases are derived from the facets on the surface of the 3D landmark Model. Each of the facet should have sound visibility and repeatability in unseen images. The surface of the Model is approximated using a number of Delaunay Triangles. The 3D visual phrase having three vertex points is characterized by two perspectives. Visual Appearance provides relaxed criteria to recall true positives and geometric structures serves as constraints to eliminate false positives and boost the precision
[8].
5.1
Dataset Description
Lanmark3d has been taken as the database for landmark recognition using 3D models.
25 landmarks, each with a 3D model (point cloud) which are to be reconstructed using structure-from-motion (SfM) [8].
45,180 database images with approximately 1.4K~2K per landmark which have been registered to the 3D models [8].
10,000 positive test images for evaluation (400 per landmark) [8].
~2.7 million 3D points in the 3D models (29K~223K per landmark) [8].
6.
IMPLEMENTATION USING VARIOUS
APPROACHES AND THEIR OUTCOMES
6.1
Basic CNN
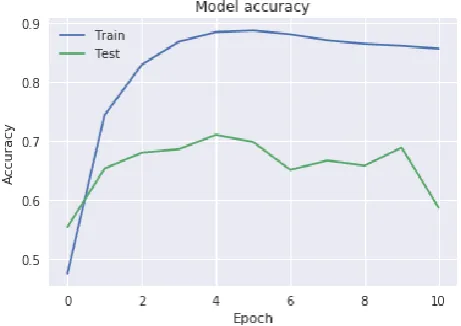
[image:3.595.313.544.445.608.2]Using the Basic CNN model, input all the images and set their dimensions as 224*224. As there are 25 Landmarks, the number of classes will be 25. The pixel values are rescaled from interval [0,255] to the interval [0,1]. As a result, 4158 images belonging to the 25 classes have been found. It will have 3 convolution layers, a ReLu activation Layer followed by multiple max pooling layers. A target of 100 epochs is set with 40805 training images and 8856 testing images. With the facility of Early Stopping of the Keras library the execution is stopped when the quality of output stops improving. As a result, the execution stopped after reaching only 15 epochs and the accuracy obtained from this model was merely 60%. This approach was found to be overfitting the model. A graph of Accuracy v/s Epochs is shown in the Fig. 12. which follows.
Fig. 12. Accuracy v/s Epoch graph for Basic CNN Approach
60 powerful N-dimensional array, the facility of NumPy library of
[image:4.595.58.289.165.324.2]python is used with the specific dimensions of the array as required when necessary. An outcome is obtained as the Multiple angle view of a single landmark. Again, the Early Stopping functionality of Keras library is used. However, this time the accuracy increases from 60% to 70% because of the data augmentation. By this, it is known that this approach is better than the basic CNN model.
Fig. 13. Accuracy v/s Epoch graph for Basic CNN with Data Augmentation Approach
6.3
VGG with Multi-layer Perceptron
[image:4.595.311.517.200.377.2]In this model also, in the initial stage, the image dimension size and the rescaling parameters remain the same. Here, 4158 images are found belonging to 25 classes such that each landmark has a class of itself. A pretrained VGG16 Model is used in this approach and taking weights of the ImageNet [9]. The to_categorical facility of Keras is used to convert these images into binary class matrix. Alongside, a bottleneck is provided to these images and some images are removed which are not needed. A ReLu activation function is applied such that the number of training images are 40800 and test images are 8832. A multi-layer perceptron is also used in this model. Here, the accuracy obtained is 85% after just 10 seconds and this approach proved to be even better than basic CNN with data augmentation approach as it consists a bottleneck feature.
Fig. 14. Accuracy v/s Epoch graph for VGG16 with Multi-layer Perceptron Approach
6.4
Fine-tuning VGG16
The initial steps of this approach are similar to the ones in VGG16 with Multi-layer perceptron approach. This approach is similar till the ImageNet [9] weights are taken for this
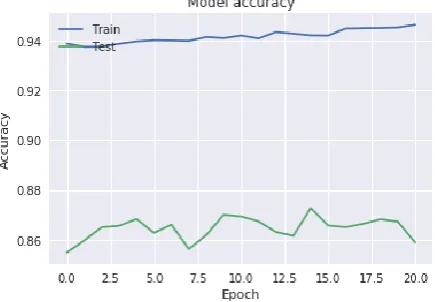
pre-trained model. Now, to fine tune the model according to requirement, a classifier model is needed to put above the convolution model. A fully trained classifier is needed, to place on top of the convolution base. The first 15 layers are set as non-trainable as only a few layers are needed for training. For optimization, the optimizer from the Keras library is used, the default SGD (Stochastic gradient descent) optimizer. This optimizer includes support for momentum and learning rate decay. An accuracy of 94% is obtained using this model after fine-tuning the previous model and hence, this approach works better.
Fig. 15. Accuracy v/s Epoch graph for Fine-tuning VGG16 Approach
6.5
Adversarial examples with FGSM
FGSM (Fast Gradient Sign Method) is used to obtain the local minima of a graph by using the loss function. The equation of loss function [10] used is as follows:
Where x is the original image, y is the class of x. a and b are parameters of the image. The gradient is computed first by using this loss function so that it is known in which direction better results of the input image are obtained. While doing the calculations, only the sign of the slope is necessary to check if an increase in the pixel value or decrease in the pixel value gives a better result.
In this approach, the classes that are supposed to be used for classification are manually input. Then the same steps are performed as for VGG16 with Multi-layer perceptron approach till the resulting images are obtained after using the bottleneck. An value of 0.02 is taken which will be considered as the perturbation. The value of has to be small so that it does not go farther away from the loss function surface and the perturbation is almost negligible. This approach gives 100% confidence with the original image of the landmark.
6.6
Basic CNN adversarial benchmarks with
CleverHans
[image:4.595.61.279.533.684.2]belonging to the 25 classes that have been put. The number of images found here is almost double of the previous approaches. While testing this approach on legitimate images, an accuracy of approximately 69.77% is obtained. Whereas, on testing it on illegitimate images, an accuracy of approximately 20.23% is obatined. But, as the dataset becomes large in this approach, it is considered that this approach is better when using big data.
7.
COMPARISON OF APPROACHES
The comparison table mentioned below does not have Adversarial Example with FGSM approach as this approach does not give accuracy, rather it gives us confidence.
Table 1. Comparison of Various approaches
Parameters Basic CNN Basic CNN with
data Augmentation
VGG16 with Multi-Layer Perceptron
Fine Tuning VGG16
*Basic CNN with CleverHans
Epochs 10 37 20 39 20
Accuracy (%) 60 70 85 94 69.77
*The epochs for this approach have to be explicitly defined and the accuracy obtained is for legitimate images.
8.
CONCLUSION
Various approaches have been used in this paper and the results are provided for each one of them. Each approach mentioned, is an addition to its previous version and better than the previous approach. It can be concluded that while using small datasets which have images of only the classes that have been mentioned, the Adversarial Examples with FGSM approach can be used. However, this is not the real-life situation and the dataset is bound to have a plethora of images that are irrelevant to the classes of choice. At this time, it would be better to go ahead with the CleverHans Approach. A limitation to this problem is that only a small dataset consisting of 25 famous landmarks have been taken in this paper. As an extension to this problem, the landmarks can be identified using PlaNet’s geolocating technique and then this approach can be used on a larger dataset to obtain better results.
9.
REFERENCES
[1] Tang, Kevin, et al. "Improving image classification with
location context." Proceedings of the IEEE international
conference on computer vision. 2015.
[2] Sy, Angela, and Cynthia Day. "Geo-Locating Images:
Where in the world was this picture taken?." (2016).
[3] Weyand, Tobias, Ilya Kostrikov, and James Philbin.
"Planet-photo geolocation with convolutional neural
networks." European Conference on Computer Vision.
Springer, Cham, 2016.
[4] Hochreiter, Sepp, and Jürgen Schmidhuber. "Long
short-term memory." Neural computation 9.8 (1997): 1735-1780.
[5] Snavely, Noah, Steven M. Seitz, and Richard Szeliski.
"Photo tourism: exploring photo collections in 3D." ACM
transactions on graphics (TOG). Vol. 25. No. 3. ACM, 2006.
[6] Snavely, Noah, Steven M. Seitz, and Richard Szeliski.
"Modeling the world from internet photo
collections." International journal of computer vision 80.2
(2008): 189-210.
[7] Wu, Changchang, et al. "Multicore bundle
adjustment." Computer Vision and Pattern Recognition
(CVPR), 2011 IEEE Conference on. IEEE, 2011.
[8] Hao, Qiang, et al. "3d visual phrases for landmark
recognition." Computer Vision and Pattern Recognition
(CVPR), 2012 IEEE Conference on. IEEE, 2012.
[9] Deng, Jia, et al. "Imagenet: A large-scale hierarchical image database." 2009 IEEE conference on computer vision and pattern recognition. Ieee, 2009.
[10] Goodfellow, Ian J., Jonathon Shlens, and Christian Szegedy. "Explaining and harnessing adversarial examples