CHILDHOOD MORTALITY IN GHANA: A COMPARATIVE STUDY OF 2003
Department of Population and Health,
ARTICLE INFO ABSTRACT
Although childhood mortality rates have been steadily declining in Ghana over the last two decades, the rate of decline has been very slow and uneven. This study compares the determinants of childhood mortality in Ghana for
and Health Surveys were used for the study. Bivariate analysis and binary logistic regression were used to examine the relation
biomedical characteristics of mothers and childhood mortality for both survey years. The results show that childhood mortality had a significant relationship with parity, household size, and dura breastfeeding for both survey years; and that mothers with higher parity; mothers from small size households and mothers who never breast fed were significantly likely to experience childhood mortality compared to their counterparts, for both 2003
mosquito bed net use significantly influenced childhood mortality for 2003 while religion and type of birth significantly influenced childhood mortality for 2008. Some socio
household/environmental as wel both survey periods.
Copyright © Samuel Harrenson Nyarko. This is an open access article distributed under the Creative Commons Attribution License, which permits unrestricted use, distribution, and reproduction in any medium, provided the original work is properly cited.
INTRODUCTION
The fourth goal of the Millennium Development Goals (MDG) is to reduce childhood mortality in Ghana to two
1990 value (122 deaths per 1000 live births) by the year 2015. As a result, the Government of Ghana adopted the
Rapid Delivery (HIRD) approach among other existing
internationally proven and cost-effective health, and nutrition
interventions as a national strategy for reducing childhood
mortality (MOH, 2006). Meanwhile, even though under five mortality rates have steadily declined in Ghana over the last two decades, the rate of decline has been very slow and uneven. Under five mortality rate in Ghana has declined slowly from 155 deaths per 1000 live births in 1988 to 80 deaths per 1000 live births in 2008. The under five mortality
deaths per 1000 live births in Ghana means that one in every thirteen Ghanaian children dies before reaching age five and nearly three in five of these deaths occur in the first year of life (GSS et al., 2009). Also, under five mortality rate i
than the world average of 57 deaths per 1000 live births in 2010. In Ghana, about 57,000 children die annually before their fifth birthday (IGME, 2011). Furthermore, in spite of the observed reduction in under five mortality in Ghana over the years, regional disparities between the northern and southern parts of the country still exist. Under five mortality rate was as low as 50 deaths per 1000 live births in the Greater Accra and Volta Regions to as high as 142 deaths per 1000 live births in Upper West Region and 137 deaths per 1000 live births in
*Corresponding author: Samuel Harrenson Nyarko,
Department of Population and Health,University of Cape Coast, Ghana
ISSN: 0975-833X
Vol.
Article History:
Received 03rd September, 2013
Received in revised form 08th October, 2013
Accepted 25th November, 2013
Published online 02nd December, 2013
Key words: Childhood, Mortality, Ghana.
RESEARCH ARTICLE
CHILDHOOD MORTALITY IN GHANA: A COMPARATIVE STUDY OF 2003
*Samuel H. Nyarko
Department of Population and Health,
University of Cape Coast, Ghana
ABSTRACT
Although childhood mortality rates have been steadily declining in Ghana over the last two decades, the rate of decline has been very slow and uneven. This study compares the determinants of childhood mortality in Ghana for 2003 and 2008. Secondary data from the 2003 and 2008 Ghana Demographic Health Surveys were used for the study. Bivariate analysis and binary logistic regression were used to examine the relationship between socio-demographic, household/environmental, and biomedical characteristics of mothers and childhood mortality for both survey years. The results show that childhood mortality had a significant relationship with parity, household size, and dura breastfeeding for both survey years; and that mothers with higher parity; mothers from small size households and mothers who never breast fed were significantly likely to experience childhood mortality compared to their counterparts, for both 2003 and 2008. Furthermore, work status and mosquito bed net use significantly influenced childhood mortality for 2003 while religion and type of birth significantly influenced childhood mortality for 2008. Some socio
household/environmental as well as biomedical factors actually influenced childhood mortality for both survey periods.
is an open access article distributed under the Creative Commons Attribution License, which permits unrestricted use, distribution, and reproduction in any medium, provided the original work is properly cited.
The fourth goal of the Millennium Development Goals (MDG) is to reduce childhood mortality in Ghana to two-thirds the 1990 value (122 deaths per 1000 live births) by the year 2015.
the Government of Ghana adopted the High Impact
(HIRD) approach among other existing effective health, and nutrition national strategy for reducing childhood Meanwhile, even though under five d in Ghana over the last two decades, the rate of decline has been very slow and uneven. Under five mortality rate in Ghana has declined slowly from 155 deaths per 1000 live births in 1988 to 80 deaths per 1000 live births in 2008. The under five mortality rate of 80 deaths per 1000 live births in Ghana means that one in every thirteen Ghanaian children dies before reaching age five and nearly three in five of these deaths occur in the first year of life ., 2009). Also, under five mortality rate is higher than the world average of 57 deaths per 1000 live births in 2010. In Ghana, about 57,000 children die annually before . Furthermore, in spite of the observed reduction in under five mortality in Ghana over the rs, regional disparities between the northern and southern parts of the country still exist. Under five mortality rate was as low as 50 deaths per 1000 live births in the Greater Accra and Volta Regions to as high as 142 deaths per 1000 live births in
r West Region and 137 deaths per 1000 live births in
University of Cape Coast, Ghana.
Northern Region (GSS et al., 2009).
studies have been conducted to examine various factors that determine under five mortality in Ghana over the past years (Tawiah, 1979; Gyimah, 2002; Tettey, 2003; Gyimah, 2007). However, all these studies were carried out for single p As a result, this study sought to go further to compare the levels and determinants of childhood mortality for two consecutive periods using the 2003 and 2008 Ghana Demographic and Health Surveys.
DATA AND METHODS
The study used secondary data
Demographic and Health Surveys (GDHS) children’s data file. GDHS is undertaken by Ghana Statistical Service in conjunction with Macro International within the broader framework of DHS program
GDHS includes a complete birth history of women and hence provides good knowledge of levels, differentials, and particularly age patterns of childhood mortality.
a nationally representative survey of women age 15 to 49 and men age 15 to 59 that used
selecting households for the data collection. The 2003 and 2008 surveys are the fourth and fifth surveys in the series of national level population and health survey conducted as part of the global DHS programme, and was desi
data to monitor the population and health situation in Ghana. Data collection took place over a three
July to late October 2003 for the 2003 GDHS and
month period, from early September to late November, 2008 for the 2008 GDHS (GSS et al., 2004;
International Journal of Current Research
Vol. 5, Issue, 12, pp. 3747-3753, December,2013
INTERNATIONAL
CHILDHOOD MORTALITY IN GHANA: A COMPARATIVE STUDY OF 2003-2008
University of Cape Coast, Ghana
Although childhood mortality rates have been steadily declining in Ghana over the last two decades, the rate of decline has been very slow and uneven. This study compares the determinants of childhood 2003 and 2008. Secondary data from the 2003 and 2008 Ghana Demographic Health Surveys were used for the study. Bivariate analysis and binary logistic regression were demographic, household/environmental, and biomedical characteristics of mothers and childhood mortality for both survey years. The results show that childhood mortality had a significant relationship with parity, household size, and duration of breastfeeding for both survey years; and that mothers with higher parity; mothers from small size households and mothers who never breast fed were significantly likely to experience childhood and 2008. Furthermore, work status and mosquito bed net use significantly influenced childhood mortality for 2003 while religion and type of birth significantly influenced childhood mortality for 2008. Some socio-demographic, l as biomedical factors actually influenced childhood mortality for
is an open access article distributed under the Creative Commons Attribution License, which permits unrestricted
., 2009). As such, a number of studies have been conducted to examine various factors that determine under five mortality in Ghana over the past years (Tawiah, 1979; Gyimah, 2002; Tettey, 2003; Gyimah, 2007). However, all these studies were carried out for single periods. As a result, this study sought to go further to compare the levels and determinants of childhood mortality for two consecutive periods using the 2003 and 2008 Ghana Demographic and Health Surveys.
secondary data from the 2003 and 2008 Ghana Demographic and Health Surveys (GDHS) children’s data file. GDHS is undertaken by Ghana Statistical Service in conjunction with Macro International within the broader framework of DHS programmes for developing countries. includes a complete birth history of women and hence good knowledge of levels, differentials, and particularly age patterns of childhood mortality. The GDHS is a nationally representative survey of women age 15 to 49 and a two-stage sample design for selecting households for the data collection. The 2003 and 2008 surveys are the fourth and fifth surveys in the series of national level population and health survey conducted as part of the global DHS programme, and was designed to provide data to monitor the population and health situation in Ghana. Data collection took place over a three-month period, from late July to late October 2003 for the 2003 GDHS and a three-month period, from early September to late November, 2008
The dependent (outcome) variable for the study was under five mortality (5q0), defined as deaths occurring among live-born babies between birth and the fifth birthday (0-59 months). Three main categories of independent variables were considered in the study: socio- demographic (maternal age, maternal education, religious affiliation, ethnicity, marital
status, maternal work status, and parity),
household/environmental (household size, wealth status, type of residence, region of residence, source of drinking water, type of toilet facility, and use of mosquito bed net), and biomedical (timing of prenatal care, place of delivery, type of delivery, type of birth, sex of child, birth order, preceding birth interval, and duration of breastfeeding). The statistical software Stata (Stata.11) was used to process the data. Bivariate and binary logistic regression analyses were carried out. The bivariate analysis was used to present proportions of childhood mortality while stepwise logistic regression model was used to examine the effect of independent variables on childhood
mortality,while controlling for other variables for both study
periods. Logistic regression model was used because the dependent variable (under-five mortality (5q0)) is dichotomous denoting whether or not a child is alive before age five and provides the odds as well as the relationships with childhood mortality. Three models were used to examine the effects of each of the three main categories of variables on under five mortality for both study periods.
RESULTS AND DISCUSSION
Childhood mortality and socio-demographic characteristics
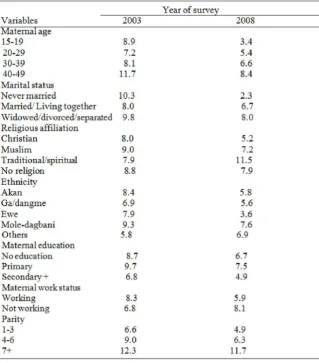
[image:2.595.147.467.383.747.2]The results in Table 1 indicate that the proportion of childhood mortality was highest for children of mothers aged 40 to 49 for both 2003 and 2008 (11.7% and 8.4% respectively) and lowest for children of mothers aged 20 to 29 (7.2%) and 15 to 19 (3.4%) for 2003 and 2008 respectively. It is therefore clear that in both 2003 and 2008, childhood mortality proportions increased with increasing maternal age, showing a positive linear relationship between childhood mortality and maternal age at birth. However, Bhalotra and van Soest (2008) rather observed a curvilinear relationship between maternal age and child mortality, where childhood mortality was highest for both younger and older mothers. Furthermore, from Table 1, it can be observed that in 2003, proportion of childhood mortality was highest (10.3%) for children whose mothers were never married and lowest (8.0%) for children whose mothers were married/living together. However, in 2008, proportion of childhood mortality was highest (8.0%) for children whose mothers were widowed/divorced/separated and lowest (2.3%) for children whose mothers were never married. The result for 2008 is consistent with the findings from a study by Antai (2010) which found that children born to mothers who have not been married seem to have better chances of survival than children of married mothers. However, Goro (2007) asserts that
children born to women who are not in union are almost two times more likely to die than children born to women who are in union. From Table 1, proportion of childhood mortality in 2003 was highest (9.0%) for children whose mothers were Muslims and lowest (7.9%) for children whose mothers were traditionalists/spiritualists. In 2008, however, it was highest (11.5%) for children of traditional/spiritual mothers and lowest (5.2%) for children of Christian mothers. This result is consistent with the result of a study in Ghana by Ahiadeke (1982) who found that child mortality rate is lower among Christian mothers than Muslim mothers and contrary to the finding for 2003. The proportion of childhood mortality was highest for children of Mole-Dagbani mothers for both 2003 and 2008 (9.3% and 7.6% respectively) and lowest for children of mothers from other ethnic groups (5.8%) and children of Ewe mothers (3.6%) for 2003 and 2008 respectively (Table 1). This means that more childhood deaths occurred among children of Mole-Dagbani mothers than children of mothers from the other ethnic groups in both 2003 and 2008 (Gyimah, 2002) and less childhood deaths occurred among children of mothers from other tribes and children of Ewe mothers for both periods respectively. From Table 1, proportion of childhood mortality was highest for children whose mothers had attained primary school education for both 2003 and 2008 (9.7% and 7.5% respectively) and lowest for children whose mothers had attained secondary school education or higher for both 2003 and 2008 (6.8% and 4.9% respectively). This means that children born to mothers with secondary or higher education had relatively better chances of survival until age five for both 2003 and 2008 (Murphy & Wang, 2001). In 2003, proportion of childhood mortality was higher for children whose mothers were working (8.3%) than that for children whose mothers were not working (6.8%) while in 2008, it was higher for children whose mothers were not working (8.1%) than that for children whose mothers were working (5.9%) (Table 1). This
means that there was negative relationship between maternal
work and childhood survival in 2008 (Mondal et al., 2009, Uddin et al., 2009) and positive relationship in 2003 (Wharton, 2009). This could possibly be because of the fact that majority of non-working mothers are family helpers and hence do not have cash in hand to provide better health care for their sick children to improve their chances of survival (Mondal et al., 2009). The proportion of childhood mortality was highest for children whose mothers had parity of 7 or more for both 2003 and 2008 (12.3% and 11.7% respectively) and lowest for children whose mothers had parity of 1-3 for both periods (6.6% and 4.9% respectively) (Table 1). It is clear that childhood mortality proportions increased with an increase in parity for the study period (Lucas & McDonald, 1980). However, some literature suggests that births of parity one and high parity births are associated with higher deaths (Caldwell, 1979).
Logistic regression analysis was carried out for the independent variables in three successive models for both periods. Model 3 (M3) outlines the combined effect of all the three categories of the independent variables (socio-demographic, household/ environmental and biomedical) (Appendices 1 and 2). The logistic regression model have estimates on the extent to which
socio-demographic variables (maternal age, maternal
education, marital status, religious affiliation, ethnicity, maternal work status and parity) affect the likelihood of a child
dying before age five for both survey years. The study established that there was a significant relationship between parity and childhood mortality for both 2003 and 2008. The odds of childhood mortality were higher for children whose mothers had parity of 7 or more compared to children whose mothers had parity of 1 to 3 for both 2003 and 2008 (1.90 times and 1.68 times respectively). It implies that the risk of childhood mortality increased with increasing level of parity. This affirms the findings of Caldwell (1979) that births of parity one and high parity births are associated with high child mortality risks.
Furthermore, evidence from the logistic regression results indicates that there was significant relationship between religious affiliation and childhood mortality for 2008 only (Appendices 1 and 2). The odds of childhood mortality for 2003 were higher (1.33 times) for children of Muslim mothers and lower (0.69 times) for children of mothers who had no religion compared to Christian mothers while for 2008, the
odds were higher (1.74 times) for children of
traditional/spiritual mothers compared to Christian mothers. This echoes what Ahiadeke (1982) found that childhood mortality risk is lower among Christian mothers than Muslim mothers. Also, there was significant relationship between maternal work status and childhood mortality for 2003 only. For 2003, the odds of childhood mortality were lower (0.24 times) for children whose mothers were not working compared to children of mothers who were working (Wharton, 2009) while for 2008, the odds were higher (1.34 times) for children of mothers who were not working compared to children of mothers who were working (Bawah, 2001).
Childhood mortality and household/environmental
characteristics
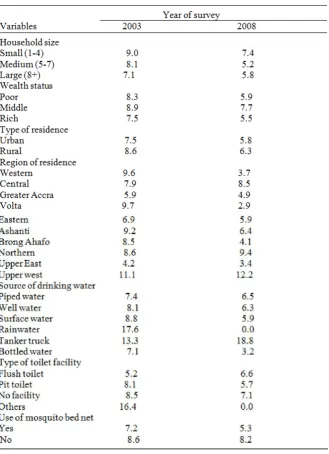
From Table 2, proportion of childhood mortality was higher for children from rural areas for both 2003 and 2008 (8.6% and 6.3% respectively) and lower for children from urban areas for both periods (7.5% and 5.8% respectively). This echoes the findings from studies by Tettey (2003) and Gyimah (2004) that children living in rural areas had higher risks of childhood mortality relative to children living in urban areas.
For both 2003 and 2008, the proportion of childhood mortality was highest for children from Upper West Region (11.1% and 12.2% respectively) and lowest for children from Upper East Region (4.2%) and for children from Volta Region (2.9%) for 2003 and 2008 respectively (Table 2). This finding is contrary to the study by Twum-Baah et al. (1994) which found that northern region appears to have the highest mortality risk and the lowest rate being in Greater Accra. The proportion of childhood mortality was found highest for children whose source of drinking water was rain water (17.6%) in 2003 and for children whose source of drinking water was tanker truck in 2008; and lowest for children whose source of drinking water
was bottled water for both 2003 and 2008 (7.1% and 3.2% respectively) (Table 2). However, there was no death recorded for children whose source of drinking water was rain water in 2008, even though rain water as a source of drinking water recorded highest proportion of childhood mortality in 2003. Bottled water was a safe and improved source of drinking water for childhood survival than
surface water, well and piped water for the five year period preceding the two surveys while rain water was the safest for 2008. This is contrary to the finding from a study by Massawe (1991) which found that water from rivers and taps (which are more likely to be contaminated) are strongly related to higher levels of childhood mortality compared to that obtained from wells, and Kembo and van Ginneken (2009) which found that the odds of dying during childhood for children born in households with access to piped drinking water are reduced relative to those born in households without access to piped drinking water. From Table 2, proportion of childhood mortality was highest for children who used other toilet
[image:4.595.143.473.152.607.2]facilities such as bucket and pan (16.4%) and for children who
had no toilet facility (7.1%) for 2003 and 2008 respectively; and lowest for children whose toilet facility was flush toilet (5.2%) and children who used pit toilet facility (5.7%) for both periods respectively. However, no death was recorded for children who used other types of toilet facilities in 2008. Children from households that used other toilet facilities and those without toilet experienced a comparatively more childhood deaths in 2003 and 2008 respectively. This may be possibly because these people had to use public toilets, bush or any other means that are comparatively unhygienic and perilous to the health of children. This affirms studies by Mondal et al. (2009), and Kembo and van Ginneken (2009) which found that households having hygienic latrines have considerably lower childhood mortality level than those without such facilities and that childhood mortality increases when sanitary conditions decrease. For both 2003 and 2008, the proportion of childhood mortality was higher for children whose households did not use mosquito bed nets (8.6% and 8.2% respectively) and lower for children whose households used mosquito bed net for both periods (7.2% and 5.3% respectively) (Table 3). It is obvious that the use of mosquito bed nets in households has a positive effect on childhood mortality. This affirms a study in Southern Tanzania by Gosoniu et al. (2008) which found that the ownership of household bed net was the only factor that was significantly associated with childhood mortality reduction. The logistic regression model also established that there was a significant relationship between household size and childhood mortality for both 2003 and 2008.
The odds of childhood mortality were lower for children of mothers from medium sized households (0.44 times and 0.79
times for 2003 and 2008 respectively) and children of mothers from large sized households (0.20 times and 0.32 times for 2003 and 2008 respectively) compared to children of mothers from small sized households. Additionally, the test results show that there was significant relationship between use of mosquito bed net and childhood mortality for 2003 only. For both 2003 and 2008, the odds of childhood mortality were higher for children of mothers who did not use mosquito bed nets (1.73 times and 1.40 times respectively) compared to children of mothers who used mosquito bed nets. Thus, children of mothers who did not use mosquito bed nets in their households were more likely to die before age five for both periods.
Childhood mortality and biomedical characteristics
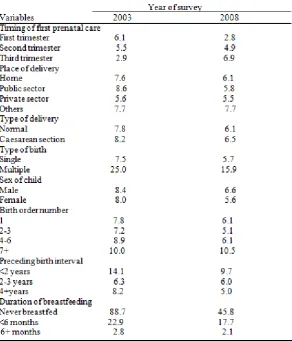
[image:5.595.156.449.411.753.2]From Table 3, the results reveal that proportion of childhood mortality in 2003 was highest (6.1%) for children whose mothers sought their first prenatal care during the first trimester of pregnancy and lowest (2.9%) for children whose mothers sought their first prenatal care during the third trimester. However, in 2008, it was found highest (6.6%) for children whose mothers sought their first prenatal care during the third trimester of pregnancy and lowest (2.8%) for children whose mothers sought their first prenatal care during the first trimester of pregnancy. It is therefore evident that while in 2003, the proportions of childhood mortality decreased with increase in timing of first prenatal care, in 2008 the proportions increased with an increase in timing of first prenatal care. The result for 2008 is therefore consistent with findings from a study
Table 3. Proportion of childhood mortality by biomedical characteristics
conducted by Uddin et al. (2009) which found that childhood mortality risk was highest among children whose mother did not receive antenatal check during pregnancy and lowest for children whose mothers accessed their first antenatal check during the first four months of pregnancy; but contrary to the result for 2003. Furthermore, Table 3 shows that the proportion of childhood mortality was highest for children whose mothers delivered at public hospitals (8.6%) and for children whose mothers delivered at other places (7.7%) for 2003 and 2008 respectively. However, the proportions were lowest for children whose mothers delivered at private hospitals for both 2003 and 2008 (5.6% and 5.5% respectively). It is notable that there were relatively more childhood deaths for children of mothers who delivered at other delivery centres than for children of mothers who delivered at private hospitals for both periods. This is affirmed by the findings from a study conducted by Seckin (2009) which found that medical attention at the time of delivery and antenatal care are significant factors in the survival chance of the new born, and that survival is higher among children born in good health facilities and attended to by professional doctors than those born at home attended to by untrained personnel. Table 3 also indicates that the proportions of childhood mortality were higher for children who were delivered through caesarean section for both 2003 and 2008 (8.2% and 6.5% respectively) and lower for children who were delivered through normal deliveries for both periods (7.8% and 6.1% respectively). It is therefore indicative that childhood mortality proportions increased with an increase in complications during child birth for both 2003 and 2008.
On the contrary, Hossain and Mondal (2009) found that childhood mortality risks are higher among those children who were born through normal delivery than those who were born through caesarean section. Moreover, the proportions of childhood mortality were higher for children who were part of multiple births for both 2003 and 2008 (25% and 15.9% respectively) and lower for single birth children for both periods (7.1% and 3.2% respectively) (Table 4). It is therefore obvious that childhood mortality proportions increased with an increase in multiplicity of birth for both periods. Likewise, Kembo and van Ginneken (2009) found that multiple births are associated with an elevated mortality risk and that childhood mortality risk associated with multiple births is more than two times greater than among single births. Table 3 further reveals that for both 2003 and 2008, the proportions of childhood mortality were found higher for male children (8.4% and 6.6% respectively) and lower for female children for both periods (8.0% and 5.6% respectively). It is obvious that more childhood deaths occurred among male children than female children for both periods. This is consistent with findings from studies conducted by Masuy-Stroobant (2001) females have advantage over males in terms of survival, and contrary to findings from studies conducted by Hill and Upchurch (1995) preference for male child has led to a higher mortality in female children relative to males. Results from Table 3 also show that for both 2003 and 2008, the proportions of childhood mortality were highest for children whose birth order number were 7 or more (10.0% and 10.5% respectively) and lowest for children whose birth order number were 2-3 for both 2003 and 2008 (7.2% and 5.1% respectively). This suggests that the first and higher birth orders (7+) experienced a relatively more childhood deaths than middle birth orders and for that matter childhood mortality showed a J-shaped relationship with birth
order number for both 2003 and 2008. This finding is
consistent with the results from studies conducted by Goro
(2007) which found that child mortality risks are highest for
children of high birth order (from birth order 5) followed by first born and lower for second and third born. Contrary to this, Wharton (2009) also found that higher birth order of a child (born later down the line) increases the chances of surviving anywhere from 40 to 85 percent. This may be so because high birth order children are born to older and wiser mothers. They may also have older siblings (hopefully), all of whom may aid in the younger child’s development.
The proportions of childhood mortality were found highest for children whose preceding birth interval was less than 2 years for both 2003 and 2008 (14.1% and 9.7% respectively) and lowest for children whose preceding birth interval was 2-3 years (6.3%) and for children whose preceding birth interval was 4 and above years (6.0%) for 2003 and 2008 respectively (Table 3). This suggests that preceding birth interval had U-shaped relationship with childhood mortality in 2003 while childhood mortality proportions decreased with an increase in preceding birth interval in 2008 depicting a negative relationship with childhood mortality. It is therefore noteworthy that longer birth intervals improve the survival chances of the succeeding child (Bhalotra & van Soest, 2008). Also, the proportions of childhood mortality were highest for children who were never breastfed for both 2003 and 2008 (88.7% and 45.8% respectively) and lowest for children who were breastfed for 6 or more months for both periods (2.8% and 2.1% respectively). Thus, the proportions of childhood mortality decreased with an increase in duration of breastfeeding for both periods and for that matter long duration of breast feeding may help in ameliorating childhood mortality. This affirms the findings from a study conducted by Kyei (1999) the longer the duration of breastfeeding (from HIV negative women), the lower the risk of child mortality. Contrary to this, some literature on the determinants of childhood mortality indicates a positive relationship between duration of breastfeeding and child mortality risk (Guilkey & Riphahn, 1998). Furthermore, the logistic regression model (Appendices 1 and 2) revealed that there was significant relationship between duration of breastfeeding and childhood mortality for both 2003 and 2008. For both 2003 and 2008, the odds of childhood mortality were lower for children who were breastfed for less than 6 months (0.73 times and 0.37 times respectively) and children who were breastfed for 6 and above months (0.65 times and 0.015 times respectively) compared to children who were never breastfed. Evidently, children who were never breast fed were more likely to die before age five than children breast fed for 6 or more months for both periods. The chances of childhood mortality therefore decreased with an increase in duration of breastfeeding (Kyei, 1999). Additionally, the results from the test showed significant relationship between type of birth and childhood mortality for 2008 only. Thus, the odds of childhood mortality were higher for children who were part of multiple births for both 2003 and 2008 ((1.22 times and 2.76 times respectively) compared to children who were single born. This implies that children who were part of multiple births were more likely to die before age five than single birth children (Kembo & van Ginneken, 2009). Conclusion
The study established that some socio-demographic,
parity (number of children), household size and duration of breastfeeding of child had significant influence on childhood mortality for both survey years. Thus, these factors consistently determined childhood mortality for the five-year periods preceding both the 2003 and 2008 Ghana Demographic and Health Surveys; while mother’s work status and the use of mosquito bed net determined childhood mortality for 2003 only, and religious affiliation and type of birth for only 2008. It follows that exclusive breast feeding, fertility regulation as well as extensive distribution and use of mosquito bed nets should be the key focus of the Ghana government, if Ghana will be able to meet her MDG 4 by 2015. Parents also have a key role to play by giving absolute social and medical care to children, especially those children who are part of multiple births in order to improve upon their survival chances.
REFERENCES
Ahiadeke, C. 1982. Some socio-economic determinants of infant and early childhood mortality in Ghana. In: Ardayfio-Schandorf, E. (ed.). Bridges of development: A compendium of gender and the Ghanaian family (524-534). Accra: Woeli.
Antai, D. 2010. Social context, social position survival: Social determinants of child health inequities in Nigeria. [PhD thesis]. Stockholm: Karolinska Institutet, Departmennt of Environmental Medicine.
Bawah, A.A. 2001. Living standards, household size and childhood survival in Africa: Evidence from census data. Philadelphia: University of Pennsylvania, Population Sudies Centre. Retrieved from http://www.iussp.org/ Brazil2001/s60/S69_01_ bawah.pdf.
Bhalotra, S. and van Soest, A. 2008. Birth-spacing, fertility and neonatal mortality in India: Dynamics, frailty, and fecundity. J. of Econo., 143(2): 274-290.
Burstrom, B., Diderichsen, F., and Smedman, L. 1999. Child mortality in Stockholm during 1885-1910: The impact of household size and number of children in the family on the risk of death from measles. Am. J. Epidem., 149(12): 1134-1141.
Caldwell, J. C. 1979. Education as a factor in mortality decline: An examination of Nigerian data. Pop. Stud., 33(3): 395-413.
Ghana Statistical Service [GSS], Ghana Health Service [GHS], & ICF Macro. 2009. Ghana demographic and health survey 2008. Accra: Author.
Ghana Statistical Service [GSS], Noguchi Memorial Institute for Medical Research [NMIMR], and ORC Macro. 2004. Ghana demographic and health survey 2003. Calverton: Author.
Goro, I.M. 2007. The stalling child mortality in Ghana: The case of the three northern regions. Paper presented at the 5th Conference of Union for Africa Population Studies (UAPS), Arusha, Tanzania, December 10-14 2007.
Gosoniu, L. Vounatsou, P., Tami, A., Nathan, R., Grundmann,
H., and Lengeler, C.2008. Spatial effects of mosquito bed
nets on child mortality. BMC Pub. H., 8: 35-46.
Guilkey, D. K., and Riphahn, R. T. (1998). The determinants of child mortality in the Philippines: Estimation of a structural model. J. of Dev. Eco., 56(2): 281-305.
Gyimah, S.O. 2002. Ethnicity and infant mortality in Sub-Saharan Africa: The case of Ghana. London, Canada: Population Studies Centre.
Gyimah, S.O. 2004. Maternal education and infant mortality. Legon, Ghana: University of Ghana.
Gyimah, S.O. 2007. What has faith got to do with it? Religion and child survival in Ghana. J. of Bio. Sc., 39: 923–937. Hill, K. & Upchurch, D.M. 1995. Gender differences in child
health: Evidence from the demographic and health surveys. Pop. Dev. Rev., 21(1): 127-151.
Hossain, K. & Mondal, N.I. 2009. A study on the health factors of infant and child mortality in Rajshahi, Bangladesh. As. J.
of Med. Sc., 1(3): 82-87.
Inter-agency Group for Child Mortality Estimation [IGME] 2011. Levels and trends in child mortality-report 2011. New York: UNICEF.
Kembo, J., & van Ginneken, J.K. 2009. Determinants of infant and child mortality in Zimbabwe: Results of multivariate hazard analysis. Dem. Res., 21(13): 367-384.
Kyei, K.A. 1999. The mode of feeding that promotes higher survival among children. In: UAPS (ed.). The African population in the 21st century (pp. 193-212). Dakar: UAPS. Lucas, D. and McDonald, P. 1980. Interrelations between the demographic variables. In: Lucas, D. and Meyer, P. (Eds.). Beginning population studies (pp. 133-54). Canberra: Australian National University Press.
Massawe, M.B.B. 1991. The effect of age of mother and Parity on infant mortality: A case study of Mbeya Region. [Master’s thesis]. Dar Es Salaam: University of Dar Es Salaam, Department of Demography.
Masuy-Stroobant, G, 2001. The determinant of infant mortality: How far are conceptual frameworks really modelled? Louvain: Université Catholique de Louvain (Document de Travail; 13).
Ministry of Health [MOH]. 2006. Ghana’s integrated child health campaign: The potential to save at least 20,000 young children’s lives (November 1-5 2006). Retrieved from http://www.unicef.org/media/files/Ghana_ Health_ Campaign.pdf.
Mondal, N.I., Hossain, K., & Ali, K. 2009. Factors influencing infant and child mortality: A case study of Rajshahi District, Bangladesh. J. Hum. Ecol., 26: 31-39.
Murphy, M., & Wang, D. 2001. Do previous birth interval and mother's education influence infant survival? A Bayesian model averaging analysis of Chinese data. Pop. Stud.: J.
Demo., 55(1): 37-47.
Seckin, N. 2009. Determinants of infant mortality in Turkey. [Master’s thesis]. Ankara: Middle East Technical University, Graduate School of Social Sciences.
Tawiah, E.O. 1979. Some demographic and social differentials in Infant and early childhood mortality in Ghana (Experts Group Meeting). Monrovia, Liberia.
Tettey, L.O. 2003. Socio-economic differentials of infant and child mortality in Ghana and Nigeria. [Master’s thesis]. Legon: University of Ghana, RIPS.
Twum–Baah, N., Nyarko, P.E., Quashie, C. E., Caiquo, I. B., & Amuah, E. 1994. A study of infant, child and maternal mortality in Ghana. Accra: GSS, MoH and UNICEF. Uddin, J., Hossain, Z., & Ullah, M.O. 2009. Child mortality in
a developing country: A statistical analysis. J. App. Quant.
Meth., 4(3): 270-283.
Wharton, G.T. 2009. Proximate factors of child mortality in post-conflict Liberia. [PhD thesis]. Chapel Hill: University of North Carolina, Department of Economics.