RESEARCH ARTICLE
SPATIAL RELATIONSHIP AMONG PHYTOPLANKTON ABUNDANCE AND PHYSICO CHEMICAL
PARAMETERS AROUND THE COASTAL WATERS OF KERALA
Shibini Mol, P. A., Dayala, V. T. and *Sujatha C. H.
Department of Chemical Oceanography, School of Marine Sciences, Cochin University of
Science and Technology, Cochin-16
ARTICLE INFO ABSTRACT
The phytoplankton abundance associated with hydrographical parameters at 28 selected stations (April 2012) of Kerala Coast have been discussed. Considerable variations were noticed both in magnitude and compositions in the phytoplankton density. In this investigation, a total 104 species of phytoplankton were identified and represents in different distinct class viz: Bacillariophyceae (78), Dinophyceae (22), Chlorophyceae (3), Cyanophyceae (1), and Dictyophycae (1). Diatom species were more prominent within the stations. However, Coscinodiscus species
Asterionella species, Biddulphia species and Pleurosigma species were the common species found in almost all the
stations and at station 25, blooming of Asterionella species were noticed. Compared to other stations, station 25 followed a high salinity and high silicate concentration. Nitrite showed a very slight increase whereas ammonia, nitrate and phosphate showed a complete depletion. The Phytoplankton population density depends upon the physico chemical parameters, and their intensity was mostly coupled with the parameters like salinity, pH, silicate and nitrite.
Copyright © 2013 Shibini Mol, et al., This is an open access article distributed under the Creative Commons Attribution License, which permits unrestricted use, distribution, and reproduction in any medium, provided the original work is properly cited.
INTRODUCTION
Phytoplankton plays an important role in the ecosystem because they form the basis of food chain and possess a substantial influence on stable environmental balance. Phytoplankton species composition, population density, and primary productivity will vary from coast to coast and sea to sea depending upon varying hydro biological features. The differential effect of hydrographical factors contributes to a wide spatial- temporal variations on individual species and they serve as good indicators of water quality including pollution (Liu
et al., 2004). It is worth mentioning to state according to Reynolds,
(1993) the changes in species composition and dominance of phytoplankton can be mediated by a variety of mechanisms including pH, salinity, and nutrient supply. The constant nutrient supply always supports the rich phytoplankton production, but generally nitrogen (N) and phosphorous (P) have been considered as the potentially limiting nutrients for phytoplankton growth in the aquatic ecosystems (Neill, 2005). In polluted waters, inorganic ammonia (NH4) plays a significant role in the phytoplankton growth (EEA, 1999). In addition to nutrients, physical properties such as salinity and pH (McLusky, 1971) are also found to play major roles in the regulation of phytoplankton growth and their distribution. The present study focuses on the spatial distribution pattern of phytoplankton community as a whole and the influence of hydrographical parameters on phytoplankton species composition and their abundance in coastal waters of Kerala.
MATERIALS AND METHODS
Kerala is the largest coastline in the west coast of India bordering the
*Corresponding author: Sujatha C. H.
Department of Chemical Oceanography, School of Marine Sciences, Cochin University of Science and Technology, Cochin-16.
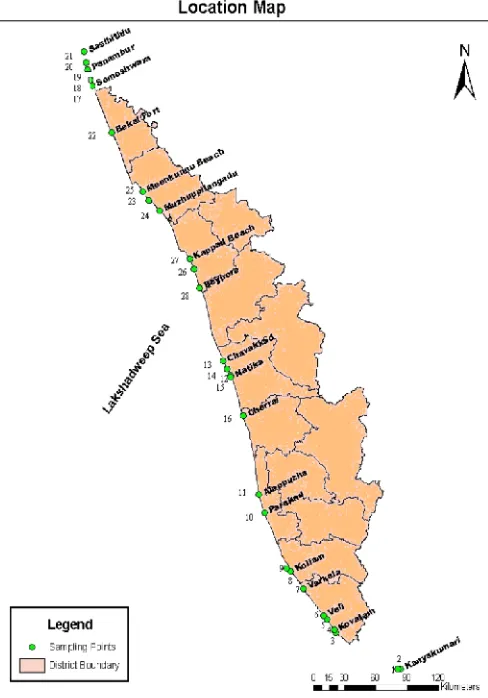
Arabian Sea at the south western part of the peninsular India extending from latitudes 8°.17'.30" N and 12°. 47'.40" N and east longitudes 74°.27'47" E and 77°.37'.12" E. Study area extends between Kanyakumari (N 08004.714’& E 77 033.076) to Mangalore (N13004’11.71” & E 74046’34.61)Fig (1). Field data like salinity and pH were measured by Mohr-Knudsen titration technique and using potable pH meter respectively. Dissolved oxygen was estimated by the modified Winkler’s method (Strickland and Parsons, 1972). For analysis of nutrients, water samples were collected in clean plastic bottles and kept in an ice box and immediately transferred to the laboratory. Nutrients (nitrite, nitrate, phosphate and ammonia) were measured concurrently (Strickland and Parsons, 1972). To analyze the phytoplankton cell counts and their composition, water samples were filtered through phytoplankton net made up of bolting silk cloth (mesh size 20µm). The collected samples were preserved in 4% neutralized formalin for further analysis. A setting and siphoning procedure was followed to concentrate the samples from 250ml to 20ml (Utermohl, 1958). The planktonic micro algae filtered from 2L of water was made up to a fixed volume concentrate. 1 ml of this sample was transferred to the sedge wick-Rafter counting cell (the volume of this chamber is 1 ml). The number of micro algae present in the cell 1000 grids was calculated. Repeated the counting three times and considered the average. The phytoplankton analyzed was assigned to major classes’ viz. diatoms, dinoflagellates, blue green algae and green algae. The total numbers of planktonic algal species present in the water sample were calculated using the formula,
N = m x v/V
N = total number of phytoplankton cell per liter of water filtered; m = average number of phytoplankton cells in 1 ml of plankton sample;
v = volume of plankton concentrate (ml); V = volume of total water filtered (L).
ISSN: 0975-833X
International Journal of Current Research
Vol. 5, Issue, 10, pp.3094-3099, October, 2013
INTERNATIONAL JOURNAL
OF CURRENT RESEARCH
Article History:
Received 18hJuly, 2013
Received in revised form 06thAugust, 2013
Accepted 15thSeptember, 2013
Published online 23rdOctober, 2013
Key words:
Phytoplankton,
Hydrographical parameters, Kerala coast.
RESEARCH ARTICLE
SPATIAL RELATIONSHIP AMONG PHYTOPLANKTON ABUNDANCE AND PHYSICO CHEMICAL
PARAMETERS AROUND THE COASTAL WATERS OF KERALA
Shibini Mol, P. A., Dayala, V. T. and *Sujatha C. H.
Department of Chemical Oceanography, School of Marine Sciences, Cochin University of
Science and Technology, Cochin-16
ARTICLE INFO ABSTRACT
The phytoplankton abundance associated with hydrographical parameters at 28 selected stations (April 2012) of Kerala Coast have been discussed. Considerable variations were noticed both in magnitude and compositions in the phytoplankton density. In this investigation, a total 104 species of phytoplankton were identified and represents in different distinct class viz: Bacillariophyceae (78), Dinophyceae (22), Chlorophyceae (3), Cyanophyceae (1), and Dictyophycae (1). Diatom species were more prominent within the stations. However, Coscinodiscus species
Asterionella species, Biddulphia species and Pleurosigma species were the common species found in almost all the
stations and at station 25, blooming of Asterionella species were noticed. Compared to other stations, station 25 followed a high salinity and high silicate concentration. Nitrite showed a very slight increase whereas ammonia, nitrate and phosphate showed a complete depletion. The Phytoplankton population density depends upon the physico chemical parameters, and their intensity was mostly coupled with the parameters like salinity, pH, silicate and nitrite.
Copyright © 2013 Shibini Mol, et al., This is an open access article distributed under the Creative Commons Attribution License, which permits unrestricted use, distribution, and reproduction in any medium, provided the original work is properly cited.
INTRODUCTION
Phytoplankton plays an important role in the ecosystem because they form the basis of food chain and possess a substantial influence on stable environmental balance. Phytoplankton species composition, population density, and primary productivity will vary from coast to coast and sea to sea depending upon varying hydro biological features. The differential effect of hydrographical factors contributes to a wide spatial- temporal variations on individual species and they serve as good indicators of water quality including pollution (Liu
et al., 2004). It is worth mentioning to state according to Reynolds,
(1993) the changes in species composition and dominance of phytoplankton can be mediated by a variety of mechanisms including pH, salinity, and nutrient supply. The constant nutrient supply always supports the rich phytoplankton production, but generally nitrogen (N) and phosphorous (P) have been considered as the potentially limiting nutrients for phytoplankton growth in the aquatic ecosystems (Neill, 2005). In polluted waters, inorganic ammonia (NH4) plays a significant role in the phytoplankton growth (EEA, 1999). In addition to nutrients, physical properties such as salinity and pH (McLusky, 1971) are also found to play major roles in the regulation of phytoplankton growth and their distribution. The present study focuses on the spatial distribution pattern of phytoplankton community as a whole and the influence of hydrographical parameters on phytoplankton species composition and their abundance in coastal waters of Kerala.
MATERIALS AND METHODS
Kerala is the largest coastline in the west coast of India bordering the
*Corresponding author: Sujatha C. H.
Department of Chemical Oceanography, School of Marine Sciences, Cochin University of Science and Technology, Cochin-16.
Arabian Sea at the south western part of the peninsular India extending from latitudes 8°.17'.30" N and 12°. 47'.40" N and east longitudes 74°.27'47" E and 77°.37'.12" E. Study area extends between Kanyakumari (N 08004.714’& E 77 033.076) to Mangalore (N13004’11.71” & E 74046’34.61) Fig (1). Field data like salinity and pH were measured by Mohr-Knudsen titration technique and using potable pH meter respectively. Dissolved oxygen was estimated by the modified Winkler’s method (Strickland and Parsons, 1972). For analysis of nutrients, water samples were collected in clean plastic bottles and kept in an ice box and immediately transferred to the laboratory. Nutrients (nitrite, nitrate, phosphate and ammonia) were measured concurrently (Strickland and Parsons, 1972). To analyze the phytoplankton cell counts and their composition, water samples were filtered through phytoplankton net made up of bolting silk cloth (mesh size 20µm). The collected samples were preserved in 4% neutralized formalin for further analysis. A setting and siphoning procedure was followed to concentrate the samples from 250ml to 20ml (Utermohl, 1958). The planktonic micro algae filtered from 2L of water was made up to a fixed volume concentrate. 1 ml of this sample was transferred to the sedge wick-Rafter counting cell (the volume of this chamber is 1 ml). The number of micro algae present in the cell 1000 grids was calculated. Repeated the counting three times and considered the average. The phytoplankton analyzed was assigned to major classes’ viz. diatoms, dinoflagellates, blue green algae and green algae. The total numbers of planktonic algal species present in the water sample were calculated using the formula,
N = m x v/V
N = total number of phytoplankton cell per liter of water filtered; m = average number of phytoplankton cells in 1 ml of plankton sample;
v = volume of plankton concentrate (ml); V = volume of total water filtered (L).
ISSN: 0975-833X
International Journal of Current Research
Vol. 5, Issue, 10, pp.3094-3099, October, 2013
INTERNATIONAL JOURNAL
OF CURRENT RESEARCH
Article History:
Received 18hJuly, 2013
Received in revised form 06thAugust, 2013
Accepted 15thSeptember, 2013
Published online 23rdOctober, 2013
Key words:
Phytoplankton,
Hydrographical parameters, Kerala coast.
RESEARCH ARTICLE
SPATIAL RELATIONSHIP AMONG PHYTOPLANKTON ABUNDANCE AND PHYSICO CHEMICAL
PARAMETERS AROUND THE COASTAL WATERS OF KERALA
Shibini Mol, P. A., Dayala, V. T. and *Sujatha C. H.
Department of Chemical Oceanography, School of Marine Sciences, Cochin University of
Science and Technology, Cochin-16
ARTICLE INFO ABSTRACT
The phytoplankton abundance associated with hydrographical parameters at 28 selected stations (April 2012) of Kerala Coast have been discussed. Considerable variations were noticed both in magnitude and compositions in the phytoplankton density. In this investigation, a total 104 species of phytoplankton were identified and represents in different distinct class viz: Bacillariophyceae (78), Dinophyceae (22), Chlorophyceae (3), Cyanophyceae (1), and Dictyophycae (1). Diatom species were more prominent within the stations. However, Coscinodiscus species
Asterionella species, Biddulphia species and Pleurosigma species were the common species found in almost all the
stations and at station 25, blooming of Asterionella species were noticed. Compared to other stations, station 25 followed a high salinity and high silicate concentration. Nitrite showed a very slight increase whereas ammonia, nitrate and phosphate showed a complete depletion. The Phytoplankton population density depends upon the physico chemical parameters, and their intensity was mostly coupled with the parameters like salinity, pH, silicate and nitrite.
Copyright © 2013 Shibini Mol, et al., This is an open access article distributed under the Creative Commons Attribution License, which permits unrestricted use, distribution, and reproduction in any medium, provided the original work is properly cited.
INTRODUCTION
Phytoplankton plays an important role in the ecosystem because they form the basis of food chain and possess a substantial influence on stable environmental balance. Phytoplankton species composition, population density, and primary productivity will vary from coast to coast and sea to sea depending upon varying hydro biological features. The differential effect of hydrographical factors contributes to a wide spatial- temporal variations on individual species and they serve as good indicators of water quality including pollution (Liu
et al., 2004). It is worth mentioning to state according to Reynolds,
(1993) the changes in species composition and dominance of phytoplankton can be mediated by a variety of mechanisms including pH, salinity, and nutrient supply. The constant nutrient supply always supports the rich phytoplankton production, but generally nitrogen (N) and phosphorous (P) have been considered as the potentially limiting nutrients for phytoplankton growth in the aquatic ecosystems (Neill, 2005). In polluted waters, inorganic ammonia (NH4) plays a significant role in the phytoplankton growth (EEA, 1999). In addition to nutrients, physical properties such as salinity and pH (McLusky, 1971) are also found to play major roles in the regulation of phytoplankton growth and their distribution. The present study focuses on the spatial distribution pattern of phytoplankton community as a whole and the influence of hydrographical parameters on phytoplankton species composition and their abundance in coastal waters of Kerala.
MATERIALS AND METHODS
Kerala is the largest coastline in the west coast of India bordering the
*Corresponding author: Sujatha C. H.
Department of Chemical Oceanography, School of Marine Sciences, Cochin University of Science and Technology, Cochin-16.
Arabian Sea at the south western part of the peninsular India extending from latitudes 8°.17'.30" N and 12°. 47'.40" N and east longitudes 74°.27'47" E and 77°.37'.12" E. Study area extends between Kanyakumari (N 08004.714’& E 77 033.076) to Mangalore (N13004’11.71” & E 74046’34.61)Fig (1). Field data like salinity and pH were measured by Mohr-Knudsen titration technique and using potable pH meter respectively. Dissolved oxygen was estimated by the modified Winkler’s method (Strickland and Parsons, 1972). For analysis of nutrients, water samples were collected in clean plastic bottles and kept in an ice box and immediately transferred to the laboratory. Nutrients (nitrite, nitrate, phosphate and ammonia) were measured concurrently (Strickland and Parsons, 1972). To analyze the phytoplankton cell counts and their composition, water samples were filtered through phytoplankton net made up of bolting silk cloth (mesh size 20µm). The collected samples were preserved in 4% neutralized formalin for further analysis. A setting and siphoning procedure was followed to concentrate the samples from 250ml to 20ml (Utermohl, 1958). The planktonic micro algae filtered from 2L of water was made up to a fixed volume concentrate. 1 ml of this sample was transferred to the sedge wick-Rafter counting cell (the volume of this chamber is 1 ml). The number of micro algae present in the cell 1000 grids was calculated. Repeated the counting three times and considered the average. The phytoplankton analyzed was assigned to major classes’ viz. diatoms, dinoflagellates, blue green algae and green algae. The total numbers of planktonic algal species present in the water sample were calculated using the formula,
N = m x v/V
N = total number of phytoplankton cell per liter of water filtered; m = average number of phytoplankton cells in 1 ml of plankton sample;
v = volume of plankton concentrate (ml); V = volume of total water filtered (L).
ISSN: 0975-833X
International Journal of Current Research
Vol. 5, Issue, 10, pp.3094-3099, October, 2013
INTERNATIONAL JOURNAL
OF CURRENT RESEARCH
Article History:
Received 18hJuly, 2013
Received in revised form 06thAugust, 2013
Accepted 15thSeptember, 2013
Published online 23rdOctober, 2013
Key words:
Phytoplankton,
RESULT AND DISCUSSION
Variation in physico-chemical parameters showed an effect on phytoplankton abundance and distribution (Rajkumar et al., 2009; Nowrouzi and Valavi, 2011). The present study revealed that the pH values in most of the investigated sites lie on the alkaline nature. The high pH value (8) was reported in stations 14, 25 and 27. These values appeared suitable for phytoplankton growth and reached its maximum value of production 8984.44 cell/L at station 25, and bacillariophyceae, dinophyceae have their maximum growth noticed at pH >7. But some fluctuations are seen in the present observations, recorded an acidic pH of 5.2 (station 6), 6.1 (stations 1, 2 and 4) and 6.7 at station 3. According to the observation made previously by Bijumon et al. (2000), the pH below 5 considerably reduces the primary productivity of coastal waters. The low density of phytoplankton resulted in these coastal waters in the order 201.11 cell/L, 136 cell/L, 112.73 cell/L and 191.33 cell/L at stations 1, 2, 3 and 4 respectively. Salinity distribution within the coastal water reflects the relative influx of freshwater supplied by rivers. Salinity levels fluctuate with the penetration of tidal flow and with mixing of fresh water and marine water by wind and water current. In non monsoon periods, the fresh water was mixed by the tides and winds out of the estuary and bay. This water was replaced by more oceanic water from offshore, thus showed increased salinity. Salinity value ranges between 6.05 psu to 31.74 psu at stations 20 and 27 respectively. The measured salinity could be attributed to the plankton diversity which act as a limiting factor that influence the distribution of plankton community and earlier findings also supports these inference (Balasubramanian and Kannan, 2005; Sridhar et al., 2006). In most of the stations phytoplankton had shown a direct relationship with salinity. Maximum phytoplankton density was recorded at stations 25 and 14(8984.44 cell/L and 3497.90 cell/L) where salinity was high (14.02 mg/L and 15.64 mg/L) as observed. The same inference was reported earlier from Bay of Bengal by Rajkumar et al. (2009).
DO is very essential and in some cases even limiting factor for maintaining aquatic life. The dissolved oxygen did not show much fluctuation among the stations. The ranges varied between 0.03 mg/L at (stations 23 and 27) and 0.41 mg/L (at station 17). In the present investigation, nutrient analyses were also carried out. The nitrate-nitrogen is one of the suitable indicators of pollution in the water body, the highest value of nitrate 0.13 mg/L was observed at station 28 and 0.03 value was noted in station 26 and 27, while the nitrite content recorded low at stations 4 and 5 and the maximum at stations 10 and 28. On contrary to nitrate and nitrite high value of ammonia was observed and its value fluctuates from 16.49mg/L at station 19 to 145.80 mg/L at station 28. Phosphate concentration registered its nil value at station 20 while the maximum of 0.70 mg/L at station 28, which could be due to the phenomenon of upwelling an event that generally, occurs during premonsoon period (Ramaraju et al., 1992). Spatial distribution of hydrographical parameters was shown in Fig (2).
Composition and Community structure of phytoplankton
Even after the extensive studies carried out on algae a reliable numerical estimate of their species still remains inconclusive. Earlier research works of Norton et al., 1996 reported that there are about 37,300 species of algae all over the world, whereas Mann and Droop, 1996 estimated the number of diatom itself contributing more than 2,00,000. The sum total of species, belonging to different taxonomic classes distributed in various habitats, would naturally be higher than this number. The distributional record of microalgae registered in the present investigation is indeed useful data for the further research studies. A total 104 species of phytoplankton were identified (Table1), which represents different classes vise: Bacillariophyceae (78), Dinophyceae (22), Chlorophyceae (2), Cyanophyceae (1) and Dictyophyceae (1) Fig (3). Many plankton studies carried out earlier indicate that diatoms dominate the phytoplankton community in the coastal waters of West coast of India (Jugnu.R, 2006; SanilKumar.
M.G, 2009). Diatoms were predominant numericallyin our study and the majority were Coscinodiscus species, Asterionella species,
Biddulphia species and Pleurosigma species. Silicate is an essential
element for the growth of diatoms and dinoflagellates, which possess frustules, composed of silica. Furthermore the growth rate of diatoms was determined by the supply of silicate. The silicate showed a direct relationship with diatom biomass. Therefore the concentration of silicate varies from 15.64 mg/L at station 14 and 4.41 mg/L at station 8, corresponding diatom observed were 16564.52 cell/L and 44922.22 cell/L respectively. However, leading and abundant Dinophyceae species recorded during this investigation were Ceratium furca,
Protoperidinium species and Prorocentrum micans. They formed
21.1%, 18.7% and 13.8% of the total Dinophyceae respectively Fig (4). Dinoflagellates are reported to be more tolerant to petroleum contaminants and the dinoflagellates were dominating in stations 11 and 27. Two Chlorophyceae species recorded are Pediastrum duplex
species (station 5 and 14) and Euastrum denticulatum at station 8, in
which Pediastrum duplex was the typical fresh water species and the occurrence of the same species might be by the advection from upstream fresh water. Toxic micro algae reported from these stations are Ceratium furca, Dinophysis species, Tricodesmium species,
Chatonella species and Gonyaulax species. Moreover their
[image:2.583.369.520.338.765.2]concentrations were low and hence the threat of their were not accounted.
Table 1. List of Phytoplankton species recorded from Coastal waters of Kerala
Bacillariophyceae 1. Actinocyclus 2. Actinocyclus curvatus 3. Actinocyclus ehrenbergii 4. Actinoptychus senaris 5. Actinoptychus splendens 6. Actinoptychus spp 7. Actinoptychus trinacriformis 8. Amphipora/amphora 9. Arachnodiscus spp 10. Asterionella glacialis 11. Asteronella japonica 12. Asteronella spp 13. Biddulphia alternans 14. Biddulphia aurita 15. biddulphia granulata 16. Biddulphia graundleri 17. Biddulphia heteroceros 18. Biddulphia mobiliensis 19. Biddulphia obtusa 20. Biddulphia pulchellum 21. Biddulphia rhombus 22. Biddulphia sinensis 23. Biddulphia spp 24. Biddulphia tuomeyi 25. Chaetocerose horridum 26. Cheatoceros affinis 27. Cheatoceros danicus 28. Cheatoceros debilis 29. Cheatoceros decipiens 30. Cheatoceros spp 31. Cocconeis spp
32. Coscinodiscus concinnus 33. Coscinodiscus stellaris 34. Cosinodiscus radiatus 35. Cosinodiscus spp 36. Cyclotella spp
37. Cylindrotheca closterium 38. Diploneis lenticula 39. Diploneis spp 40. Distephanus speculum
41. Ditylum brightwelli 42. Ditylum sol 43. Eucampia spp 44. Fragellaria spp 45. Gomphonitzschia 46. Gyrosigma 47. Licmophora
48. Licmophora californica 49. Licmophora flabellata 50. Mastogloia
51. Melosira spp 52. Navicula spectabilis 53. Navicula spp 54. Nitzchia hybrida 55. Nitzschia frustulum 56. Nitzschia lorenziana 57. Nitzschia spp 58. Nitzschia vitrea 59. Paralia 60. Pleurosigma spp 61. Pleurosigma strigosum 62. Pseudo nitzschia 63. Rhizosolenia spp 64. Skeletonema costatum 65. Skeletonema spp 66. Surirella 67. Surirella elegans 68. Synedra spp
69. Thalassionema nitzschioides 70. Thalassionema spp 71. Thalassiosira
72. Thalassiosira nordenskioeldii 73. Thalassiothrix spp 74. Triceratium favus 75. Triceratium formosum 76. triceratium junctum 77. Triceratium pseudonervatum 78. Triceratium spp
Dinophyceae
79. Ceratium furca 80. Ceratium fuses 81. Ceratium fusus 82. Ceratium pentagonium 83. Ceratium spp 84. Ceratulina pelagica 85. Chatonella spp 86. Dinophysis 87. Dinophysis caudata 88. Diplopsalis spp 89. Gonyaulux spp 90. Guinardia spp 91. prorocentrum micans 92. Prorocentrum minimum 93. prorocentrum spp 94. P-Oceanicum 95. protoperidinium spp 96. Scripsella spp 97. Heterocapsia 98. Diplopsalis lenticula 99. Peridinium spp 100. Trichodesmium spp
Dictychophyceae
101. Dictyocha fibula
Chlorophyceae
102. Euastrum denticulatum 103. Pediastrum duplex
Cyanophyceae
104. Lyngbya
[image:3.583.312.556.191.540.2]Phytoplankton community showed a spatial variation in its qualitative as well as quantitative aspects during the study. Its composition in many of sites showed high standing crop values, whereas poor concentration in the remaining stations. Phytoplankton density showed a major peak at station 25 with a density of 8984.84 cell/L and minor peaks at station 17 with a density of 54.29 cell/L. Phytoplankton biomass, distribution and species composition vary continuously from station to station with pH, salinity and nutrient dynamics. Along the Indian coast, occurrences of algal blooms are more prevalent along the west than on the east coast. Bloom of the diatoms has been reported by Ramamurthy et al., 1972; Devassy and Bhattathiri, 1974.
0 5 10 15 20 25 30 0.0
0.1 0.2 0.3 0.4 0.5 0.6 0.7 0.8
P
h
o
sp
h
a
te
(m
g
/L
)
Stations
0 5 10 15 20 25 30
0.02 0.04 0.06 0.08 0.10 0.12 0.14
N
itr
a
te
(m
g
/L
)
Stations
0 5 10 15 20 25 30
0.00 0.01 0.02 0.03 0.04 0.05 0.06 0.07 0.08 0.09
N
itr
ite
(m
g
/L
)
Stations
0 5 10 15 20 25 30 0
20 40 60 80 100 120 140 160
A
m
m
o
n
ia
(m
g
/L
)
Stations
0 5 10 15 20 25 30 5
10 15 20 25 30 35
S
a
lin
ity
(p
su
)
Stations
0 5 10 15 20 25 30 0.00
0.05 0.10 0.15 0.20 0.25 0.30 0.35 0.40 0.45
D
O
(m
g
/L
)
0 5 10 15 20 25 30 5.0
5.5 6.0 6.5 7.0 7.5 8.0
p
H
[image:5.583.312.556.51.210.2]Stations
Fig. 2. Graphs showing the distributional pattern of physico-chemical Parameters
Fig. 3. Distributional classification of percentage abundance of different algal groups in the study location
6.02% 6.02% 10.5% 18.7%
5.01%
12.8%
21.1%
13.8%
6.02%
[image:5.583.50.282.63.267.2]Diplopsalis Prorocentrum Ceratium Dinophysis Heterocapsia Protoperidinium Gonyaulax Scripsella spp Guinardia
[image:5.583.53.287.327.512.2]Fig 4. Distribution of Dinophyceae around coastal waters of Kerala
Fig. 5. Blooming of Asterionella species observed at Station 25
In the present study, at station 25, the pinnate diatom Asterionella
species reached high densities of 5,00000 cell/L Fig(5). The up
welled water has great influence on abundance of this species along with high salinity and low anthropogenic inputs. The bloom followed a high salinity (21.53psu) and high silicate (14.02 mg/L) value. Nitrite (0.06 mg/L) showed a very slight increase whereas ammonia, nitrate and phosphate showed a complete depletion (38.19mg/L, 0.08 mg/L and0.03mg/L) than other stations. It is usually acknowledged that occurrences of such phenomena are increasing throughout the world oceans. The reasons for this obvious increase remain debated and include not only eutrophication but also increased observation efforts in coastal zones of the world.
Conclusions
The hydrographical parameters are imperative aspects related to a water body for distinguishing its distinction. Coastal area serve as the most dynamic body, since intrusion from the fresh water varies in all stations and keeps on oscillating and leading to a multifaceted environment throughout the time. The present study provides baseline information on community structure of phytoplankton and its effects on physicochemical parameters along the Kerala coast. Several factors were coupled together such as high salinity, high pH, high nutrients and high phytoplankton abundance. The reduced nutrient concentration followed by blooming provides an–relation between phytoplankton abundance and physic chemical parameters. The effect of variations in these factors are specific to space and pave way to scientific ideas for the future work with regard to sampling which could be indicated and useful for any future ecological assessment of the marine environment especially to Kerala coast.
Acknowledgements
The authors wish to acknowledge Ministry of Earth Sciences (MoES) under SIBER-GEOTRACES programme, Government of India, for the financial support to carry out the research work. We thank Head, Department of Chemical Oceanography, CUSAT for providing laboratory facilities and suggestions.
REFERENCE
Balasubramanian, R. and Kannan, L. 2005. Physico-chemical characteristics of the coral reef environs of the Gulf of Mannar biosphere reserve.India. Int.J.Ecol.Environ.Sci, 31: 265-271. Bijumon, K.B., Robin, R.S., Sunil Kumar, S. and Ouseph, P.P. 2000.
Effect of a factory effluent on the biological productivity of coastal marine system at Veli, Thiruvananthapuram. Procedings
of the 12’th KSC, 592-594.
Devassy, V.P. and Bhattathiri, P.M.A. 1974. Phytoplankton ecology of the Cochin backwater. Indian J Mar Sci, 3:46–50.
EEA (European Environment Agency). 1999. Nutrients in European ecosystems. Environment Assessment Report No.4. EEA,
Copenhagen.
4.13%2.32% 1.7% 8.09% 83.8%
[image:5.583.48.285.562.738.2]Jugnu, R. 2006. Studies on the prevalence of algal blooms along Kerala coast, India. Phd thesis Cochin University of Science and
Technology.
Liu Dongyan., Sun Jun. and Liu Zhe., 2004. The effects of spring-neap tide on the Phytoplankton community development in the Jiaozhou bay, China. J.Acta oceanica sinica, 23:687-697.
Mann, D.G. and Droop, S.J.M. 1996. Biodiversity, biogeography and conservation of diatoms. J.Hydrobiol, 336:19-32.
McLusky, D.S., 1971. Ecology of Estuaries. Heinmann Educational Books, London.
Neill, M., 2005. A method to determine which nutrient is limiting for plant growth in estuarine waters at any salinity. J.Mar.Poll.Bull, 50:945-955.
Norton, T.A., Malkonian, M. and Anderson, R.A. 1996. Algal biodiversity. J.Phycologia. 35:308-326.
Nowrouzi, S. and Valavi, H., 2011. Effects of environmental factors on phytoplankton abundance and diversity in Kaftar Lake. J. Fish.
Aquat. Sci, 6:130-140.
Rajkumar, M., Perumal, P., Prabu, V.A., Perumal, N.V. and Rajasekar, K.T. 2009. Phytoplankton diversity in Pichavaram mangrove waters from south-east coast of India. J.Environ.Biol, 30:489-498.
Ramamurthy, VD., Selvakumar, RA. and Bhargava, R.M.S. 1972. Studies on the blooms of Trichodesmium erythraeum in the waters of the central west coast of India. Curr Sci, 41:803–809. Ramaraju, V.S., Sarma, V.V. and Rao, V.S. 1992. Water masses of
Visakhapatnam, shelf, physical processes in Indian Seas.
Proceedings of first convention ISPSO, 75-78.
Reynolds, C.S. 1993. Scales of disturbance and their role in plankton ecology. J. Hydrobiol, 249,157-171.
Robin, R.S., Sunil Kumar, S., Ajithkumar, A. and Sajith Kumar, A. 2002. Macrobenthos in relation with physico-chemical characteristics along the southern sector of Kerala coast. Procedings. of the fourteenth Kerala Science Cong, 439-441. Sanilkumar, M.G. 2009. Micro algae in the south west coast of India.
PhD thesis Cochin University of Science and Technology.
Sridhar, R., Thangaradjou, T., Kumar, S.S. and Kannan, L. 2006. Water quality and phytoplankton characteristics in the Palk Bay, south east coast of India. J.Environ.Biol, 27:561-566.
Strickland, J.D.H. and Parsons, T.R. 1972. A practical handbook of seawater analysis.
Utermohl, H. 1958. Zur Vervollkommung der quantitativen Phytoplankton- Methodik. Mitt. - Intern. Verein. Theor. Angew.
Limnol, 9:1–38.