J-PLUS: Discovery and characterisation of ultracool dwarfs
using Virtual Observatory tools
E. Solano
1,2, E. L. Martín
3, J. A. Caballero
1, C. Rodrigo
1,2, R. E. Angulo
4,5,6, J. Alcaniz
7, A. J. Cenarro
8,
D. Cristóbal-Hornillos
8, R. A. Dupke
7,9,10,11, A. Ederoclite
8,12, F. Jiménez-Esteban
1,2, J. A. Hernandez-Jimenez
12,13,
C. Hernández-Monteagudo
8, R. Lopes de Oliveira
14,15,7, C. López-Sanjuan
8, A. Marín-Franch
8,
C. Mendes de Oliveira
12, M. Moles
4, A. Orsi
4, D. Sobral
16, L. Sodré Jr.
12, J. Varela
8, and H. Vázquez Ramió
41 Departamento de Astrofísica, Centro de Astrobiología (CSIC-INTA), ESAC Campus, Camino Bajo del Castillo s/n, E-28692, Villanueva de la Cañada, Madrid, Spain
2 Spanish Virtual Observatory, Spain
3 Departmento de Astrofísica, Centro de Astrobiología (CSIC-INTA), Carretera de Torrejón a Ajalvir km 4, E-28850 Torrejón de Ardoz, Madrid, Spain
4 Centro de Estudios de Física del Cosmos de Aragón (CEFCA), Plaza San Juan 1, 44001 Teruel, Spain
5 Donostia International Physics Centre (DIPC), Paseo Manuel de Lardizabal 4, E-20018 Donostia-San Sebastián, Spain 6 IKERBASQUE, Basque Foundation for Science, E-48013, Bilbao, Spain
7 Observatorio Nacional - MCTIC (ON), Rua General José Cristino, 77, São Cristóvão, 20921-400, Rio de Janeiro, Brazil 8 Centro de Estudios de Física del Cosmos de Aragón (CEFCA) – Unidad Asociada al CSIC, Plaza San Juan 1, 44001 Teruel, Spain 9 University of Michigan, Department of Astronomy, 1085 South University Ave., Ann Arbor, MI 48109, USA
10 University of Alabama, Department of Physics and Astronomy, Gallalee Hall, Tuscaloosa, AL 35401, USA 11 Instituto de Astrofísica de Andalucía, Glorieta de la Astronomía s/n, 18008 Granada, Spain
12 Instituto de Astronomia, Geofísica e Ciências Atmosféricas, Universidade de São Paulo, Rua do Matão 1226, C. Universitária, São Paulo, 05508-090, Brazil
13 Departamento de Ciencias Físicas, Universidad Andrés Bello, Fernández Concha 700, Las Condes, Santiago, Chile
14 Departamento de Física, Universidade Federal de Sergipe, Av. Marechal Rondon, s/n. São Cristóvão, 49100-000 Sergipe (SE), Brazil
15 Center for Space Science and Technology, University of Maryland, Baltimore County, 1000 Hilltop Circle, Baltimore, MD 21250, USA
16 Department of Physics, Lancaster University, Lancaster LA1 4YB, United Kingdom
Received 12 02 2019/Accepted 07 05 2019
ABSTRACT
Context.Ultracool dwarfs are objects with spectral types equal or later than M7. Most of them have been discovered using wide-field imaging surveys. The Virtual Observatory has proven to be of great utility to efficiently exploit these astronomical resources Aims.We aim to validate a Virtual Observatory methodology designed to discover and characterize ultracool dwarfs in the J-PLUS photometric survey. J-PLUS is a multiband survey carried out with the wide angle T80Cam optical camera mounted on the 0.83-m telescope JAST/T80 in the Observatorio Astrofísico de Javalambre. In this work we make use of the Internal Data Release covering 528 deg2.
Methods.We complement J-PLUS photometry with other catalogues in the optical and infrared using VOSA, a Virtual Observatory tool that estimates physical parameters from the spectral energy distribution fitting to collections of theoretical models. Objects identified as ultracool dwarfs are distinguished from background M giants and highly reddened stars using parallaxes and proper motions fromGaiaDR2.
Results.We identify 559 ultracool dwarfs, ranging fromi=16.2 mag toi=22.4 mag, of which 187 are candidate ultracool dwarfs not previously reported in the literature. This represents an increase in the number of known ultracool dwarfs of about 50% in the studied region of the sky, particularly at the faint end of our sensitivity, which is interesting as reference for future wide and deep surveys such as Euclid. Three candidates constitute interesting targets for exoplanet surveys because of their proximity (distances less than 40 pc). We also analyze the kinematics of ultracool dwarfs in our catalogue and find evidence that it is consistent with a Galactic thin-disk population, except for six objects that might be members of the thick disk.
Conclusions.The results obtained in this paper validate the proposed methodology, which will be used in future J-PLUS and J-PAS releases. Considering the region of the sky covered by the Internal Data Release used in this work, we foresee to discover 3 000-3 500 new ultracool dwarfs at the end of the J-PLUS project.
Key words. astronomical data bases: surveys – astronomical data bases: virtual observatory tools – stars: low-mass – brown dwarfs.
1. Introduction
Ultracool dwarfs (UCDs) are defined as objects with spectral types equal or later than M7 V. They comprise both the
low-est mass hydrogen-fusing stars and brown dwarfs (substellar ob-jects not massive enough to sustain steady hydrogen fusion). The M7 V spectral type marks the beginning of a variety of changes
with decreasing effective temperature, in particular the appear-ance of dust clouds, which makes an increasingly important con-tribution to the atmospheric chemistry (e.g., Jones & Tsuji 1997; Helling et al. 2008). UCDs represent about 15% of the stellar population in the solar neighborhood (e.g., Henry et al. 2006; Gillon et al. 2016)
While the ages of UCDs favor studies of Galactic kinematics, they also play a relevant role in two other types of research lines. On one hand, their low masses and small radii facilitate the dis-covery of Earth-size planets orbiting around them at separations at which surface water could be liquid. Moreover, their prox-imity to the Sun (UCDs are intrinsically faint objects that cannot be detected at long distances) opens the door to the detection and characterization of habitable planets in the solar neighbourhood. Proxima Centauri (Anglada-Escudé et al. 2016), TRAPPIST -1 (Gillon et al. 2017), and Barnard’s star (Ribas et al. 2018) are excellent examples of this type of research. Given that there are approximately three times as many M dwarfs as FGK dwarfs in the Milky Way (Kroupa 2001; Chabrier 2003), and small plan-ets appear to surround M dwarfs three to five times more fre-quently than Sun-like stars (Dressing & Charbonneau 2015), they could well represent the most common Earth-size planets in our Galaxy.
On the other hand, some of the youngest (t≤100 Myr) UCDs in the field may have masses close to or even below the deu-terium burning limit (10 - 13 MJup; Chabrier & Baraffe 2000; Zhang et al. 2019), which makes them exoplanet analogues. Since these objects are nearby, isolated, and not affected by the glare of the host star, they are ideal laboratories for detailed stud-ies of the cool, low-gravity and dusty atmospheres typical of ex-oplanets (Faherty et al. 2013; Caballero 2018).
The major sources of UCD discoveries, which now include over 2 000 L and T dwarfs and several thousands of late-M dwarfs (Smart et al. 2017), have been wide-field, optical and infrared imaging surveys such as the Deep Near Infrared Sur-vey of the Southern Sky (Epchtein et al. 1999), the Sloan Digital Sky Survey (York et al. 2000), the Two Micron All Sky Survey (Skrutskie et al. 2006), the UKIRT Infrared Deep Sky Survey (Lawrence et al. 2007), the Wide-Field Infrared Survey Explorer (Wright et al. 2010), and the Visible and Infrared Survey Tele-scope for Astronomy (Cross et al. 2012). In the near future, a major source of UCD identifications is expected to be the Euclid surveys (Deacon 2018).
In this context, we plan to search for UCDs in J-PLUS1 (Javalambre Photometric Local Universe Survey) and J-PAS2 (Javalambre Physics of the Accelerating Universe Astrophysical Survey) taking advantage of the Virtual Observatory3(VO) capa-bilities. VO has proven to be an excellent methodology to iden-tify and characterize cool objects (e.g., Aberasturi et al. 2011; Martín et al. 2013; Aberasturi et al. 2014; Gálvez-Ortiz et al. 2017; Lodieu et al. 2017). In this paper we present the first search using the J-PLUS Internal Data Release catalogue which covered 528 deg2(∼1% of the total sky area) in the blue and red optical bands.
The main advantage of J-PLUS compared to the previously cited surveys is its larger number of filters, which provide a denser sampling of the spectral energy distribution (SED) and allows a more accurate estimation of the effective temperature, a key parameter to classify an object as a UCD. The fact that all photometric information comes from the same survey also
min-1 https://www.j-plus.es/
2 http://www.j-pas.org/
3 http://www.ivoa.net
imizes the risk of mismatching among surveys conducted at dif-ferent epochs, in particular for the most interesting, high proper motion, nearby sources.
This paper is organized as follows. In Sect. 2 we describe the J-PLUS survey. Sect. 3 is devoted to explain the methodol-ogy that we have used to identify candidate ultracool dwarfs. In Sect. 4, we present some properties of our candidates. Finally, we summarize our work and present our conclusions in Sect. 5.
2. J-PLUS
J-PLUS is an ongoing multi-filter survey carried out with the Javalambre Auxiliary Survey Telescope (JAST/T80), a 0.83 m telescope installed at the Observatorio Astrofísico de Javalambre (OAJ) in Teruel, Spain. The survey uses the panoramic camera T80Cam that provides a large field of view of 1.4×1.4 deg2 with a pixel scale of 0.55 arcsec/pixel. J-PLUS was primarily conceived to perform the calibration tasks for the main J-PAS survey, observing the same regions of the sky (≈8 500 deg2). J-PAS (Benítez et al. 2014), is a photometric sky survey in 59 colours that will allow, for the first time, to map not only the positions of hundreds of millions of galaxies in the sky but also their individual distances, providing the first complete 3D map of the Universe.
The J-PLUS filter system is composed of four broad- (g,r,i, andz), two intermediate- (u andJ0861), and six narrow-band (J0378, J0395, J0410, J0430, J0515, and J0660) filters op-timized to provide an adequate sampling of the target SED in the optical range. The transmission curves, as well as additional properties of the set of filters, can be found at the Filter Profile Service maintained by the Spanish Virtual Observatory4. The ex-pected limiting magnitude (3σ in 3 arcsec aperture) is∼21 mag, withgandrreaching∼22 mag. J-PLUS magnitudes are given in the AB system.
The final survey parameters, scientific goals and the techni-cal requirements of the filter set are described in Cenarro et al. (2019). J-PLUS data have already been used in different research fields, such as the study of the Coma cluster (Jiménez-Teja et al. 2019), the analysis of the Hαemission in the nearby Universe (Logroño-García et al. 2019), the study of the M15 globular clus-ter (Bonatto et al. 2019), the identification of new members in a galaxy cluster (Molino et al. 2019), the study of the stellar pop-ulations of several local galaxies (San Roman et al. 2019), or the study of the star/galaxy morphological classification (López-Sanjuan et al. 2019).
3. Analysis
We queried the J-PLUS archive5, in particular the Internal Data Release (IDR201709), using the VO Asynchronous Queries op-tion. IDR201709 comprises 264 J-PLUS pointings observed in the 12 optical bands described in Sect. 2 amounting to 528 deg2 (Fig. 1). These pointings, available for the J-PLUS collaboration in September 2017, are a subset of the 511 pointings that com-prise the first J-PLUS data release, DR16, presented by Cenarro et al. (2019). Differences at 0.1 mag level in the photometry of the same source between IDR201709 and DR1 can exist due to improvements in the reduction and the calibration processes made after September 2017. IDR201709 includes two types of catalogues: single catalogues, where the source detection and
4 https://bit.ly/2OXuwNs
5 https://archive.cefca.es/catalogues
6 https://www.j-plus.es/datareleases/data
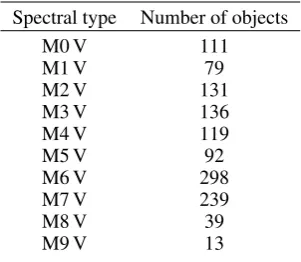
Table 1.Number of M dwarfs in West et al. (2011) withi,zphotometry in J-PLUS.
Spectral type Number of objects
M0 V 111
M1 V 79
M2 V 131
M3 V 136
M4 V 119
M5 V 92
M6 V 298
M7 V 239
M8 V 39
M9 V 13
photometry were done on each band independently, and dual catalogues, where the detection and photometry were done using ther-band image as a reference. As UCDs emit most of their flux at longer wavelengths, we decided not to be linked to therband and use the single catalogues in our analysis, instead. For this, we crossmatched the sources extracted from the images at dif-ferent bands assuming that sources separated less than 1 arcsec are, actually, the same source.
3.1. Photometric search
We restricted our query to stellar sources. This was done using
the class_star parameter of SExtractor (Bertin & Arnouts
1996). Sources havingclass_star>0.5 in ther-band image are considered “stars” in the J-PLUS archive. In order to min-imize the contamination by non-stellar sources we were more restrictive and imposed class_star >0.8. We also required good photometric conditions (flag=0). An example of a typical query looks like this:
SELECT * FROM jplus.CalibratedMagABSingleObj,jplus.Filter
WHERE jplus.Filter.FILTER_ID = jplus.CalibratedMagABSingleObj.FILTER_ID AND ALPHA_J2000 BETWEEN 145.0 AND 146.0
AND DELTA_J2000 BETWEEN 30.0 AND 33.0 AND CalibratedMagABSingleObj.FLAGS=0 A AND CalibratedMagABSingleObj.CLASS_STAR>0.8
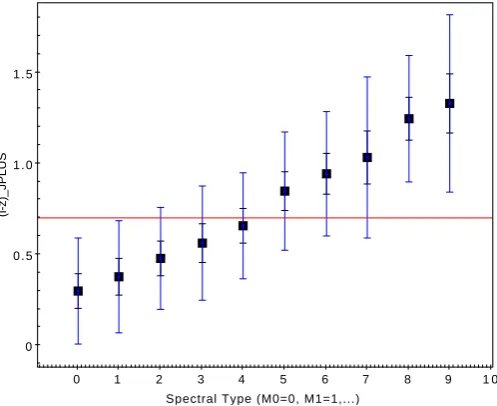
Figure 2 shows the distribution of thei−zJ-PLUS colours for the list of spectroscopically confirmed M dwarfs given by West et al. (2011) and included in IDR201709. A list of 1257 stars was obtained from this crossmatch (Table 1). For this subset,i−z colour ranges from a mean value ofi−z∼0.3 mag at subtype M0 V toi−z∼1.3 mag at subtype M9 V. We adopted a colour-cut ofi−z>0.7 mag as a criterion to identify new UCDs. It includes almost all stars of subtype M7 V and later, at the expense of some contamination from earlier subtypes (M2–6 V). To minimize this contamination as much as possible, we used VOSA7 (VO Sed Analyser; Bayo et al. 2008) to derive the effective temperature of the photometrically selected candidate UCDs (i.e. objects with i−z>0.7 mag). VOSA is a tool developed by the Spanish Virtual Observatory designed to estimate physical parameters from the comparison of the observed target SED to different collections of theoretical models (see an illustrative example in Fig. 3).
Observational SEDs covering the optical and infrared range were built using the photometric catalogues available in VOSA. Then, SEDs were compared to the grid of BT-Settl CIFITS
[image:3.595.89.240.85.216.2]7 http://svo2.cab.inta-csic.es/theory/vosa/
Table 2. Mean effective temperatures calculated using VOSA and
BTSettl-CIFITS models as a function of the spectral type given by West et al. (2011).
Spectral Number of Teff
type objects [K]
M5 V 3 901 3 210±210
M6 V 5 645 3 060±110
M7 V 5 824 2 960±150
M8 V 1 682 2 710±160
M9 V 891 2 600±160
model atmospheres (Baraffe et al. 2015) to estimate eff ec-tive temperatures. We assumed logg≥4.5 and solar metallic-ity.GALEXphotometry was not included in the SED as, for M dwarfs, most of the flux in theGALEXbandpasses does not have a photospheric origin but chromospheric (Shkolnik et al. 2011). Consequently, the flux observed atGALEX bands is systemati-cally higher than the flux estimated from the photospheric mod-els, which would have a clear impact on the SED fitting.
Extinction can play an important role in shaping the SED and thus, in the estimation of physical parameters. To account for this effect, we decided to leave extinction as a free parameter in the SED fitting process with values ranging fromAV=0.0 mag to 0.7 mag.
Using the 70 840 spectroscopically confirmed M dwarfs available in West et al. (2011), we derived a relationship be-tween spectral types and effective temperatures calculated using VOSA and Baraffe et al. (2015) models (Table 2). According to this, we adopted for UCDs a conservative value ofTeff≤2900 K. With this criterion we may loose a small fraction of hotter UCDs but, at the same time, we avoid contamination from a significant number of M5–6 dwarfs.
SEDs of the photometrically selected ultracool candidates withTeff≤2900 K were visually inspected to remove bad pho-tometric points (i.e. points that clearly deviate from the theoret-ical SED) that could be affecting the quality of the SED fitting and, thus, the estimation of the effective temperature. Moreover, we used Aladin (Bonnarel et al. 2000) to inspect the associated images and discard any problem related to blending or contami-nation by nearby sources.
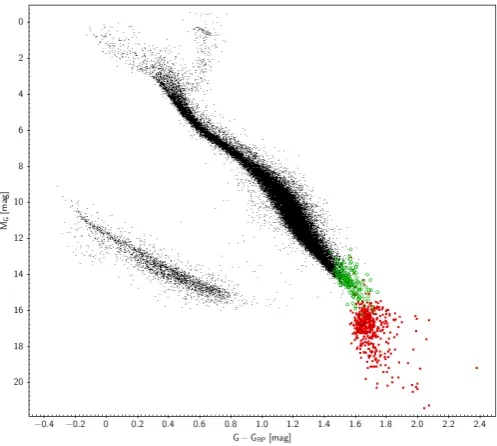
The next step was to place our photometrically selected can-didate UCDs in a colour-magnitude diagram. To do so, we re-produced the diagram shown in Fig. 6 of Babusiaux et al. (2018) with all theGaiaDR2 objects at less than 100 pc. Among our candidates, we kept only those with relative errors of less than 10% inGand GRPand less than 20% in parallax. The absolute Gaiamagnitude in theGband for individual stars was estimated using
MG=G+5 log$+5, (1)
where$ is the parallax in arcseconds. In our case, the inverse of the parallax is a reliable distance estimator as we are keeping only sources with relative errors in parallax lower than 20% (Luri et al. 2018).
We also forced that all Gaia counterparts have a value of
visibility−periods−used>6, which is the minimum value
Fig. 1.Sky coverage of J-PLUS IDR201709 in Galactic coordinates (red). The SDSS DR9 footprint (blue) is plotted for comparison.
0 1 2 3 4 5 6 7 8 9 1 0
Spectral Type (M0=0, M1=1,...) 0
0 . 5 1 . 0 1 . 5
[image:4.595.41.290.321.524.2](i-z)_JPLUS
Fig. 2.Mean colouri−zas a function of spectral type for the M dwarfs included in West et al. (2011) and with observations in J-PLUS. The red line represents thei−z=0.7 mag colour cut. Bars at 1σand 3σare also shown.
not previously reported in the literature. Figure 4 shows the posi-tion of these sources in the CMD diagram. It confirms the dwarf and cool nature of all our candidates.
3.2. Kinematic search
Proper motions have been widely used in the literature to dis-tinguish M dwarfs from other objects with similar colours but different kinematics, such as M giants, quasars, or distant red lu-minous galaxies (e.g., Theissen et al. 2017, 2016; Caballero et al. 2008). Moreover, proper motions are very useful to identify ul-tracool dwarfs with atypical colours due to anomalous values of gravity (Schmidt et al. 2010a) or metallicity (Bochanski et al. 2013; Zhang et al. 2018) that would be missed by colour cuts used in photometry-only searches.
Fig. 3.Example of a SED fitting as generated by VOSA. The blue spec-trum represents the theoretical model that best fits while red dots rep-resent the observed photometry. The inverted yellow triangle indicates that the photometric value corresponds to an upper limit. The vertical dashed line flags a possible excess in the SED.
The J-PLUS limiting magnitudes in the i- and z-band, to-gether with the UCD colour-distance relationship provided in Theissen et al. (2017), gives a maximum distance of about 400 pc to find UCDs in the J-PLUS survey. This implies that UCDs seen by J-PLUS are at distances where proper motions are significant. To define the proper motion cut between M dwarfs and M subgiants/giants, we took all objects classified in SIMBAD8 (Wenger et al. 2000) as M subgiant/giant (luminosity classes IV, IV/III, and III) and with spectral type later than M5 (1 093 ob-jects), and looked for their proper motions inGaiaDR2. Their normalized total proper motion distribution is compared in Fig. 5 with that of the 127 candidate UCDs identified in Sect. 3.1. A proper motion cut at 30 mas/yr represents a good balance be-tween giant contamination and dwarf completeness.
[image:4.595.309.544.325.501.2]Fig. 4.Location of our photometrically selected candidate UCDs (open green circles) in a colour-magnitude diagram built using Gaia DR2 sources with parallaxes larger than 10 milliarcseconds (black dots). L and T dwarfs identified in Smart et al. (2017) and with counterparts in
GaiaDR2 are overplotted in red.
In the kinematic search we limited our query in J-PLUS to
class_star ≥ 0.5. Compared to the photometric search we
have relaxed this condition from 0.8 to 0.5 based on two rea-sons. First, it increases the number of objects to be studied. Sec-ond, the contamination of non-stellar objects wrongly flagged
withclass_star>0.5 can be easily removed using the proper
motion information as extragalactic objects have negligible spa-tial motions. Sources fulfilling this condition were crossmatched with theGaiaDR2 catalogue to get the information on proper motions. A search radius of 10 arcsec was used. If more than one counterpart exist in that radius we took the nearest one. Of the 2 620 881 J-PLUS sources withGaiaDR2 counterparts, 64 134 have total proper motions larger than 30 mas/yr.
To remove hotter objects (spectral types earlier than M7) with high proper motions, we estimated effective tempera-tures for the 64 134 objects using VOSA following a proce-dure similar to that described in Sect. 3.1. Also, objects with Gaiacounterparts havingvisibility−periods−used<6 and
astrometric−excess−noise>1 were removed. The latter is
[image:5.595.301.557.57.223.2]aGaiaparameter that quantifies the scatter of residuals in the astrometric solution. According to Lindegren et al. (2018), val-ues above 1 will, most likely, correspond to artefacts. After this filtering, 60 new UCDs candidate were kept. These objects were not identified in the photometric search mainly because of two reasons: J-PLUSclass−star≤0.8 or bad photometry in the J-PLUS i-, z-bands.The distribution of effective temperatures of our candidate UCDs (identified both using photometry and proper motions) are given in Fig. 6.
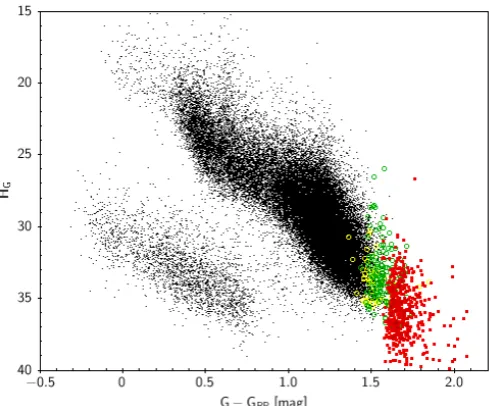
Figure 7 shows the position of the 60 kinematically-selected candidate UCDs in a reduced proper motion diagram:
HG=G+5 logµ+5 (2)
whereG is theGaiamagnitude and µ is the total proper mo-tion in mas yr−1. In this type of diagrams, proper motion is used as a proxy for distance assuming that nearby objects will have larger proper motions. Just as in a Hertzsprung-Russell diagram,
0 2 0 4 0 6 0 8 0 1 0 0 1 2 0 1 4 0 1 6 0 Total proper motion
0 0 . 2 0 . 4 0 . 6 0 . 8 1 . 0
Normalized distribution
Fig. 5.Normalized distribution functions of theGaiaDR2 proper mo-tions of the subgiants/giants available in SIMBAD with spectral type later than M5 (blue) and the 127 candidate UCDs identified in Sect. 3.1 (green). The cut at 30 mas/yr is marked with a vertical red line.
Fig. 6.Teffdistribution of the candidate UCDs identified using photom-etry (grey) and proper motions (red). Most of our candidate UCDs (∼
65 %) haveTeff>2800 K.
reduced proper motion diagrams have demonstrated to be ex-cellent tools to segregate the various stellar populations (Dhital et al. 2010; Jiménez-Esteban et al. 2011, 2012; Zhang et al. 2013; Smart et al. 2017). All our candidates lie in the expected locus for ultracool dwarfs.
[image:5.595.305.556.283.487.2]Fig. 7.Reduced proper motion - colour diagram. In black we plot the objects used in Fig. 4. Green open circles represent the 127 candidate UCDs identified in Sect. 3.1. Yellow open circles indicate the 60 kine-matically selected candidate UCDs. L and T dwarfs from Smart et al. (2017) used in Fig. 4 are plotted as red squares.
combined, could be an alternative approach to separate dwarfs from giants. However, the number of GaiaDR2 parallaxes ac-curate enough to provide unbiased estimations of distances is significantly lower than the number of accurate proper motions (i.e., relative errors below 10% in both components). Using tan-gential velocities would result in the loss of 20-25% of our kine-matically selected candidates which led us not to use them in our kinematic search of UCDs.
A sample of the photometrically (127) and kinematically (60) selected candidate UCDs is given in Table 3, while the full list of candidates is available online at the SVO-JPLUS archive of ultracool dwarfs (see Appendix A). This service will be up-dated and maintained in the framework of the Spanish Virtual Observatory9. According to VOSA criteria, based on the slope of the SED and the flux difference between the observed and theo-retical SEDs (see the VOSA help10 for a detailed description on how VOSA handles the infrared excess), none of the candidate UCDs show excess in the infrared that could be ascribed to cir-cumstellar material or to the presence of a close ultracool com-panion. This result is in agreement with the ratio of M dwarfs with infrared excess given by Theissen & West (2014), estimated in one object every about 400 stars.
3.3. Known ultracool dwarfs
In this section we assess the fraction of known UCDs that have been recovered using our methodology. In particular we looked for UCDs in two catalogues: SIMBAD and Smart et al. (2017).
Using the SIMBAD TAP service11, we chose among the more than 9 million available objects those having M7V, M8V, M9V, and L spectral types. A total of 9 894 objects fulfilled these conditions.
To know how many of them lie in the region of the sky covered by IDR201709, we took advantage of the Multi-Object
9 http://svo.cab.inta-csic.es
10 https://bit.ly/2yzwyIF
11 http://simbad.u-strasbg.fr:80/simbad/sim-tap
Coverage12 VO standard and Aladin. A total of 588 objects lie in the region of the sky observed in IDR201709. A query to the archive for these 588 objects returned 368 objects with J-PLUS data. We repeated the same methodology for Smart et al. (2017). Only 53 out of the 1885 objects included in the catalogue lie in the J-PLUS field, 7 of them with observations in the J-PLUS archive. The scarcity of J-PLUS counterparts can be explained by the intrinsic faintness of these objects, typically beyond the IDR201709 limiting magnitude.
The efficiency of our search was estimated using the false negative rate (number of known UCDs that were not rediscov-ered in our search). All SIMBAD sources (368) were found while only four of the seven objects included in Smart et al. (2017) with J-PLUS observations were recovered, the remain-ing three havremain-ing a bad SED fittremain-ing that prevented us from de-riving their effective temperatures. These 372 (368+4) objects were not included in our list of 187 (127+60) objects as they have already been reported in the literature. This gives a total of 559 UCDs identified in this paper. The 187 new candidate UCDs compared to the 9 894 UCDs already included in SIM-BAD represents a 2% of new discoveries. However, if we re-strict our analysis to the area of the sky covered by J-PLUS DR1 (528 deg2), the increase in the number of known UCDs is about 50% (187/372). This ratio of new discoveries is not evenly dis-tributed with spectral types, being higher (∼5%) for the cooler (>M8) objects. Extrapolating these results to the foreseen sky coverage at the end of the J-PLUS survey (8 500 deg2) we would expect to discover∼3 000–3 500 new UCDs, which represents one third of the UCDs presently included in SIMBAD.
These results confirm the robustness of our methodology to discover ultracool dwarfs.
4. Results and discussion
4.1. Distances
To avoid biases due to large errors in parallax (Astraatmadja & Bailer-Jones 2016), distances were estimated only if the relative error in parallax was less than 20%. As in Sect. 3.1, we used the inverse of the parallaxes given inGaiaDR2. The distribution of distances for our candidate UCDs is shown in Fig. 8.
Due to the comprehensive search done in the past for nearby UCDs, the great majority of the new candidate UCDs presented in this paper are at distances greater than 40 pc, which is interest-ing as reference for future wide and deep surveys such as Euclid (Racca et al. 2018). However, there are three objects at less than 40 pc that escaped from previous searches, which indicates that there is still room to discover new nearby UCDs even with small telescopes such as JAST/T80. We list the details of these three objects in Table 4. Based on the effective temperatures calculated with VOSA and theTeff– spectral type relationship given in (Ta-ble 2), we estimated a photometric spectral types of M7 forTeff ∼2900 K and M8 forTeff ∼2700 K.
Ultracool dwarfs may escape from photometric surveys be-cause their unusualJ−Kscolours for their spectral types. Red J−Ksoutliers often exhibit distinctive low-gravity features, in-dicating that these objects are young and still collapsing. On the other hand, blue outliers show strong H2O and weak CO fea-tures in their infrared spectra, possibly associated to high gravity and old age (Burgasser et al. 2008; Schmidt et al. 2010b; Zhang et al. 2017). A paradigmatic example of these outliers is SDSS J141624.09+134826.7, an exceptionally blue L dwarf within 10
Table 3.New candidate ultracool dwarfs.
α δ Teff G $ µαcosδ µδ Search i z
(ICRS, deg) (ICRS, deg) [K] [mag] [mas] [mas/yr] [mas/yr] [mag] [mag]
21.70712 33.44938 2600 20.94 11.18 7.36 -51.33 P 20.19 18.69
22.16372 33.30222 2600 18.44 18.93 77.34 -99.44 P 17.81 16.33
23.15882 39.59608 2800 20.58 3.41 -54.42 -21.40 K
27.63937 33.73132 2900 19.84 3.79 2.44 -39.94 P 19.34 18.11
28.13097 33.83401 2600 19.69 11.93 58.33 -46.75 P 19.11 17.67
...
Notes.Equatorial coordinates,Gmagnitudes, parallaxes and proper motions are fromGaiaDR2, effective temperatures are estimated with VOSA andi,zmagnitudes are from J-PLUS. The column “Search” indicates whether the source was discovered in the photometric (P) or in the kinematic (K) search. The full table is available at the SVO-JPLUS archive of ultracool dwarfs (see Appendix A).
5 0 1 0 0 1 5 0 2 0 0 2 5 0 3 0 0 3 5 0
Distance (pc) 0
5 1 0 1 5 2 0
[image:7.595.299.554.230.433.2]Number of objects
Fig. 8.Distance distribution for our candidate UCDs with goodGaia
DR2 parallaxes (δ$/$ < 20%). The red vertical line indicates d= 40 pc. The mean value of the distribution is 130 pc, with the closest and farthest objects at 32 pc and 352 pc.
pc of the Sun (Bowler et al. 2010; Schmidt et al. 2010a). Nev-ertheless, as shown in Fig. 9, this was not the case of our three candidate UCDs, which lie in the region of typical colours.
4.2. Tangential velocities
Kinematics is a good proxy to get information on the ages of UCDs as old stars belong to the thick disk and, thus, have larger velocities than young stars, which belong to the thin disk (Montes et al. 2001; Zuckerman & Song 2004).
The lack of radial velocities for our ultracool candidates pre-vents from making a three dimensional kinematic analysis. In-stead, by combining GaiaDR2 proper motions and distances, we used tangential velocities, defined as Vtan=4.74µd, where Vtanis given in km s−1,µis the total proper motion in arcsec yr−1 anddis the distance in pc.
Figure 10 shows the distribution of the mean tangential ve-locities with the effective temperature. The discretization seen in the values ofTeff is a consequence of the step adopted in the CIFITS grid of models. The lack of correlation between tangen-tial velocities and effective temperature indicates that our candi-dates represent a single kinematic population irrespective of the spectral type.
1 . 4 5 1 . 5 0 1 . 5 5 1 . 6 0 1 . 6 5 1 . 7 0
G-Rp (Gaia) 0 . 8
0 . 9 1 . 0 1 . 1 1 . 2 1 . 3
J-K (2MASS)
Fig. 9. J −Ks vs G−Rp colour-colour diagram of our candidate
UCDs with good 2MASS photometry (Qflg=A) inJandKsbands. Red
squares represent our three candidate UCDs at distancesd<40 pc. In-verted green triangles indicate objects with tangential velocities Vtan> 100 km s−1
2 5 0 0 2 6 0 0
2 7 0 0 2 8 0 0
2 9 0 0
Effective temperature (K) 0
2 0 4 0 6 0 8 0 1 0 0
Tangentail velocity (km/s)
Fig. 10.Mean tangential velocities of our candidate UCDs. Error bars represent the standard deviation.
[image:7.595.304.553.505.656.2]Table 4.Newly identified nearby (d<40 pc) candidate UCDs. Coordinates are fromGaiaDR2. We adopted the step of the BT-Settl CIFITS grid of models (100 K) as the error in effective temperatures.
GaiaID α δ G Teff µαcosδ µδ d
DR2 (deg) (deg) [mag] [K] [mas/yr] [mas/yr] [pc]
1902388491693623680 338.44505 33.99409 17.57 2900 254.44±0.25 104.42±0.26 32.45±0.15
2109889524381399040 274.94447 41.03144 17.89 2700 21.30±0.23 -250.82±0.24 39.60±0.19
1596590634148306944 236.27034 52.23673 17.16 2900 57.26±0.18 86.54±0.18 39.98±0.15
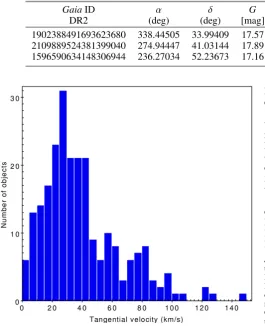
Fig. 11.Histogram of tangential velocities of our candidate UCDs
These six high-velocity objects do not show unusual colours for their spectral type (Fig. 9). AdoptingVtan=180 km s−1as the boundary between disk and halo objects (Sesar et al. 2008), we conclude that all our UCD candidates correspond to thin disk ob-jects, with the six high-velocity objects being potential members of the thick disk.
5. Conclusions
Using a Virtual Observatory methodology we have produced a catalogue of 187 new candidate ultracool dwarfs using J-PLUS IDR201709. Our goal was not to construct a complete catalogue. Rather, we attempted to build a catalogue of bona fide UCDs and to test a search methodology that could be used for new J-PLUS releases and, what is more interesting, for the deeper J-PAS sur-vey with first light happening in 2019. J-PAS, with its contiguous system of 54 narrow-band filters, will provide an unprecedented photometric coverage in the optical range, allowing more accu-rate determinations of the effective temperatures and, probably, a direct confirmation of the true UCD nature of our objects with-out the need for external spectroscopic follow-up.
The use of a dual methodology based on photometry and proper motions tends to minimize the drawbacks and biases as-sociated to the search of ultracool objects: photometric-only se-lected samples may leave out peculiar UCDs not following the canonical trend in colour-colour diagrams, while proper motion searches may ignore objects with small values of projected ve-locity in the plane of the sky. The high success ratio recovering
known UCDs (>95%) demonstrates the robustness of our pro-cedure.
With the help of the VOSA Virtual Observatory tool we es-timated effective temperatures for our candidate UCDs. They range from M7 V to L0 V with the great majority of the objects having M7–8 V spectral types. Distances were computed using Gaiaparallaxes with relative errors less than 20%. A mean value of 130 pc was obtained, with the closest and farthest objects at 32 pc and 352 pc, respectively. We also identified three new sys-tems with distancesd<40 pc.
Analysis on tangential velocities concluded that our candi-date UCDs are consistent with the Galactic thin-disk population. However, there are six objects that lie at the tail end of the ve-locity distribution and are likely part of an older Galactic popu-lation.
Acknowledgements. We thank our referee, Dr. Zenghua Zhang, for his construc-tive suggestions. We deeply thank J-PLUS collaboration, in particular, S. Akras, E. Alfaro, A. Alvarez, M. Borges, P. Coelho, C. L. Mendes, V. Placco, and L. Schmidt for constructive comments that helped to improve the presentation of the results. We acknowledge use of the ADS bibliographic services. This research has made use of the Aladin sky atlas developed at CDS, Strasbourg Observatory, France. This publication makes use of VOSA, developed under the Spanish Virtual Observatory project supported from the Spanish MINECO through grant AyA2017-84089. This work has made use of data from the Eu-ropean Space Agency (ESA) missionGaia13, processed by theGaiaData
Pro-cessing and Analysis Consortium (DPAC)14. We also extensively made use of
the Vizier and SIMBAD services, both operated at CDS, Strasbourg, France. Funding for the J-PLUS Project has been provided by the Governments of Spain and Aragón through the Fondo de Inversiones de Teruel, the Spanish Ministry of Economy and Competitiveness (MINECO; under grants AYA2015-66211-C2-1-P, AYA2015-66211-C2-2, AyA2012-30789 and ICTS-2009-14), and European FEDER funding (FCDD10-4E-867, FCDD13-4E-2685). The Brazilian agencies FAPERJ and FAPESP as well as the National Observatory of Brazil have also contributed to this project. RAD acknowledges support from CNPq through BP grant 312307/2015-2, CSIC through grant COOPB20263, FINEP grants REF. R 1217/13 - 01.13.0279.00 and REF 0859/10 - 01.10.0663.00 for hardware support for the J-PLUS project through the National Observatory of Brazil. E. L. Martín acknowledges support from project AYA2015-69350-C3-1-P. J. A. Hernandez-Jimenez thanks to Brazilian institution CNPq (project 150237/ 2017-0) and Chilean institution CONICYT through Programa de Astronomía, Fondo ALMA-CONICYT 2017 (project 31170038). R. Lopes was partially supported by the Brazilian agency CNPq (PQ 302037/2015-2 and PDE 200289/2017-9). F. J. E. acknowledges financial support from the ASTERICS project (ID:653477, H2020-EU.1.4.1.1. Developing new world-class research infrastructures). This work is based on observations made with the JAST/T80 telescope at the Obser-vatorio Astrofísico de Javalambre (OAJ) in Teruel, owned, managed and oper-ated by the Centro de Estudios de Física del Cosmos de Aragón. We thank the OAJ Data Processing and Archiving Unit (UPAD) for reducing and calibrating the OAJ data used in this work.
References
Aberasturi, M., Caballero, J. A., Montesinos, B., et al. 2014, AJ, 148, 36
Aberasturi, M., Solano, E., & Martín, E. L. 2011, A&A, 534, L7
Anglada-Escudé, G., Amado, P. J., Barnes, J., et al. 2016, Nature, 536, 437
13 https://www.cosmos.esa.int/gaia
Astraatmadja, T. L. & Bailer-Jones, C. A. L. 2016, ApJ, 833, 119
Babusiaux, C., van Leeuwen, F., Barstow, M. A., et al. 2018, A&A, 616, A10
Baraffe, I., Homeier, D., Allard, F., & Chabrier, G. 2015, A&A, 577, A42
Bayo, A., Rodrigo, C., Barrado Y Navascués, D., et al. 2008, A&A, 492, 277
Benítez, N., Dupke, R., Moles, M., et al. 2014, arXiv e-prints, arXiv:1403.5237
Bertin, E. & Arnouts, S. 1996, Astronomy and Astrophysics Supplement Series, 117, 393
Bochanski, J. J., Savcheva, A., West, A. A., & Hawley, S. L. 2013, AJ, 145, 40
Bonatto, C., Chies-Santos, A. L., Coelho, P. R. T., et al. 2019, A&A, 622, A179
Bonnarel, F., Fernique, P., Bienaymé, O., et al. 2000, Astronomy and Astro-physics Supplement Series, 143, 33
Bowler, B. P., Liu, M. C., & Dupuy, T. J. 2010, ApJ, 710, 45
Burgasser, A. J., Looper, D. L., Kirkpatrick, J. D., Cruz, K. L., & Swift, B. J. 2008, ApJ, 674, 451
Caballero, J. A. 2018, Geosciences, 8, 362
Caballero, J. A., Burgasser, A. J., & Klement, R. 2008, A&A, 488, 181
Cenarro, A. J., Moles, M., Cristóbal-Hornillos, D., et al. 2019, A&A, 622, A176
Chabrier, G. 2003, Publications of the Astronomical Society of the Pacific, 115, 763
Chabrier, G. & Baraffe, I. 2000, ARA&A, 38, 337
Cross, N. J. G., Collins, R. S., Mann, R. G., et al. 2012, A&A, 548, A119
Deacon, N. R. 2018, MNRAS, 481, 447
Dhital, S., West, A. A., Stassun, K. G., & Bochanski, J. J. 2010, AJ, 139, 2566
Dressing, C. D. & Charbonneau, D. 2015, ApJ, 807, 45
Epchtein, N., Deul, E., Derriere, S., et al. 1999, A&A, 349, 236
Faherty, J. K., Burgasser, A. J., Cruz, K. L., et al. 2009, AJ, 137, 1
Faherty, J. K., Rice, E. L., Cruz, K. L., Mamajek, E. E., & Núñez, A. 2013, AJ, 145, 2
Gálvez-Ortiz, M. C., Solano, E., Lodieu, N., & Aberasturi, M. 2017, MNRAS, 466, 2983
Gillon, M., Jehin, E., Lederer, S. M., et al. 2016, Nature, 533, 221
Gillon, M., Triaud, A. H. M. J., Demory, B.-O., et al. 2017, Nature, 542, 456
Helling, C., Ackerman, A., Allard, F., et al. 2008, MNRAS, 391, 1854
Henry, T. J., Jao, W.-C., Subasavage, J. P., et al. 2006, AJ, 132, 2360
Jiménez-Esteban, F. M., Caballero, J. A., Dorda, R., Miles-Páez, P. A., & Solano, E. 2012, A&A, 539, A86
Jiménez-Esteban, F. M., Caballero, J. A., & Solano, E. 2011, A&A, 525, A29
Jiménez-Teja, Y., Dupke, R. A., Lopes de Oliveira, R., et al. 2019, A&A, 622, A183
Jones, H. R. A. & Tsuji, T. 1997, ApJ, 480, L39
Kroupa, P. 2001, MNRAS, 322, 231
Lawrence, A., Warren, S. J., Almaini, O., et al. 2007, MNRAS, 379, 1599
Lindegren, L., Hernández, J., Bombrun, A., et al. 2018, A&A, 616, A2
Lodieu, N., Espinoza Contreras, M., Zapatero Osorio, M. R., et al. 2017, A&A, 598, A92
Logroño-García, R., Vilella-Rojo, G., López-Sanjuan, C., et al. 2019, A&A, 622, A180
López-Sanjuan, C., Vázquez Ramió, H., Varela, J., et al. 2019, A&A, 622, A177
Luri, X., Brown, A. G. A., Sarro, L. M., et al. 2018, A&A, 616, A9
Martín, E. L., Cabrera, J., Martioli, E., Solano, E., & Tata, R. 2013, A&A, 555, A108
Molino, A., Costa-Duarte, M. V., Mendes de Oliveira, C., et al. 2019, A&A, 622, A178
Montes, D., López-Santiago, J., Gálvez, M. C., et al. 2001, MNRAS, 328, 45
Racca, G., Laureijs, R., & Mellier, Y. 2018, in COSPAR Meeting, Vol. 42, 42nd COSPAR Scientific Assembly, E1.16–3–18
Ribas, I., Tuomi, M., Reiners, A., et al. 2018, Nature, 563, 365
San Roman, I., Sánchez-Blázquez, P., Cenarro, A. J., et al. 2019, A&A, 622, A181
Schmidt, S. J., West, A. A., Burgasser, A. J., Bochanski, J. J., & Hawley, S. L. 2010a, AJ, 139, 1045
Schmidt, S. J., West, A. A., Hawley, S. L., & Pineda, J. S. 2010b, AJ, 139, 1808
Sesar, B., Ivezi´c, Ž., & Juri´c, M. 2008, ApJ, 689, 1244
Shkolnik, E. L., Liu, M. C., Reid, I. N., Dupuy, T., & Weinberger, A. J. 2011, ApJ, 727, 6
Skrutskie, M. F., Cutri, R. M., Stiening, R., et al. 2006, AJ, 131, 1163
Smart, R. L., Marocco, F., Caballero, J. A., et al. 2017, MNRAS, 469, 401
Theissen, C. A. & West, A. A. 2014, ApJ, 794, 146
Theissen, C. A., West, A. A., & Dhital, S. 2016, AJ, 151, 41
Theissen, C. A., West, A. A., Shippee, G., Burgasser, A. J., & Schmidt, S. J. 2017, AJ, 153, 92
Wenger, M., Ochsenbein, F., Egret, D., et al. 2000, Astronomy and Astrophysics Supplement Series, 143, 9
West, A. A., Morgan, D. P., Bochanski, J. J., et al. 2011, AJ, 141, 97
Wright, E. L., Eisenhardt, P. R. M., Mainzer, A. K., et al. 2010, AJ, 140, 1868
York, D. G., Adelman, J., Anderson, John E., J., et al. 2000, AJ, 120, 1579
Zhang, Z. H., Burgasser, A. J., Gálvez-Ortiz, M. C., et al. 2019, MNRAS, 486, 1260
Zhang, Z. H., Galvez-Ortiz, M. C., Pinfield, D. J., et al. 2018, MNRAS, 480, 5447
Zhang, Z. H., Pinfield, D. J., Burningham, B., et al. 2013, MNRAS, 434, 1005
Zhang, Z. H., Pinfield, D. J., Gálvez-Ortiz, M. C., et al. 2017, MNRAS, 464, 3040
Zuckerman, B. & Song, I. 2004, ARA&A, 42, 685
Appendix A: Virtual Observatory compliant, online catalogue
In order to help the astronomical community on using our cata-logue of candidate UCDs, we developed an archive system that can be accessed from a webpage15or through a Virtual Observa-tory ConeSearch16.
The archive system implements a very simple search inter-face that allows queries by coordinates and radius as well as by other parameters of interest. The user can also select the maxi-mum number of sources (with values from 10 to unlimited) and
15 http://svo2.cab.inta-csic.es/vocats/v3/ucd_jplus/index.php
the number of columns to return (minimum, default, or maxi-mum verbosity). The result of the query is a HTML table with all the sources found in the archive fulfilling the search crite-ria. The result can also be downloaded as a VOTable or a CSV file. Detailed information on the output fields can be obtained placing the mouse over the question mark located close to the name of the column. The archive also implements the SAMP17 (Simple Application Messaging) Virtual Observatory protocol. SAMP allows Virtual Observatory applications to communicate with each other in a seamless and transparent manner for the user. This way, the results of a query can be easily transferred to other VO applications, such as, for instance, Topcat.