Original Article
Circulating levels of adiponectin and leptin
in patients with prostate cancer
Ligang Zhang1*, Meng Zhang1,2*, Jun Zhou1,2, Guangyue Luo1,2, Xianguo Chen1,2, Li Zhang1,2, Chaozhao Liang1,2
1Department of Urology, The First Affiliated Hospital of Anhui Medical University, Hefei 230022, China; 2Institute
of Urology, Anhui Medical University, Hefei 230022, China. *Equal contributors.
Received January 24, 2017; Accepted March 13, 2018; Epub June 15, 2018; Published June 30, 2018
Abstract: Prostate cancer (PCa) is one of the major health care problems in males. It is known that red and pro-cessed meat consumption, fat intake and obesity are risk factors for PCa development. Adiponectin and leptin are adipokines that are synthesized in visceral adipose tissue and associated with obesity. Up to date, the association of serum adiponectin and leptin with PCa largely remains unexplored. Therefore, we studied the concentration of adiponectin and leptin in PCa patients in Chinese population. 92 prospective cases of prostate cancer and 92 matched healthy controls were enrolled in this study. Serum adiponectin and leptin levels were detected by enzyme-linked immunosorbent assays (ELISA) technique. No statistically significant differences were observed in age, body-mass index (BMI), prostate specific antigen (PSA), fasting blood glucose (FBG), high density lipoprotein cholesterol (HDL-C), low density lipoprotein cholesterol (LDL-C), total cholesterol (TC), triglycerides (TG), creatinine (CRE), and blood urea nitrogen (BUN) in the paired groups. Both serum adiponectin and leptin levels were significantly higher in patients with PCa compared to healthy controls (P<0.001 for both). Subsequently, there was a positive correla-tion between adiponectin and PSA (r=0.285, P<0.001). Positive significant correlations between BMI, PSA, TG and leptin were also observed in whole group (r=0.270, P<0.001; r=0.348, P<0.001; r=0.170, P=0.021, respectively). However, the serum adiponectin and leptin levels were not related to the Gleason score of PCa. Receiver operating characteristic curves analysis of the investigated serum adiponectin differentiated cancer patients from the healthy individuals with a sensitivity of 87%, specificity of 56%. Leptin levels also distinguished patients from the healthy controls with a sensitivity of 69%, specificity of 68%. Our study shows that the serum levels of adiponectin and leptin in PCa patients were higher than healthy controls. Adiponectin and leptin may be important markers of PCa. For validation, further studies including large cohort studies would be required.
Keywords: Prostate cancer, circulating biomarkers, adiponectin, leptin, ELISA
Introduction
Prostate cancer (PCa) is becoming an increas-ingly noticeable public health problem, espe-cially for those countries with an aging society. As it was described in the very recent cancer statistics, PCa is estimated to account for about 21% of all cases of cancers newly diag-nosed and 8% of cancer-related deaths in men in America [1]. Although China was reported to have a lower incidence rate of PCa, the inci-dence in China has already increased steadily over the past few decades [2]. The etiology of PCa is largely inconclusive. Accumulative proofs
have verified that genetic alternations and
other etiology risk factors such as red and
pro-cessed meat consumption, fat intake, related nutrients, and obesity are considered to be ri- sk factors to develop PCa in a complex manner
[3]. Over the past few decades, the
potenti-al role of obesity in promoting the process of carcinogenesis has been gradually discovered. It has been estimated that roughly 20% of all cancers were caused by excess weight gain, and this percent may be underestimated [4, 5] and the relationship between rectal cancer, renal cancer and obesity has been revealed [6,
7]. Although individual studies were conflicted
have reported that obesity was related to a mo- destly increasing incidence of PCa [8, 9]. How- ever, the potential mechanisms between can-cer development and obesity are largely un- discovered. Several studies have elucidated that a variety of physiological and pathological processes such as insulin resistance, hyperin-sulinemia, sustained hyperglycemia, glucose
intolerance, oxidative stress, inflammation
and/or adipokine production were well-recog-nized risk factors contributing to the link of obe-sity to cancer association and determining the patients’ risks [10]. Among the various factors, the participation of adipokines has been pro-posed recently. Adipokines are secreted by adi-pose tissue which is currently considered as a complex and crucial endocrine organ in cancer development. It has been indicated the aber-rant adipokines production of adipose tissue
may result in chronic inflammation in the micro -environment and thereby initiate or promote carcinogenesis [11]. Several adipokines such as omentin-1, adiponectin and leptin are bio-logically active polypeptides produced by adi-pocytes and have been shown to be involved in obesity’s association with PCa [12, 13].
Adiponectin is secreted exclusively from adi-pose tissue, which is encoded by the gene AdipoQ and makes a protein 244 amino acids in length that is 30 kDa in weight [14]. It has been shown that adiponectin played vital roles in anti-atherosclerosis, anti-insulin resistance [14-16]. Leptin is a protein that is 16 kDa in weight and 167 amino acids in length [17]. Indeed, research suggests that leptin played a role in the progression of mammary tissue tumorigenesis via its function as a growth hor-mone [18]. Importantly, an inverse correlation between reduced adiponectin and obesity and a positive correlation between leptin levels and obesity had been reported [19, 20].
In addition, several studies have reported in- creased or decreased circulating adiponectin and leptin levels in colorectal, breast, pancre-atic, ovarian, and lung cancer patients [15, 19, 21, 22], indicating a underlying role with tumor-igenesis. Currently, to our knowledge, circulat-ing levels of adiponectin and leptin in PCa patients are largely unexplored in Asian area, especially in Chinese population. Herein, we conduct this matched case-control study to determine the serum levels of adiponectin and
leptin in patients with PCa in Chinese popu- lation.
Materials and methods
Patients and healthy controls
Between June 2014 and June 2015, 92 pa- tients newly diagnosed with PCa and who underwent trans-rectal prostate biopsy at the
first affiliated hospital of Anhui Medical
Un-iversity were enrolled in this study. Patients with PCa were divided into three groups accord-ing to grades (low, intermediate, and high gra- de determined by a Gleason score of less than 7, 7 and more than 7, respectively). Meanwhile, 92 age-matched volunteers were selected as
healthy controls from people who confirmed their fitness at the health examination center of the first affiliated hospital of Anhui Medical
University. This study was approved by the
Ethics Committee of the first affiliated hospital
of Anhui Medical University, Hefei, Anhui, People’s Republic of China. All candidates pro-vided written informed consent to allow analy-sis of data for research purposes.
All patients were recruited using the following criteria: no curative medication for prostate dis-eases; no history of malignancy or prostate operations; no diagnosis of acute infectious diseases, and no impairment of heart, liver or kidney. Venous blood samples were drawn from all patients and controls after fasting for at least 12 hours. Hemolytic, lipaemic or icteric samples were discarded. Samples were then centrifuged with 8000 rpm at 4°C for 4 min-utes and the supernatant was collected. All the serum were kept in polypropylene tubes and stored at -80°C until detection.
Physical and biochemical measurements
Anthropometric measurements obtained in th- is study included height, weight. Body mass index (BMI) was calculated as body weight divided by height squared (kg/m2). Biochemical parameters were measured in the stored ser- um samples. The serum levels of total choles-terol (TC), triacylglycerol (TG), high density lipo-protein-cholesterol (HDL-C), low density lipop- rotein-cholesterol (LDL-C) levels, fasting blood
glucose (FBG), creatinine (CRE), blood urea nitrogen (BUN) and prostate specific
methods by a clinical chemistry analyzer (Shi- madzu, cl8000, Japan).
Serum adiponectin and leptin concentration determination
Concentrations of adiponectin and leptin were detected in serum samples reserved using an enzyme-linked immunosorbent assay (ELISA) according to the user manual (adiponectin: Cusabio, CSB-E07270h, China; leptin: Cusabio,
ther they were normally distributed. Quantita- tive characteristics were reported as mean ± standard deviation (SD). If they were normally-distributed variables, the t-test was introduced for comparison within the group and between groups; if not, we selected the nonparametric Wilcoxon Mann-Whitney test to assess the
sig-nificant differences between different groups.
Subsequently, Spearman’s correlation analy-ses were conducted to test for associations between the level of adipokines and general clinical characteristics and biochemical param-eters. Non-parametric Kruskal-Wallis test was used to explore the associations between PCa grades and circulating levels of the adipokines.
Receiver operating characteristic (ROC) curve
analysis was conducted to evaluate the
sensi-tivity and specificity of adiponectin and leptin in
the prediction of malignancy and to differenti-ated cancer patients from the healthy indivi- duals.
Results
The general characteristics including anthropo-metric measurements and biochemical param-eters of patients with PCa (92 subjects) com-pared with the healthy control group (92 subjects) were listed in Table 1. No significant
differences were observed in age and BMI between the PCa patients and the healthy con-trols (P>0.05). In addition, we did not find sta -Table 1. Comparison of general characteristics and biochemical
parameters
Variables Prostate cancer group (n=92) Healthy control group (n=92) T or ZΔ P value Age (years) 72.20±6.15 70.88±5.45 1.535 0.126 BMI (kg/m2) 24.08±3.01 24.42±2.87 -0.793 0.430
PSA (ng/mL) 36.80±35.44 1.13±0.44 -11.719Δ <0.001
FBG (mmol/L) 5.92±1.18 6.04±1.67 -0.588 0.557
HDL-C (mmol/L) 1.48±0.36 1.37±0.32 2.187 0.030
LDL-C (mmol/L) 2.86±0.80 2.70±0.82 1.381 0.169 TC (mmol/L) 4.41±0.94 4.54±0.91 -1.002 0.318 TG (mmol/L) 1.51±0.55 1.36±0.58 1.749 0.082 CRE (μmol/L) 80.08±22.91 77.87±14.76 0.777 0.438 BUN (mmol/L) 6.04±1.40 5.81±1.34 1.119 0.264 Adiponectin (μg/mL) 20.32±12.09 14.56±11.72 -3.758Δ <0.001 Leptin (ng/mL) 6.28±7.28 2.44±2.52 -5.177Δ <0.001
[image:3.612.91.372.98.280.2]Bold values are statistically significant P<0.05. Abbreviations: BMI body mass index, PSA prostate-specific antigen, FBG fasting blood glucose, HDL-C high density lipoprotein-cholesterol, LDL-C low density lipoprotein-cholesterol, TC total cholesterol, TG triacylglycerol, CRE creatinine, BUN blood urea nitrogen.
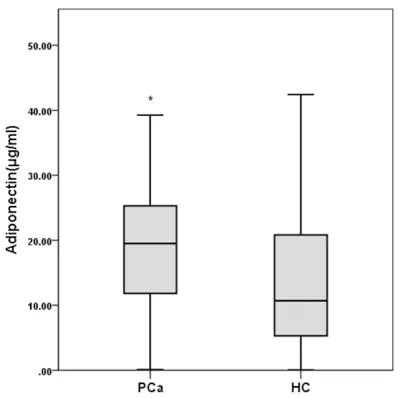
Figure 1. The adiponectin levels of PCa patients and healthy control people (n=92 for each group).
CSB-E04649h, China). The lin-ear ranges of the assay were 1.562 ng/mL-100 ng/mL for adiponectin and 0.156 ng/ mL-10 ng/mL for leptin. The inter-assay and intra-assay
coefficients of variation were
less than 8% and 10%, res- pectively.
Statistical analysis
IBM SPSS Statistics for Win- dows version 20 (IBM Corp, Armonk, NY, USA) was used for statistical analyses. A tw- otailed P<0.05 was consider-
[image:3.612.89.289.342.541.2]tistically significant differences in FBG, LDL-C,
TC, TG, CRE and BUN levels between PCa pa- tients and healthy controls (P>0.05). Patients with PCa had a higher level of PSA (P<0.001) and HDL-C (P=0.030) than healthy individuals. The adiponectin and leptin levels in both grou- ps were shown in Table 1. PCa patients had si-
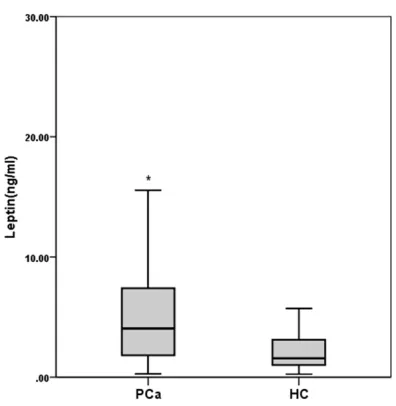
gnificantly higher serum adiponectin (P<0.001) and leptin (P<0.001) levels compared with the healthy controls (Figures 1, 2).
Spearman’s correlation analyses of adiponec
-tin and lep-tin levels with clinical and biochemi -cal parameters
Then, we analyzed the correlation between the serum adiponectin and leptin levels with vari-ous clinical characteristics and biochemical parameters in PCa group, healthy control group and whole group respectively via Spearman’s
rank correlation coefficient analysis. The result
showed that serum levels of adiponectin was
not significantly correlated with age, BMI, serum FBG, HDL-C, LDL-C, TC, TG, CRE, and
BUN levels in each group (Table 2). Whereas, adiponectin correlated positively with PSA (r= 0.282, P<0.001) in the whole group (Table 2).
For leptin, we found a positive correlation
between leptin and BMI (r=0.269, P<0.001), TG (r=0.205, P=0.005), PSA (r=0.335, P< 0.001) in the whole group. We also found a positive association between leptin and BMI (r=0.461, P<0.001), and FBG (0.345, P=0.001) in healthy control group (Table 3).
Associations between adiponectin and leptin levels with grades
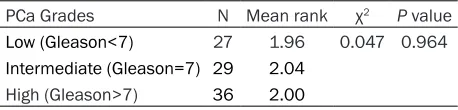
We have demonstrated no significant correla -tion between serum adiponectin levels with
PCa grades (χ2=0.047, P=0.964) (Table 4). We
also found no significant association between circulating leptin levels with grades (χ2=1.407, p=0.495) in PCa patients (Table 5).
ROC curve of adiponectin and leptin in PCa patients and healthy controls
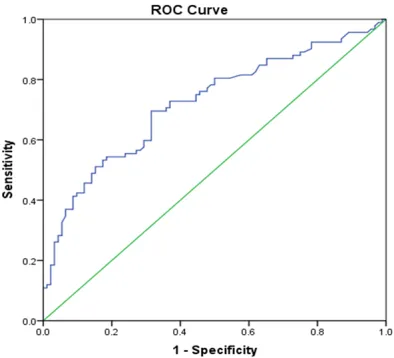
We showed the ROC curves of the investigated
serum adiponectin in Figure 3, Using a cutoff point of 8.28μg/mL for serum levels of adipo -nectin, we were able to differentiate patients with PCa patients from healthy controls with a
sensitivity of 87%, specificity of 56%. In Figure 4, leptin serum levels differentiated PCa pa- tients from the healthy controls with a
sensitiv-ity of 69%, specificsensitiv-ity of 68%, using a cutoff
point of 2.40 ng/mL. Discussion
[image:4.612.90.288.68.271.2]Prostate cancer (PCa) is the most common urological cancer, which accounts for more than 20% of men’s malignant neoplasms. The- re has been a gradual increase in the frequen-cies of PCa and obesity in developed countries, with increasingly western eating habits repre-sented by high fat and high cholesterol [23]. Therefore, the parallel morbidity trends of PCa and obesity indicated the possible relevance between them. However, the association be- tween obesity and PCa incidence is complex and has yielded inconsistent conclusions. Pa- rk et al. reported that obesity was associated with a higher risk of PCa detection as an inde-pendent factor [24], which was supported by several other studies [25, 26]. Among them, Barrington et al. elucidated that obesity was more strongly associated with increased PCa risk among African American than non-Hispan- ic white men and reducing obesity among African American men could reduce the racial disparity in cancer incidence [25]. Moreover, previous meta-analysis reported associations between a higher BMI and a higher risk of PCa [27]. Conversely, a large age-matched case-control study revealed that elevated BMI was associated with a lower risk of PCa [28]. And interestingly, there were also some other stud-ies argued that BMI was not associated with the risk of PCa [29-31].
Among the different hypothesis that describ- ed the relationship between obesity and tu- mor development, the impact of adipokines on carcinogenesis has been widely discussed. Abnormal synthesis of adipokines such as
Adiponectin is synthesized in white adipose tis-sue and exerts function of anti-atherosclerosis,
anti-inflammation or anti-insulin resistance
[image:5.612.92.522.97.266.2][15]. Adiponectin is involved in glucose and lipid homeostasis and is therefore implicated Table 2. Spearman’s correlation analysis of adiponectin levels with clinical parameters and biochemi-cal parameters
Variables
Prostate cancer group Normal control group Whole group Correlation
coefficient (r) P value coefficient (Correlation r) P value coefficient (Correlation r) P value
Age (years) -0.182 0.082 -0.151 0.150 -0.103 0.164
BMI (kg/m2) -0.170 0.105 0.132 0.210 -0.143 0.052
PSA (ng/mL) 0.136 0.196 0.084 0.424 0.285 <0.001
FBG (mmol/L) -0.163 0.121 -0.025 0.814 -0.096 0.193
HDL-C (mmol/L) 0.079 0.457 0.029 0.782 0.096 0.193
LDL-C (mmol/L) -0.028 0.788 0.046 0.666 0.055 0.458
TC (mmol/L) 0.171 0.103 -0.048 0.651 0.036 0.629
TG (mmol/L) -0.083 0.434 -0.004 0.969 0.028 0.784
CRE (μmol/L) -0.039 0.715 -0.146 0.164 -0.100 0.178
BUN (mmol/L) 0.000 0.997 0.076 0.473 0.072 0.334
[image:5.612.93.522.343.516.2]Bold values are statistically significant P<0.05. Abbreviations: BMI body mass index, PSA prostate-specific antigen, FBG fasting blood glucose, HDL-C high density lipoprotein-cholesterol, LDL-C low density lipoprotein-cholesterol, TC total cholesterol, TG triacylglycerol, CRE creatinine, BUN blood urea nitrogen.
Table 3. Spearman’s correlation analysis of leptin levels with clinical parameters and biochemical parameters
Variables
Prostate cancer group Normal control group Whole group Correlation
coefficient (r) P value coefficient (Correlation r) P value coefficient (Correlation r) P value
Age (years) 0.187 0.075 0.047 0.658 0.183 0.013
BMI (kg/m2) 0.189 0.071 0.401 <0.001 0.270 <0.001
PSA (ng/mL) 0.176 0.093 -0.116 0.273 0.348 <0.001
FBG (mmol/L) 0.041 0.699 0.346 0.001 0.144 0.050
HDL-C (mmol/L) 0.009 0.934 -0.088 0.402 0.015 0.845
LDL-C (mmol/L) 0.061 0.564 -0.073 0.489 0.046 0.536
TC (mmol/L) 0.069 0.512 -0.066 0.534 -0.030 0.686
TG (mmol/L) 0.078 0.459 0.103 0.329 0.170 0.021
CRE (μmol/L) 0.078 0.462 0.083 0.430 0.086 0.243
BUN (mmol/L) 0.069 0.512 0.027 0.795 0.093 0.211
Bold values are statistically significant P<0.05. Abbreviations: BMI body mass index, PSA prostate-specific antigen, FBG fasting blood glucose, HDL-C high density lipoprotein-cholesterol, LDL-C low density lipoprotein-cholesterol, TC total cholesterol, TG triacylglycerol, CRE creatinine, BUN blood urea nitrogen.
Table 4. Non-parametric Kruskal-Wallis test on adipo-nectin levels with PCa status
PCa Grades N Mean rank χ2 P value
Low (Gleason<7) 27 1.96 0.047 0.964 Intermediate (Gleason=7) 29 2.04
High (Gleason>7) 36 2.00
omentin-1, resistin, apelin, adiponectin and
[image:5.612.90.319.596.651.2]leptin, results in chronic low-grade inflam -mation in the microenvironment, which may contribute to tumor initiation or progression
in the pathogenesis of insulin resistance and diabetes [34]. Altered concentrations of adipo-nectin have been reported in PCa patients. Although some of these studies reported that
cancer patients had significantly lower adipo
-been shown that low adiponectin levels were related to high colorectal cancer risk [40]. Also, some reported circulated levels of adiponectin were inversely correlated with renal cancer inci-dence [41]. In PCa, Michalakis et al. reported an inverse relationship between adiponectin levels and risk of PCa in an epidemiological study [36], which was supported by another study [42]. However, there were other studies demonstrated that adiponectin concentrations were not associated with risk of prostate can-cer [38]. In our study, the circulating
adiponec-tin levels of 20.32±12.09 μg/mL were obvious -ly higher within PCa patients than the healthy
people of 14.56±11.72 μg/mL (P<0.05). In ad- dition, we found no correlation between the adi-ponectin level and PCa grades, indicating that adiponectin might not be associated with the histological grade and disease stage.
Leptin is a kind of peptide hormone which is secreted from adipose tissue in proportion to an individual’s fat mass and exerts its effects via blood circulation with targets such as the central nervous system, muscle, liver and adi-pose tissue [43]. Similar to adiponectin, the leptin concentrations were correlated with obe-sity and altered concentrations of leptin have been reported in cancer patients. Epidemiolo- gical studies indicated increased circulating levels of leptin, as occurs during obesity, were associated with cancers, such as breast and colorectal cancer [19]. Research suggested that leptin played a role in the progression of mammary tissue tumorigenesis via its func- tion as a growth hormone [18]. In addition, leptin had also been studied in vitro on cancer cells and was concerned with proliferation of ovarian, breast, lung pancreatic, and colorectal cancers [22], indicating a crucial effect of lep- tin in cancer development. In prostate cancer,
serum leptin was reported significantly higher
[image:6.612.88.297.91.366.2]in patients with prostate cancer as compared to controls [44], which was supported by other studies [13]. Another study reported although mean serum levels of leptin in case patients Table 5. Non-parametric Kruskal-Wallis test on leptin
levels with PCa status
PCa Grades N Mean rank χ2 P value
Low (Gleason<7) 27 1.81 1.407 0.495 Intermediate (Gleason=7) 29 2.07
High (Gleason>7) 36 2.11
Figure 3. Receiver operation characteristic (ROC) Curve of adiponectin in PCa patients and Healthy controls.
Figure 4. Receiver operation characteristic (ROC) Curve of leptin in PCa patients and Healthy controls.
nectin levels than controls [35-37], some
other studies did not find any difference in
concentrations of adiponectin between pa-
[image:6.612.90.287.424.603.2]were 10% higher than those in control subjec-
ts, the difference was not statistically signifi
-cant [38]. However, studies reported no signifi -cant association between plasma leptin levels and PCa risk was found [38, 45, 46]. Inter- estingly, there were also studies reported that PCa was associated with raised serum leptin, which was independent of obesity and serum PSA [44]. In our study, the leptin level in PCa patients at 6.28±7.28 ng/ml was higher than healthy controls at 2.44±2.52 ng/ml (p<0.001).
Furthermore, the serum levels were not corre -lated with different clinical and biochemical
parameters, such as age, FBG, HDL-C, HDL-C,
TC, CRE and BUN. In addition, the serum levels were positively associated with BMI and PSA, suggesting leptin may be a marker of PCa relat-ed to BMI. Thus, obesity-relatrelat-ed leptin exhibits a tumorigenic role in prostate cancer. Similar to
adiponectin, we also did not find a correlation
between the leptin level and PCa grades, sug-gesting that leptin also might not be correlated with the histological grades and stages of PCa.
ROC analysis is a standard methodology to evaluate the performance of a classification
system, which is applied extensively within cli-
nical medicine. The ROC curve is a two-dimen -sional plot which illustrates the relationship between the true positive rate (sensitivity) and
the false positive rate (1-specificity) of a binary classifier [47-49]. In our study, ROC analysis of
the investigated serum adiponectin differenti-ated cancer patients from the healthy
individu-als with a sensitivity of 87%, specificity of 56%;
leptin levels also distinguished patients from healthy controls with a sensitivity of 69%,
spec-ificity of 68%, indicating the diagnostic role of
the adipokines.
In conclusion, we found significantly elevated
adiponectin and leptin levels in patients with PCa, which were independent of most of the clinical and biochemical parameters. Adipon- ectin and leptin may be important markers of PCa. In the future, more large cohort-based researches will be necessary to elucidate the possible mechanisms underlying the deregu-lated adipokines levels and the interactions between adipose tissues with PCa. Such effor- ts will shed novel insights into effective and
efficient therapy and diagnosis of prostate
cancer.
Acknowledgements
This work was supported by grants from the
National Natural Science Foundation of China
(No. 81401518, 81470986, 81630019). We are also grateful to Dr. Souvik Mendal at University of Science and Technology of China for participating in the critical revision of our manuscript.
Disclosure of conflict of interest
None.
Address correspondence to: Chaozhao Liang and Li Zhang, Department of Urology, The First Affiliated Hospital of Anhui Medical University, Hefei 230022, China; Institute of Urology, Anhui Medical University, No. 218 Jixi Road, Hefei 230022, China. Tel: +86-551-62923932; Fax: +86-551-63633742; E-mail: lzhang@ahmu.edu.cn (LZ); liang_chaozhao@ahmu. edu.cn (CZL)
References
[1] Siegel RL, Miller KD, Jemal A. Cancer statistics, 2016. CA Cancer J Clin 2017; 67: 7-30. [2] Chen W, Zheng R, Baade PD, Zhang S, Zeng H,
Bray F, Jemal A, Yu XQ, He J. Cancer statistics in China, 2015. CA Cancer J Clin 2016; 66: 115-132.
[3] Stefani ED, Boffetta PL, Ronco A, Deneo-Pel-legrini H. Meat consumption, related nutrients, obesity and risk of prostate cancer: a case-control study in uruguay. Asian Pac J Cancer Prev 2016; 17: 1937-1945.
[4] Calle EE, Rodriguez C, Walker-Thurmond K, Thun MJ. Overweight, obesity, and mortality from cancer in a prospectively studied cohort of U.S. adults. N Engl J Med 2003; 348: 1625-1638.
[5] Wolin KY, Carson K, Colditz GA. Obesity and cancer. Oncologist 2010; 15: 556-565. [6] Shen XD, Zhang L, Che H, Zhang YY, Yang C,
Zhou J, Liang CZ. Circulating levels of adipocy-tokine omentin-1 in patients with renal cell cancer. Cytokine 2016; 77: 50-55.
[7] Fazeli MS, Dashti H, Akbarzadeh S, Assadi M, Aminian A, Keramati MR, Nabipour I. Circulat-ing levels of novel adipocytokines in patients with colorectal cancer. Cytokine 2013; 62: 81-85.
pros-tate cancer: a dose-response meta-analysis of 29,464 patients. PLoS One 2014; 9: e106677. [10] De Pergola G, Silvestris F. Obesity as a major
risk factor for cancer. J Obes 2013; 2013: 291546.
[11] Liao LM, Schwartz K, Pollak M, Graubard BI, Li Z, Ruterbusch J, Rothman N, Davis F, Wachold -er S, Colt J, Chow WH, Purdue MP. S-erum leptin and adiponectin levels and risk of renal cell carcinoma. Obesity (Silver Spring) 2013; 21: 1478-1485.
[12] Uyeturk U, Sarici H, Kin Tekce B, Eroglu M, Ke-mahli E, Uyeturk U, Gucuk A. Serum omentin level in patients with prostate cancer. Med On -col 2014; 31: 923.
[13] Arisan ED, Arisan S, Atis G, Palavan-Unsal N, Ergenekon E. Serum adipocytokine levels in prostate cancer patients. Urol Int 2009; 82: 203-208.
[14] Scherer PE, Williams S, Fogliano M, Baldini G, Lodish HF. A novel serum protein similar to C1q, produced exclusively in adipocytes. J Biol Chem 1995; 270: 26746-26749.
[15] Barb D, Williams CJ, Neuwirth AK, Mantzoros CS. Adiponectin in relation to malignancies: a review of existing basic research and clinical evidence. Am J Clin Nutr 2007; 86: s858-866. [16] Ziemke F, Mantzoros CS. Adiponectin in insulin
resistance: lessons from translational re-search. Am J Clin Nutr 2010; 91: 258S-261S. [17] Friedman J. 20 years of leptin: leptin at 20: an
overview. J Endocrinol 2014; 223: T1-8. [18] Roberts DL, Dive C, Renehan AG. Biological
mechanisms linking obesity and cancer risk: new perspectives. Annu Rev Med 2010; 61: 301-316.
[19] Tessitore L, Vizio B, Jenkins O, De Stefano I, Ritossa C, Argiles JM, Benedetto C, Mussa A. Leptin expression in colorectal and breast can-cer patients. Int J Mol Med 2000; 5: 421-426. [20] Arita Y, Kihara S, Ouchi N, Takahashi M, Maeda
K, Miyagawa J, Hotta K, Shimomura I, Naka-mura T, Miyaoka K, Kuriyama H, Nishida M, Yamashita S, Okubo K, Matsubara K, Muragu -chi M, Ohmoto Y, Funahashi T, Matsuzawa Y. Paradoxical decrease of an adipose-specific protein, adiponectin, in obesity. Biochem Bio-phys Res Commun 1999; 257: 79-83. [21] Drew JE. Molecular mechanisms linking
adipo-kines to obesity-related colon cancer: focus on leptin. Proc Nutr Soc 2012; 71: 175-180. [22] Garofalo C, Surmacz E. Leptin and cancer. J
Cell Physiol 2006; 207: 12-22.
[23] Yang L, Colditz GA. Prevalence of overweight and obesity in the united states, 2007-2012. JAMA Intern Med 2015; 175: 1412-1413. [24] Park J, Cho SY, Lee SB, Son H, Jeong H. Obesity
is associated with higher risk of prostate can-cer detection in a biopsy population in Korea. BJU Int 2014; 114: 891-895.
[25] Barrington WE, Schenk JM, Etzioni R, Arnold KB, Neuhouser ML, Thompson IM Jr, Lucia MS, Kristal AR. Difference in association of obesity with prostate cancer risk between US African American and bon-hispanic white men in the Selenium and Vitamin E Cancer Prevention Trial (SELECT). JAMA Oncol 2015; 1: 342-349. [26] Hu MB, Bai PD, Wu YS, Zhang LM, Xu H, Na R,
Jiang HW, Ding Q. Higher body mass index in-creases the risk for biopsy-mediated detection of prostate cancer in Chinese men. PLoS One 2015; 10: e0124668.
[27] Bhaskaran K, Douglas I, Forbes H, dos-Santos-Silva I, Leon DA, Smeeth L. Body-mass index and risk of 22 specific cancers: a population-based cohort study of 5.24 million UK adults. Lancet 2014; 384: 755-765.
[28] Boehm K, Sun M, Larcher A, Blanc-Lapierre A, Schiffmann J, Graefen M, Sosa J, Saad F, Par -ent ME, Karakiewicz PI. Waist circumference, waist-hip ratio, body mass index, and prostate cancer risk: results from the North-American case-control study prostate cancer & environ-ment study. Urol Oncol 2015; 33: 494, e1-7. [29] Benn M, Tybjaerg-Hansen A, Smith GD,
Nor-destgaard BG. High body mass index and can-cer risk-a Mendelian randomisation study. Eur J Epidemiol 2016; 31: 879-92
[30] Bonn SE, Sjolander A, Tillander A, Wiklund F, Gronberg H, Balter K. Body mass index in rela-tion to serum prostate-specific antigen levels and prostate cancer risk. Int J Cancer 2016; 139: 50-57.
[31] Baillargeon J, Platz EA, Rose DP, Pollock BH, Ankerst DP, Haffner S, Higgins B, Lokshin A, Troyer D, Hernandez J, Lynch S, Leach RJ, Thompson IM. Obesity, adipokines, and pros -tate cancer in a prospective population-based study. Cancer Epidemiol Biomarkers Prev 2006; 15: 1331-1335.
[32] Aprahamian TR, Sam F. Adiponectin in cardio -vascular inflammation and obesity. Int J Inflam 2011; 2011: 376909.
[33] Zhang YY, Zhou LM. Omentin-1, a new adipo -kine, promotes apoptosis through regulating Sirt1-dependent p53 deacetylation in hepato-cellular carcinoma cells. Eur J Pharmacol 2013; 698: 137-144.
[34] Duncan BB, Schmidt MI, Pankow JS, Bang H, Couper D, Ballantyne CM, Hoogeveen RC, Heiss G. Adiponectin and the development of type 2 diabetes: the atherosclerosis risk in communities study. Diabetes 2004; 53: 2473-2478.
[35] Goktas S, Yilmaz MI, Caglar K, Sonmez A, Kilic S, Bedir S. Prostate cancer and adiponectin. Urology 2005; 65: 1168-1172.
concentra-tions and tissue expression of adiponectin re-ceptors are reduced in patients with prostate cancer: a case control study. Cancer Epidemiol Biomarkers Prev 2007; 16: 308-313.
[37] Tewari R, Rajender S, Natu SM, Goel A, Dalela D, Goel MM, Tondon P. Significance of obesity markers and adipocytokines in high grade and high stage prostate cancer in North Indian men - a cross-sectional study. Cytokine 2013; 63: 130-134.
[38] Li H, Stampfer MJ, Mucci L, Rifai N, Qiu W, Kurth T, Ma J. A 25-year prospective study of plasma adiponectin and leptin concentrations and prostate cancer risk and survival. Clin Chem 2010; 56: 34-43.
[39] Al Khaldi RM, Al Mulla F, Al Awadhi S, Kapila K, Mojiminiyi OA. Associations of single nucleo -tide polymorphisms in the adiponectin gene with adiponectin levels and cardio-metabolic risk factors in patients with cancer. Dis Mark-ers 2011; 30: 197-212.
[40] Wei EK, Giovannucci E, Fuchs CS, Willett WC, Mantzoros CS. Low plasma adiponectin levels and risk of colorectal cancer in men: a pro-spective study. J Natl Cancer Inst 2005; 97: 1688-1694.
[41] Spyridopoulos TN, Petridou ET, Skalkidou A, Dessypris N, Chrousos GP, Mantzoros CS, Obe -sity, Cancer Oncology G. Low adiponectin lev -els are associated with renal cell carcinoma: a case-control study. Int J Cancer 2007; 120: 1573-1578.
[42] Schenk JM, Kristal AR, Neuhouser ML, Tangen CM, White E, Lin DW, Thompson IM. Serum adiponectin, C-peptide and leptin and risk of symptomatic benign prostatic hyperplasia: re-sults from the prostate cancer prevention trial. Prostate 2009; 69: 1303-1311.
[43] Margetic S, Gazzola C, Pegg GG, Hill RA. Leptin: a review of its peripheral actions and interac-tions. Int J Obes Relat Metab Disord 2002; 26: 1407-1433.
[44] Singh SK, Grifson JJ, Mavuduru RS, Agarwal MM, Mandal AK, Jha V. Serum leptin: a marker of prostate cancer irrespective of obesity. Can-cer Biomark 2010; 7: 11-15.
[45] Stattin P, Kaaks R, Johansson R, Gislefoss R, Soderberg S, Alfthan H, Stenman UH, Jellum E, Olsson T. Plasma leptin is not associated with prostate cancer risk. Cancer Epidemiol Bio-markers Prev 2003; 12: 474-475.
[46] Hsing AW, Chua S Jr, Gao YT, Gentzschein E, Chang L, Deng J, Stanczyk FZ. Prostate cancer risk and serum levels of insulin and leptin: a population-based study. J Natl Cancer Inst 2001; 93: 783-789.
[47] Toh KA, Kim J, Lee S. Maximizing area under ROC curve for biometric scores fusion. Pattern Recognit 2008; 41: 3373-3392.
[48] Berrar D, Flach P. Caveats and pitfalls of ROC analysis in clinical microarray research (and how to avoid them). Brief Bioinform 2012; 13: 83-97.