Abstract—This paper presents experimental and analytical results of a comparison of dry and flood turning in terms of quality of turned parts. Subsequently, the influence of independent input parameters on quality characteristics is investigated in order to optimize their effects. Three techniques—traditional analysis, Pareto ANOVA analysis, and the Taguchi method—are employed. Hardened alloy steel AISI 4340 has been selected as work material. The results show that for certain combinations of cutting parameters, dry turning produced better dimensional accuracy compared to that produced by flood turning. Therefore, in the future, it will be possible to develop a system through modelling the cooling process that will be capable of predicting the situations where dry turning will be beneficial. This will reduce the application frequency of cutting fluids by avoiding their unnecessary applications and, consequently, their negative impact on the environment.
Index Terms—Dry turning, flood turning, Pareto ANOVA analysis, quality characteristics, Taguchi methods.
I. INTRODUCTION
Turning, in which material is removed from the external surface of a rotating workpiece, is one of the most basic material removal processes. Therefore, turning is the first choice for machining cylindrical parts. The performance of a turning operation is greatly influenced by the application of cutting fluid, and, in this regard, turning operations can be classified into different types, such as dry turning, turning with minimum quantity lubrication (MQL), flood turning, and cryogenic turning. Of these, flood turning is the most traditional technique and by far the most widely used in industry. The process is characterized by the application of a large quantity of liquid, known as cutting fluid, at the cutting tool and workpiece interface.
In flood turning, also known as wet turning, cutting fluid is applied for a number of reasons, such as to reduce the cutting temperature, to lengthen the tool life, to produce a better surface finish, to improve dimensional accuracy, and to facilitate chip disposal. However, in recent years, the application of cutting fluids in machining operations has
Manuscript received March 16, 2010.
N. H. Rafai is a postgraduate student at the Department of Mechanical Engineering, Curtin University of Technology, GPO Box U1987, Perth, WA 6845, Australia (e-mail: [email protected]).
M. N. Islam is a lecturer at the Department of Mechanical Engineering, Curtin University of Technology, GPO Box U1987, Perth, WA 6845, Australia (phone: +618 9266 3777; fax: +618 9266 2681; (e-mail:
attracted immense scrutiny due to its adverse effects on health and the environment. Consequently, dry turning has gained renewed interest for its potential environmental and economic benefits. Nevertheless, in spite of all its economic and environmental benefits, the dimensional accuracy and surface finish of component parts produced by dry turning should not be sacrificed. Therefore, to make an informed decision, a direct comparison is needed between dry and flood turning in terms of the quality of turned parts.
Comparison between various forms of turning has received attention in the research literature. A number of studies have reported on comparisons of different types of turning operations in terms of various machining performance characteristics such as tool wear [1-3], cutting force [4], cutting temperature [4], and productivity [5]. Comparatively, there have been relatively few studies reporting on the quality of turned parts such as dimensional accuracy [6], even though, in the majority of cases, dimensional accuracy is the first criterion in determining the acceptability of manufactured parts. Nonetheless, a number of publications [3, 6] have reported on comparisons of surface roughness achievable by different types of turning operations. In this project, an attempt has been made to compare the shortcomings of dry turning over flood turning by monitoring the quality characteristics of turned parts.
Turning, like any other machining process, is greatly influenced by independent input variables—cutting speed, feed rate, and depth of cut—commonly known as cutting conditions. These cutting conditions are also believed to have significant effects on the quality of the machined parts. Since these cutting parameters can be chosen and controlled by the user and are reflected in the quality of machined parts, they are the appropriate parameters for investigating their effects on the quality of turned parts. Therefore, the objective of this research is to compare dry and flood turning in terms of the quality of turned parts and to investigate the influences of independent input parameters (cutting conditions) on quality characteristics in order to optimize their effects.
II. QUALITY OF TURNED PARTS
The quality of turned parts are specified by a number of quality characteristics; of these, diameter error, circularity, and surface roughness are the three most important. Thus, in this study, they are selected for monitoring the quality of turned parts. Diameter error is the difference between the measured diameter and the designed diameter, where a positive error indicates undercutting of a cylindrical workpiece. It is an important quality characteristic of turned component parts, especially when cylindrical fits are involved.
Comparison of Dry and Flood Turning in Terms
of Quality of Turned Parts
For turned parts, circularity (also known as roundness or out-of-roundness) is another important quality characteristic that is geometric in nature. It is particularly important for rotating component parts where excessive circularity values may cause unacceptable vibration and heat. Circularity is defined by two concentric circular boundaries within which each circular element of the surface must lie [7].
Surface roughness is another important quality characteristic that can dominate the functional requirements of many component parts. For example, a good surface roughness value is necessary to prevent premature fatigue failure; to improve corrosion resistance; to reduce friction, wear, and noise; and, finally, to improve product life. Surface roughness is a measure of the fine irregularities on a surface and is defined by the height, width, direction, and shape of irregularities. There are a number of parameters currently available for measuring the surface roughness value. Yet, no single parameter appears to be capable of describing the surface quality adequately. In this study, arithmetic average,
a height parameter, has been adopted to represent surface roughness, since it is the most frequently used and internationally accepted parameter.
III. SCOPE
The main objectives of this project are to investigate the deficiency of dry turning compared to flood turning in terms of the quality of turned parts and to explore how these quality characteristics are influenced by the three independent input variables: cutting speed (A), feed rate (B), and depth of cut (C). To achieve this goal, a three-level three-parameter experiment was designed using design-of-experiment methodology. Two sets of experiments, each with 27 runs, were conducted under both dry and flood conditions. The quality characteristics of the resulting turned parts were then checked using a general purpose coordinate measuring machine (CMM) and a surface finish analyzer. The results are analyzed by three techniques: (i) traditional analysis, (ii) Pareto analysis of variation (ANOVA), and (iii) Taguchi’s signal-to-noise ratio (S/N) analysis.
In the traditional analysis, the mean values of the measured variables are used. This tool is particularly suitable for monitoring a trend of change in the relationship of variables.
Pareto ANOVA is an excellent tool for determining the contribution of each input parameter and their interactions with the output parameters (quality characteristics). It is a simplified ANOVA analysis method that does not require an ANOVA table; further details of Pareto ANOVA can be found in [8].
For the Taguchi method, the signal-to-noise ratio was calculated using the following formula [8]:
n
i
y
in
N
S
1 2
1
1
log
10
(1)where S/N is the signal-to-noise ratio (in dB), n is the number of observations, and y is the observed data.
The above formula is suitable for quality characteristics in which the adage “the smaller the better” holds true. This is the case for all three quality characteristics considered. The
higher the value of the S/N ratio, the better the result is because it guarantees optimum quality with minimum variance. A thorough treatment of the Taguchi method can be found in [9].
IV. EXPERIMENTAL WORK
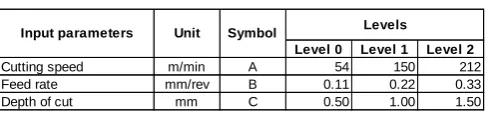
[image:2.595.306.550.297.354.2]The experiments were planned using Taguchi’s orthogonal array methodology [9]. A three-level L27 orthogonal array was selected for our experiments. For each type of turning, 9 parts were produced. Each part was divided into 3 segments. Each segment was turned with the cutting conditions determined by design of experiment (DoE). The position of the segments was allocated randomly. The total number of experiments was 54. The values of three input cutting parameters (cutting speed, feed rate, and depth of cut) were selected on the basis of the capacity and limitation of the lathe machine used; details are given in Table 1.
Table 1. Input variables
Level 0 Level 1 Level 2
Cutting speed m/min A 54 150 212
Feed rate mm/rev B 0.11 0.22 0.33
Depth of cut mm C 0.50 1.00 1.50
Input parameters Unit Symbol Levels
Hardened round bars of AISI 4340 with 30 HRC hardness value, 40 mm nominal diameter, and 120 mm length were used as blank material. AISI 4340 is a hard and difficult-to-machine material; it was selected anticipating larger differentiations in quality characteristics when machining difficult-to-machine work materials. Parts were produced on a three-axis CNC turning centre, GT-250MA, manufactured by Yeong Chin Machinery Industries Co. Ltd. (YCM), Taiwan. For holding the workpiece, a three-jaw chuck supported at the dead center was employed. Square-shaped inserts with enriched cobalt coating manufactured by Stellram, USA, were used as the cutting tools. The inserts were mounted on a standard PSDNN M12 tool holder. Castrol Clearedge EP690, a semi-synthetic soluble cutting fluid, was used in flood turning.
The precision measurements were taken by a Discovery Model D-8 coordinate measuring machine (CMM), manufactured by Sheffield, UK. The probes used were spherical probes with a star configuration, manufactured by Renishaw Electrical Ltd. The diameters of test parts were calculated using the standard build-in software package of the CMM. Eight points were measured for each measurement of diameter, and each measurement was repeated three times. The circularity data was also obtained from the CMM. The surface roughness parameter arithmetic average (Ra) for each surface was determined by a surface-measuring instrument: the Surftest SJ-201P, manufactured by Mitutoyo, Japan.
V. RESULTS AND ANALYSIS
A. Dimensional Error
A comparison of diameter error for dry and flood turning for different cutting conditions is illustrated in Figure 1. The figure shows that at a low cutting speed, there is no noticeable difference between dry and flood turning. At a medium cutting speed and low feed rate (A1B0), flood turning produces the most benefit. As the feed rate is increased, the diameter error for dry turning is improved, whereas for flood turning, diameter error is deteriorated, and at a medium cutting speed and high feed rate, (A1B2) both graphs converge. When both cutting speed and feed rate are further increased, the two graphs remain nearly identical. Nevertheless, at a high cutting speed and high feed rate (A2B2), dry turning results in better quality in terms of diameter error.
The Pareto ANOVA analysis for diameter error for dry and flood turning is given in Figure 2. The figure shows that in both cases, cutting speed (A) has the most significant effect on diameter error, and the contribution ratios for both cases are about the same (P
32%). The interaction between cutting speed and feed rate (A×B) plays a significant role in both cases, although the influence of the interaction between cutting speed and feed rate is higher in flood turning (P = 28.3%) than dry turning (P
19.7%). It is interesting to note that the contribution of feed rate (B) and depth of cut (C) approximately swaps with each other. In dry tuning, the contribution ratio for feed rate and depth of cut are P
2.8%and P
14.7%, respectively, whereas in flood turning, the contribution ratio for feed rate and depth of cut are P
13.6% and P
3.6%, respectively.The response graphs for diameter errors for dry and flood turning are illustrated in Figure 3. As the slopes of the response graphs represent the strength of contribution, the response graphs confirm the findings of Pareto AVOVA analysis. Figure 3 also reveals that with the increase of each main cutting parameter, the S/N ratio is increased, whereas this trend is changed in flood turning.
The experimental results presented above are difficult to explain because cutting speed, the most dominant factor (Figure 2), can affect diameter error in a number of ways, such as by changing elastic deformation of a workpiece, induced by a change of cutting force, by tool wear, by an increase of thermal distortion, by the formation of built-up edge (BUE), and by an increase of radial spindle error. Furthermore, there is strong interaction between cutting speed and feed rate (A×B), which makes definite conclusions difficult.
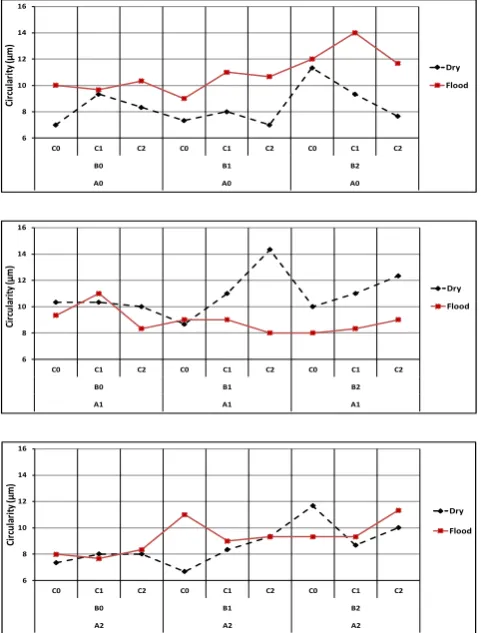
B. Circularity
A comparison of circularity for dry and flood turning for different cutting conditions is illustrated in Figure 4. The figure illustrates that at a low cutting speed, dry turning produced better quality in terms of the circularity of turned parts. As the feed rate is increased, the circularity for flood turning is improved, whereas for dry turning, circularity is deteriorated. At a medium cutting speed and high feed rate (A1B2), flood turning produced the most benefit. At a high cutting speed, region results are inconclusive.
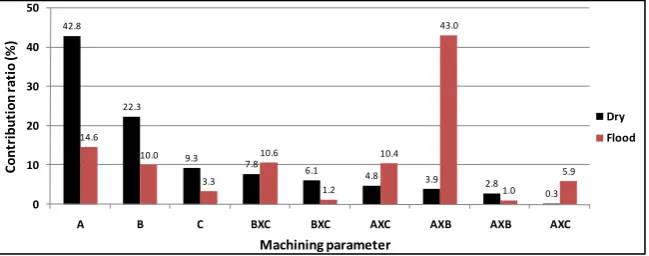
The Pareto ANOVA analysis for circularity for dry and flood turning is given in Figure 5. The figure shows that for dry turning, cutting speed has the highest contribution ratio (P
42.8%), whereas for flood turning, the interaction between cutting speed and feed rate (A×B) have the most significant effect (P
43.0%). It is worth pointing out that the total of all interaction effects is about two times larger for flood turning (P
72%) than for dry turning (P
36%). This indicates that optimizing the circularity of turned parts in flood turning by three independent cutting parameters will be difficult.The response graphs for circularity for dry and flood turning are illustrated in Figure 6. The figure shows that the application of cutting fluid changes the direction response graphs for the main interaction effects—cutting speed (A) and depth of cut (C). The main interaction effect parameter also changes from (B×C) in dry turning to (A×B) in flood turning.
C. Surface Roughness
A comparison of surface roughness resulting from dry and flood turning for different cutting conditions is shown in Figure 7. As expected, with an increased feed rate, the surface roughness values are increased for both cases and all cutting conditions investigated. However, contrary to widely held assumptions, Figure 7 illustrates no considerable benefit to flood turning compared to dry turning in terms of surface roughness; on the contrary, there is a trend of slightly better surface roughness produced by dry turning in a low cutting speed and high feed rate (A0B2) region.
The contribution ratios achieved though Pareto ANOVA analysis for surface roughness for dry and flood turning is given in Figure 8. The figure shows that, in both cases, feed rate (B) has the most significant effect on surface roughness. The influence of feed rate on surface roughness is well known; however, in both cases, the extent of this influence is surprisingly very high (P
95% for both cases). This means that for a practical machining operation, the other two cutting variables—cutting speed and depth of cut—can be overlooked, although the cutting speed selected must be high enough to avoid BUE. Being influenced by a single parameter, it is relatively uncomplicated to optimize surface roughness. This conclusion is confirmed by the response graphs illustrated in Figure 9. Nevertheless, further analysis reveals that the utilization of a low feed rate can improve the surface roughness of turned component parts. However, a reduction of feed rate decreases the production rate and should be employed as a last resort. For example, surface roughness can be improved by increasing the tool nose radius, a parameter not included in this study.VI. CONCLUDING REMARKS
The results presented in this paper should be treated with caution because other than the selected cutting parameters, there are many other factors, such as work materials, tool materials, tool geometry, and machine condition that may influence the outcome. These factors we intend to study in our future work.
REFERENCES
[1] Marksberry, P. W. and Jawahir, I. S., “A Comprehensive Tool-wear/Tool-life Model in the Evaluation of NDM (Near Dry Machining) for Sustainable Manufacturing”, Int. J. Mach. Tools & Manuf., Vol. 48, pp.878-886, 2.008
[2] Dhar, N. R., Kamruzzaman, M. and Ahmed, M., “Effect of Minimum Quantity Lubrication (MQL) on Too Wear and Surface Roughness in Turning AISI-4340 Steel”, J. Materials Processing Technology, Vol. 172, pp. 299-304, 2006.
[3] Sarma, D. K. and Dixit, U. S., “A Comparison of Dry and Air-cooled Turning of Grey Cast Iron with Mixed oxide Ceramic Tool, J. Materials Processing Technology, Vol. 190, pp. 160-172, 2007. [4] Varadaarajan, A. S., Philip, P. K. and Ramamoorthy, B.,
“Investigations on Hard Turning with Minimal Cutting Fluid Application (HTMF) and its Comparison with Dry and Wet Turning”, Int. J. Mach. Tools & Manuf., Vol. 42, pp.193-200, 2002.
[5] Harrma, V.S., Dogra, M. and Suri, N. M., “Cooling Techniques for Improved Productivity in Turning”, Int. J. Mach. Tools & Manuf., Vol. 49, pp.435-453, 2009.
[6] Dhar, N. R., Islam, M., Islam, S. and Mithu, M. A. H., “The Influence of Minimum Quantity Lubrication (MQL) on Cutting Temperature, Chip and Dimensional Accuracy in Turning AISI-1040 Steel”, J. Materials Processing Technology, Vol. 171, pp. 93-99, 2006. [7] ASME Y14.5-2009, Dimensioning and Tolerancing, ASME, New
York, 2009.
[8] Ross, P. J., Taguchi Techniques for Quality Engineering, McGraw-Hill, New York, 1988.
[9] Park, S. H., Robust Design and Analysis for Quality Engineering, Chapman & Hall, London, 1996.
.
-180 -120 -60 0 60 120 180
C0 C1 C2 C0 C1 C2 C0 C1 C2
B0 B1 B2
A0 A0 A0
D
ia
m
et
er
E
rr
o
r
(μ
m)
Dry
Flood
-180 -120 -60 0 60 120 180
C0 C1 C2 C0 C1 C2 C0 C1 C2
B0 B1 B2
A1 A1 A1
D
ia
m
et
er
E
rr
o
r
(μ
m)
Dry
Flood
-180 -120 -60 0 60 120 180
C0 C1 C2 C0 C1 C2 C0 C1 C2
B0 B1 B2
A2 A2 A2
D
ia
m
et
er
E
rr
o
r
(μ
m)
Dry
Flood
31.5
19.7 14.7
12.7 8.2
6.1
2.8 2.5 1.9
32.7 28.3
3.6 4.0
13.0
1.9 13.6
1.5 1.4
0 10 20 30 40
A AXB C BXC AXC BXC B AXB AXC
Co
n
tr
ib
u
ti
o
n
r
at
io
(%
)
Machining parameter
Dry Flood
[image:5.595.132.472.60.197.2]
Figure 2. Comparison of Pareto ANOVA analysis for diameter error for dry and flood turning
20 22 24 26 28
A0 A1 A2 B0 B1 B2 C0 C1 C2 0 1 2
(AxB)
M
e
an
S/
N
r
at
io
(d
B
)
Machining parameter level
[image:5.595.133.477.241.372.2]Dry Flood
Figure 3. Comparison of response graphs for diameter error for dry and flood turning
6 8 10 12 14 16
C0 C1 C2 C0 C1 C2 C0 C1 C2
B0 B1 B2
A0 A0 A0
Ci
rc
ul
ar
it
y
(μ
m)
Dry Flood
6 8 10 12 14 16
C0 C1 C2 C0 C1 C2 C0 C1 C2
B0 B1 B2
A1 A1 A1
Ci
rc
ul
ar
it
y
(μ
m)
Dry Flood
6 8 10 12 14 16
C0 C1 C2 C0 C1 C2 C0 C1 C2
B0 B1 B2
A2 A2 A2
Ci
rc
ul
ar
it
y
(μ
m)
Dry Flood
Figure 4. Comparison of circularity for dry and flood turning under different cutting conditions
0 1 2 3 4 5 6
C0 C1 C2 C0 C1 C2 C0 C1 C2
B0 B1 B2
A0 A0 A0
Su
rf
ac
e
Ro
ug
hn
es
s (
μm)
Dry Flood
0 1 2 3 4 5 6
C0 C1 C2 C0 C1 C2 C0 C1 C2
B0 B1 B2
A1 A1 A1
Su
rf
ac
e
Ro
ug
hn
es
s (
μm)
Dry Flood
0 1 2 3 4 5 6
C0 C1 C2 C0 C1 C2 C0 C1 C2
B0 B1 B2
A2 A2 A2
Su
rf
ac
e
Ro
ug
hn
es
s (
μm)
Dry Flood
[image:5.595.305.547.419.737.2] [image:5.595.49.292.420.737.2]42.8
22.3
9.3 7.8
6.1 4.8
3.9 2.8
0.3 14.6
10.0
3.3 10.6
1.2 10.4
43.0
1.0 5.9
0 10 20 30 40 50
A B C BXC BXC AXC AXB AXB AXC
Co
n
tr
ib
u
ti
o
n
r
at
io
(%
)
Machining parameter
[image:6.595.137.462.51.179.2]Dry Flood
Figure 5. Comparison of Pareto ANOVA analysis for circularity for dry and flood turning
-22 -20 -18 -16
A0 A1 A2 B0 B1 B2 C0 C1 C2 0 1 2 (BxC)
0 1 2 (AxB)
M
e
an
S/
N
r
at
io
(d
B
)
Machining parameter level
[image:6.595.139.468.226.349.2]Dry Flood
Figure 6. Comparison of response graphs for circularity for dry and flood turning
96.5
1.2 0.6 0.4 0.4 0.3 0.3 0.1 0.1
94.3
1.0 0.0 0.4 0.2 1.3 0.5 1.1 0.9
0 20 40 60 80 100 120
B AXC AXC BXC BXC AXB C A AXB
Co
n
tr
ib
u
ti
o
n
r
at
io
(%
)
Machining parameter
[image:6.595.138.468.589.714.2]Dry Flood
Figure 8. Comparison of Pareto ANOVA analysis for surface roughness for dry and flood turning
-16 -12 -8 -4 0 4
A0 A1 A2 B0 B1 B2 C0 C1 C2 0 1 2
(AxB)
M
e
an
S/
N
r
at
io
(d
B
)
Machining parameter level
Dry Flood