From theory to practice: Students'
perceptions of co-operative
construction education experiences
Peer reviewedAbstract
This article reports on the findings of a study that examined the attitudes of students at higher education institutions regarding their experiences of transferring theory to the workplace. Employers in the construction industry contend that present construction-related academic programs inadequately prepare students for their future careers in the industry. It is argued that higher education institutions have given students too little that will be of real value beyond a credential that will help them get their first jobs. The opinions of first year students were surveyed before, and third and final year students after, their practical periods of employment in construction. The study concludes that all the co-operative partners in co-operative education can do much more to improve this approach to construction education in job-training.
Keywords: Cooperative education, experiential training, practical experience, on-the-job training.
VAN TEORIE TOT PRAKTYK: STUDENTE SE PERSEPSIES VAN HUL ERVARING VAN KOOPERATIEWE KONSTRUKSIE-ONDERRIG In die artikel word die bevindinge van navorsing oor die houdings van studente jeens hoeronderwysinrigtings weergegee, veral ten opsigte van hul ervaring van die oordrag van teorie no die werkplek. Werkgewers in die konstruksiebedryf wys daarop dot die huidige konstruksie-verwante akademiese programme die studente nie voldoende voorberei vir hul toekomstige loopbane in die bedryf nie. Door word van die standpunt uitgegaan dot hoeronderwysinstellings studente nie voorsien van dit wat werklik van waarde is nie, buiten as 'n toegang tot die eerste werksgeleenthede. Die menings van eerstejaar-studente is eers bekom en daarna die van derdejaar- en finalejaarstudente, n6 'n praktiese dienstydperk in die bedryf. Die gevolgtrekking word gemaak dot alle deelnemende partye op die gebied van opvoedkundige samewerking heelwat meer kan doen om hierdie benadering tot konstruksie-onderrig te verbeter.
Sleutelwoorde: Opvoedkundige samewerking, praktyk-gerigte onderrig, praktiese ervaring.
Acta Structilia 2003: 10(1 & 2)
Introduction
E
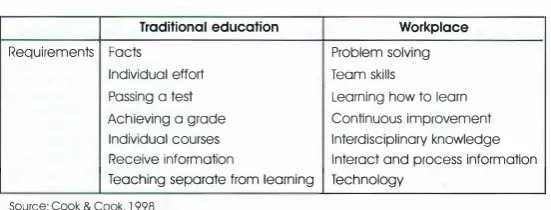
ducotion hos been described as all the ways in which people train and develop to fulfil their potential as a result of acquiring skills, attitudes, and values which reflect the social, cultural, and physical environments in which they live (Guillaud & Garnier, 2001). Higher edu cation has as one of its objectives the preparation of persons to address emerging societal problems. Institutions of higher education have a major role to play in providing the technological and business capability to underpin modern industrial and services development (Frain, 1992). While maintaining the commitment to high academic standards, they also need to be committed to responding to the needs of industry both in course content and research. However, for some time academics and practitioners have recognized the need to balance the relationship between theory as taught in the classroom, and practice in the field or in the industry (Ross & Elechi, 2002). Several authors hove highlighted that apart from course content relevant to job-related situations, there is the need for an appropriate teaching approach that bridges the perceived gap between formal academic instruction and on-the-job training (Kim, Williams & Dattilo, 2002; Sanyal, 1991: Ellington, Gordon & Fowlie, 1998; Schaafsma, 1996). This gap between what is taught in classrooms and what is needed in the workplace is well illustrated in Table 1 adapted from Cook and Cook (1998).Table l : Traditional education versus workplace
Traditional education Workplace Requirements Facts Problem solving
Individual effort Team skills
Passing a test Learning how to learn Achieving a grade Continuous improvement
Individual courses Interdisciplinary knowledge
Receive information Interact and process information Teaching separate from learning Technology
Source: Cook & Cock, 1998
[image:2.400.68.344.315.420.2]prepared for their future careers, this article reports on the findings of a study that examined the attitudes of students at higher education institutions regarding their experiences of transferring theory to the work place.
Co-operative education
Co-operative education' is an educational model designed to achieve the objective of bridging the gap between the classroom and the work place by incorporating productive work experiences into the curriculum as an integral and regular element of a higher education program. As such it involves three co-operative partners, namely the academic institution, the student, and the employer (Smith, 2000). It has been described as an instructional method that links classroom instruction and work for the purpose of enhancing the total educational program of students (Schaafsma, 1996). It is therefore evident that the co-opera tive education experience comprises two components, namely an academic component and an experiential learning component. During the latter component students experience a range of learning (knowledge, skills and attributes) that is a direct outcome from linking the specific experience in the workplace with the course content provided at a higher education institution. According to the School-to-Work (STW) Opportunities Act of 1994 in the United States, three components make up the STW experience. These are the school-based learning compo nent (academic), the work-based learning component (practical) and the connecting activities component that facilitates effective relations between the academic institution and employers. The work-based learning component is also known as industrial placement or work placement. It is described as a period of time when students are located in workplaces with the purpose of learning on the job and might either be paid or unpaid (Schaafsma, 1996). As such it provides the underpinning knowledge and attributes of competence needed for the job as a whole, such as workplace culture, work norms and values. This particular approach provides opportunities for students to have direct hands-on experience as part of their course of study. In this way students are prepared for their future careers. They acquire valuable and specialized knowledge and skills by learning from experience and reflecting on that experience while becoming acquainted with the work processes (Hicks, 1996; Rainsbury et al., 1998).
This form of experiential learning (L) may be expressed as the combina tion of three elements as follows:
Act a Structilia 2003: 10( l & 2)
Where P represents "programmed learning" or material presented in structured settings or programs such as the classroom: Q represents "'questioning learning" or knowledge and skills gained via questioning, investigation and research; and ER represents "one's own experience" reflected upon and revised (Hicks, 1996).
working environment. These activities provide program co-ordination and integration of the worlds of school and work.
Problem statement
Although students are expected to build connections between the theoretical knowledge they acquire in the classroom and the situation where they are to apply this knowledge (Kim, Williams & Dattilo, 2002), they are unfortunately not applying much of the knowledge they have gained to real world job-related situations. Consequently, their acquired knowledge may be inert and unavailable for use (Jonassen, Campbell & Davidson, 1994). Higher education institutions have given them too little that will be of real value beyond a credential that will help them get their first jobs (Boyer Commission, 1998).
Research
In South Africa, technikons offer programs in the disciplines of construc
tion management and quantity surveying on the basis of co-operative
education. The four-year Bachelor of Technology program is made up of three academic years spent full-time at the institution, with the second year spent working full-time in industry. During this 'experiential year' students complete projects in 3 subjects, namely Construction Management 2, Construction Technology 2 and Quantity Surveying 2. Students are also required to keep a logbook of all their work activities on a monthly basis. The logbook sets out the required activities that
students are expected to experience. In order to return to the institution
to complete the remaining two years, students have to obtain passing grades in each of these subjects as well as submit a duly completed
logbook.
Sample selection
Between September and October 2002 students at the two technikons in the Western Cape province in the construction management and quantity surveying programs, namely Cape Technikon and Peninsula Technikon, were surveyed. A total of l 07 first-year students and 66 third and final-year students participated in the survey. The questionnaires were administered at the respective institutions during sessions when the students were receiving instruction. Consequently, the response rate was l 00%. The responses to the questionnaires were analysed using the Statistical Program for the Social Services (SPSS).
Survey instrument
Acta Structilia 2003: 10[ 1 & 2)
and the other for returning students who had completed their "experiential year". The objective of the first-year questionnaire was to measure the attitude of students about the content of the first-year subject offerings and their relevance to their experiential year. It also sought to establish their expectations before the experiential year com menced. The objective of the other questionnaire was to obtain the opinions of students after the experiential year. The questionnaires comprised ten and 16 open and close-ended ('yes', 'no' and 'not sure') questions respectively. Some questions used a 5-point Likert scale to determine the degree of sentiment expressed in the response. The strength of close-ended questions is that they foster uniformity in
response due to the limitation of the number of possible responses. On the other hand, open-ended questions provide the possibility of rich
contextual information being collected in a manner not possible with close-ended questions (Fellows & Liu, 1997).
Findings
The responses to each questionnaire are reported for the entire sample
and per discipline. First-year students survey
The sample comprised l 07 first year students, namely 60 (56, l %) from
Cape Technikon and 47 (43,9%) from Peninsula Technikon. Of those who responded, there were 59 (60,2%) students studying quantity surveying (QS), and 39 (39,8%) studying construction management (CM) -
9 students failed to respond to this question.
First-year course content expectations
There was generally a favourable attitude towards the first-year course content. From Table 2, it is evident that 80 students (75,5%) felt that the first-year course content was what they expected it to be when they applied for admission; fifteen students (14,2%) felt that it was not, and
the remaining eleven students (l 0,3%) were not sure.
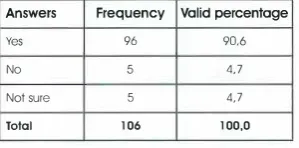
Table 2: Expectations of first-year course content
Answers Frequency Valid percentage
Yes 80 75.5
No 15 14,2
Not sure 11 10,4
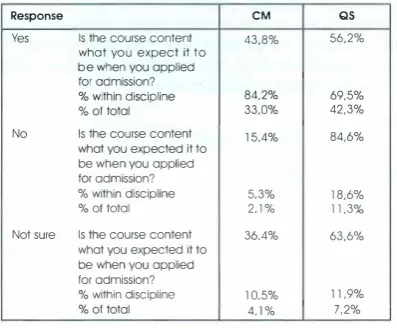
[image:6.401.57.207.436.510.2]Table 3: Cross tabulation of expectations of first-year course content
Response CM QS
Yes Is the course content 43,8% 56.2% who! you expect ii to
be when you opplled
for odmission?
% within discipline 84.2% 69.5%
o/ooftotol 33.0% 42,3%
No Is the course content 15.4% 84,6% who! you expected tt to
be when you opplied for odmission?
% within discipline 5.3% 18.6%
o/oottotol 2.1% 11.3%
Not sure Is the course content 36.4% 63.6% who! you expected tt to
be when you opplied for odmisslon?
% within discipline 10.5% 11.9%
%oftotol 4,1% 7,2%
Table 3 shows the split between the quantity surveying and construction management disciplines.Of those who felt that the content of the first year program was what they expected it to be, 43,8% were studying CM and 56, 2% were studying QS. Of those studying construction management 84,2% felt the course content was what they expected. On the other hand, 69,5% of those studying quantity surveying felt this way. Reasons given why students felt that the course content was what they expected included:
Subjects were based on and related to industry (17.3%)
Knew and expected course to be intense, tough and relevant (10.2%)
Had worked in and knew construction and therefore knew what to expect (7, l %)
Researched program before starting studies (15,3%), and Provided information as expected (13,3%).
Reasons why they thought the course content was not what they expected included:
Not all subjects were what I expected or relevant (9.2%) Thought it would be simple and not so difficult (7, l %) Expected more practicals (3, l %), and
[image:7.398.46.245.76.240.2]Acta Structilia 2003: 10(1 & 2)
Relevance and responsiveness of first-year courses to industry needs Most students had a favourable attitude about both the relevance of the subjects offered for the course as well as their responsiveness to the needs of the construction industry. It is evident from the.data in Table 4 that 96 students (90,6%) believed that the subjects offered were
relevant and responsive to the needs of the industry.
Table 4: Relevance and responsiveness of course Answers Frequency Valid percentage
Yes 96 90.6
No 5 4.7
Not sure 5 4,7
Total 106 100,0
The data in Table 5 shows the responses per discipline. Of those who felt that the subjects offered were relevant and responsive, 41,4% were studying CM and 58,6% were studying QS. Of the CM students, 94, 7% and of the QS students, 86,4% had favourable attitudes.
Table 5: Cross tabulation of relevance and responsiveness of course per discipline
Response CM QS
Yes Do you think the subjects 41.4% 58,6% offered for the course
are relevant and responsive to the needs of the construction industry?
% within discipline 94.7% 86.4%
%oftatal 37.1% 52.6%
No Do you think the subjects 100.0%
offered for the course are relevant and responsive to the needs of the
construction industry?
% within discipline 8.5%
%of total 5.2%
Not sure Do you think the subjects 40,0% 60,0% offered for the course
ore relevant and responsive to the needs of the construction industry?
% within discipline 5.3% 5,1%
[image:8.400.66.216.154.228.2]Reasons given why students felt that the course content was relevant and responsive to the needs of construction included:
Subjects provide insight into the industry (9,3%) Class work relates to the industry (55, 7%)
Subjects are adequate at year l and basic and relevant to the industry (13.4%)
• Worked in industry before studying (2, l %).
Reasons why they thought the course content was not relevant and responsive included:
Some subjects were either irrelevant or needed more time and/or better teaching (12.4%), and
Some more subjects needed to be added to improve the course (2, l %).
Satisfaction regarding subjects offered for the course
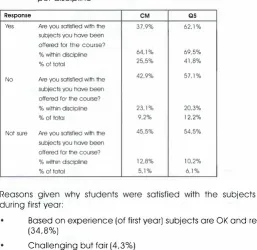
The majority of students expressed satisfaction with the subjects that they had been offered during their first year. From Table 6 it is evident that 74 students (69,2%) were satisfied with the subjects offered while 21 students (19,6%) were not.
Table 6: Satisfaction regarding subjects offered during first year
Answers Frequency Volid percentage
Yes 74 69,2
No 21 19,6
Not sure 12 11.2
Total 107 100,0
[image:9.397.41.195.321.397.2]Act a Structilia 2003: l 0( l & 2)
Table 7: Cross-tabulation of satisfaction regarding subjects offered per discipline
Response CM QS
Yes Are you satisfied with the 37,9% 62,1% subjects you have been
offered for the course?
% within discipline 64,1% 69,5%
%of total 25,5% 41.8%
No Are you satisfied with the 42,9% 57,1%
subjects you have been
offered for the course?
% within discipline 23,1% 20,3%
%of total 9.2% 12.2%
Not sure Are you satisfied with the 45,5% 54,5% subjects you have been
offered for the course?
% within discipline 12,8% 10,2%
%of total 5,1% 6,1%
Reasons given why students were satisfied with the subjects offered during first year:
Based on experience (of first year) subjects are OK and relevant (34,8%)
Challenging but fair (4.3%)
Lots of practical exposure provided (2,2%) Increases understanding of the industry (3,3%) Something I just needed to do (2,2%)
Beneficial for future profession (7,6%).
Reasons why students were not satisfied with the subjects offered during first year included:
• Not all subjects are relevant: some were disorganized and others needed more [instruction] time [22,8%), and
Subjects are fine but lecturers are not (5,4%).
Those students who were not sure about whether they were satisfied or not with the subjects offered indicated that they:
[image:10.397.58.315.73.323.2]Course as preparation for year 2
Most students felt that the first-year course prepared them sufficiently
for year 2. The data in Table B indicate that 72 students (68,6%) thought
that the course prepared them adequately for their second year - the experiential/in-service year. On the other hand, 20 students (19,0%) were not sure whether this was so or not.
Table 8: Course as preparation for year 2 Answers Frequency Valid percentage
Yes 72 68.6
No 13 12.4
Not sure 20 19,0
Total 105 100,0
Of those who felt that the first-year course prepared them adequately for year two, 33,8% were studying CM, and 66,2% were studying QS. Of the CM students, 5 7, 9% and of the QS students, 7 4, l % had favourable attitudes, suggesting that a significant number of students in each discipline were either not satisfied with the offerings or were not sure. The
responses are shown in Table 9.
Reasons given why students thought the first year course prepared them sufficiently for year 2:
Theory prepares one for practical (51, l %)
Provides [the] basics for industry experience [although] the industry is broad (10,2%)
Provided you worked throughout the year (l, l %).
Reasons why students thought the first-year course did not prepare them sufficiently for year 2:
Some subjects don't have assignments/practicals (l 0,2%)
• Year l too short (2,3%)
Acta Structilia 2003: 10[1 & 2)
Tobie 9: Cross tabulation of course as preparation for year 2 per discipline
Response CM QS
Yes Do you think the course 33.8% 66.2%
is preparing you sufficiently for year 2?
% within discipline 57.9% 74,1%
%of total 22.9% 44.8%
No Do you think the course 50.0% 50.0%
is preparing you
sufficiently for year 2?
% within discipline 15.8% 10,3%
%of total 6.3% 6.3%
Not sure Do you think the course 52,6% 47.4%
is preparing you sufficiently for year 2?
% within discipline 26.3% 15.5%
%of total 10.4% 9,4%
Those students who were not sure whether the first year course prepared them sufficiently for year 2 or not indicated that they:
Did not know what to expect from in-service training (l l ,4%), and Did not understand initially and might not be ready (2,3%). Academic or practical nature of first-year course
Opinions were more divided with respect to whether students felt that the course was too academic and less practical. From Table 10 it is evident that 39 students (38,2%) thought that the course was too academic while 51 students (50,0%) did not think so. The remaining 12 students (l l ,8%) were not sure.
Tobie lO: Academic or practical nature of course Answers Frequency Valid percentage
Yes 39 38,2
No 51 50.0
Not sure 12 11.8
Of those who felt that the first-year course was too academic and less practical, 41, 7% were studying CM and 58,3% were studying QS. Of the CM students, 39,5%, and of the QS students, 38,2%, thought that the course was too academic, suggesting that a significant number of students in each discipline were either not satisfied with the offerings or were not sure. Of those who felt that the first-year course was not too academic, 40% were studying CM, and 60% were studying QS. Of the CM students, 47,4%, and of the QS students, 49, l %, thought the course was not too academic. Clearly, more students regarded the course as not being too academic than those who did. These responses are shown in Table 11.
Reasons why students thought the first year course was too academic and less practical included:
Practical work more emphasis (37,4%) More practicals [and] site visits [13,2%) I wanted a more practical course (4,4%) Course seems more practical (5,5%).
Table 11: Cross tabulation of academic or practical nature of course per discipline
Response CM QS
Yes Do you think the course 41.7% 58.3%
is too academic and less practical?
% within discipline 39.5% 38.2%
%of total 16.1% 22.6%
No Do you think the course 40% 60,0%
is too academic and less practical?
% within discipline 47.4% 49,1%
%of total 19.4% 29.0%
Not sure Do you think the course 41,7% 58,3%
is too academic and less practical?
% within discipline 13.2% 12.7%
[image:13.396.38.268.203.471.2]Act a Structilia 2003: 10( 1 & 2)
Reasons why students thought the first year course was not too aca demic and less practical included:
Balanced approach (33,0%), and Academic side is very important (3,3%). Senior students survey
The sample comprised 66 students, namely 24 (36,4%) from Cape Technikon and 42 (63,6%) from Peninsula Technikon. Of those who responded, there were 37 (60%) students studying quantity surveying, and 26 (40%) studying construction management - 3 students failed to respond to this question. With respect to the year of study, 59 students (89,4%) were in their third year and 7 students (l 0,6%) were in their final (4'h) year.
Year 2 experiential training
Almost all these students (62 students - 95,4%) had some experiential training during year 2 as part of the workplace placement and work place-learning component of their programs. Of the students studying CM, 96,2% had some experiential training while 91,9% of students studying QS had such training. The data in Table 12 show the distribution of the types of enterprises students worked at. As expected most of the students worked for either construction companies (61, 7%) or quantity surveying practices (18,3%). The students studying QS, however, worked for a much wider range of enterprises. For example, 44, l % of QS students worked for construction companies whereas no CM students worked for QS firms. Other enterprises QS students worked for included municipalities, consultants, suppliers, community organizations, developers and sub-contractors.
Length of employment
Table 12: Types of enterprises worked at
Sample QS CM
Type
Frequency percentage Valid Frequency percentage Valid Frequency percentage Valid
Municipality l l.7 l 2.9
Construction company 37 63.8 15 44,l 22 91.7
Cosultants 2 3.4 2 5,4
QSfirm ll 19,0 ll 32.4
Supplier l l.7 l 2,9
Corrmunlty organisation l l.7 l 2,9
Developer l l.7 l 2,9
Project managers l l.7 l 4,2
Sub-contractor 3 5,l 2 5,9 l 4,2
Total 58 100,0 34 100,0 24 100,0
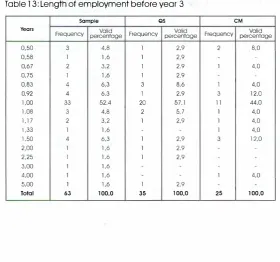
[image:15.398.46.338.76.205.2]Most students studying QS (57, l %) and 44,0% of students studying CM had been employed for the prescribed 1-year period. The mean period of employment for QS students was l , 14 years and for CM students it was l, 13 years. These results are shown in Table 13.
Table 13: Length of employment before year 3
Sample QS CM
Years Frequency Valid Valid Valid
percentage Frequency percentage Frequency percentage
0.50 3 4,8 l 2,9 2 8,0
0.58 l l.6 l 2,9
0.67 2 3.2 l 2,9 l 4,0
0,75 l 1.6 l 2.9
0,83 4 6,3 3 8,6 l 4,0
0,92 4 6,3 l 2,9 3 12,0
l.00 33 52,4 20 57. l 11 44,0
l.08 3 4,8 2 5.7 l 4,0
l. l 7 2 3,2 l 2.9 l 4,0
l.33 l l.6 l 4,0
l.50 4 6.3 l 2,9 3 12.0
2,00 l l.6 l 2.9
2.25 l l.6 l 2.9
3.00 l l,6
4,00 l l.6 l 4,0
5.00 l 1,6 l 2,9
[image:15.398.41.322.277.539.2]Acta Structilia 2003: 10(1 & 2)
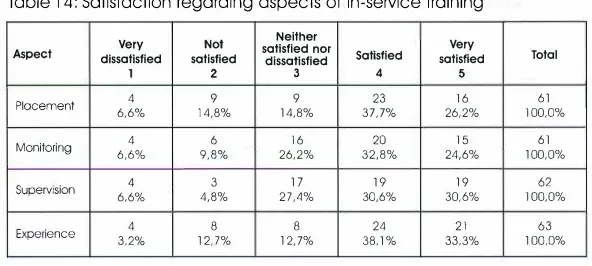
Satisfaction regarding placement
Both technikons endeavour to place their first-year students with prospective employers for their second year. Students had favourable attitudes towards the manner in which their placement was handled. This finding is confirmed by the mean of the responses to this question being 3,62 on a Likert scale of l to 5, and the median and mode being 4.0. Most students were either satisfied (37,7%) or very satisfied (26,2%). This result is shown in Tobie 14.
Similarly, most CM students were either satisfied (36,0%) or very satisfied (24,0%), while most QS students were either satisfied (35,3%) or very satisfied (29,4%). Students studying QS were more satisfied with their year 2 placement (mean= 3,68) than were those studying CM (mean= 3,52). Satisfaction regarding monitoring
Each institution monitors the progress of its second-year students during their experiential learning period of employment. The students are gen erally visited at their place of work. Students were satisfied with the way their experiential learning was monitored. This finding is confirmed by the mean of 3,59 and the median and mode of 4,0. Most students again were either satisfied (32,8%) or very satisfied (24,6%). A significant number of students (26,2%) had neutral attitudes about the monitoring of their experiential training. This result is shown in Tobie 15.
[image:16.396.58.354.391.524.2]In the same way, most CM students were either satisfied (37,5%) or very satisfied (20,8%), while most QS students were either satisfied (29,4%) or very satisfied (26,5%). 29,4% QS students had neutral attitudes as opposed to 20,8% of CM students, suggesting that QS students felt more neutral about their monitoring than did their CM counterparts. Students studying QS were more satisfied with their year 2 monitoring (mean = 3,65) than were those studying CM (mean = 3,46).
Table l 4: Satisfaction regarding aspects of in-service training
Very Nol satisfied nor Neither Very
Aspect dissatisfied satisfied dissatisfied Satisfied satisfied Total
l 2 3 4 5
Placement 6,6% 4 14,8% 9 14,8% 9 37.7% 23 26,2% 16 100,0% 61
Monitoring 6,6% 4 9,8% 6 26,2% 16 32,8% 20 24,6% 15 100,0% 61
Supervision 6,6% 4 4,8% 3 27,4% 17 30,6% 19 30,6% 19 100,0% 62
Satisfaction regarding supervision
Employers supervise second year students during their experiential learning period of employment. Students were satisfied with the way their experiential learning was supervised. This finding is confirmed by the mean of 3,74 and the median and mode of 4,0. Most students again were either satisfied (30,6%) or very satisfied (30,6%). A significant number of students (27.4%) had neutral attitudes about the monitoring of their experiential training. This result is shown in Table 14.
Similarly, most CM students were either satisfied (28.0%) or very satisfied (28.0%) while most QS students were either satisfied (32.4%) or very satisfied (35.3%). Students studying QS were more satisfied with their year 2 supervision (mean= 3,88) than those studying CM (mean= 3,60). Satisfaction regarding experience gained
Students were even more satisfied with the experience they had gained during their period of experiential learning. This finding is confirmed by the mean of 3,86 and the median and mode of 4,0. Most students again were either satisfied (30.6%) or very satisfied (30,6%). This result is shown in Table 14.
Similarly, most CM students were either satisfied (44,0%) or very satisfied (24.0%), while most QS students were either satisfied (37, 1 %) or very satisfied (40.0%). Students studying QS were more satisfied with the experience gained during year 2 (mean = 4,06) than were those studying CM (mean = 3, 72).
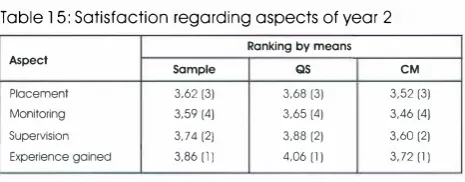
Satisfaction regarding aspects of year 2 experience
[image:17.398.45.278.383.474.2]By analysing the means of the responses of students regarding their experience during year 2, the various aspects were ranked with respect to the degree of satisfaction they felt. This result is shown in Table 15.
Table 15: Satisfaction regarding aspects of year 2 Ranking by means
Aspect Sample QS CM
Placement 3,62 [3) 3,68 [3) 3,52 [3)
Man rt a ring 3,59 [4) 3,65 [4) 3,46 [4)
Supervision 3,74 [2) 3,88 [2) 3,60 [2)
Experience gained 3,86 [1) 4.06 [1) 3,72 [1)
Acta Structilia 2003: 10(1 & 2)
They were least satisfied with the level of monitoring they received from their respective institutions.
Adequacy of year 1 as preparation for year 2
From Table 16 it is evident that most of the students (44,6%) regarded the adequacy of the year l academic courses as "average" with respect to preparation for the practical year 2. Only 15,4% of students regarded the year l courses as "very good". The mean of responses was 3,29 and the median and mode were 3,0.
[image:18.396.60.308.243.303.2]Similarly, 24,0% of CM students regarded the year l course as "good" and 20,0% as "very good", while 13,5% each of QS students regarded the year l course either as "good" or "very good". However, 32,0% of CM students and 54, l % of QS students had neutral attitudes towards the adequacy of year l as preparation for year 2. Students studying CM (mean = 3,36) were more satisfied with the adequacy of the year l course than were those studying QS (mean = 3,22).
Table 16: Adequacy of year l as preparation for year 2
Very Poor Average Good Very Total
poor good
1 12 29 13 10 65
1.5% 18,5% 44,6% 20,0% 15,4% 100,0%
Table 17 presents the reasons that students gave for their responses about the adequacy of the year l course. Most of the students (34,6%) who regarded the course as inadequate to prepare them for year 2 indicated that "much of year l was irrelevant in the field".
Table 17: Reasons for the responses regarding adequacy of first year courses
Frequency Valid percentage
18 34,6
3 5,8
3 5,8
2 3,8
5 9,6
10 19,2
3 5,8
l 1,9
l 1,9
l 1,9
l 1,9
2 3,8
l 1,9
l 1,9
Reason
Much of yeor l wos irrelevant in the field Average
Understood some terminology & some work wos familiar I worked hard and enjoyed the course
Needed some other skills not taught in year l Knew enough to be able to start work Needed more site visits: too theoretical Had previous conrstruction experience
What is done In industry is different from what is taught Do in-service training in year 3 only
Used l' year in year 2 Prepared me well for year 2 Lecturers need to be more up to date Well structured program
Total 52 100,0
[image:19.397.43.334.61.275.2]Adequacy of experiential training in year 2 in preparation for year 3 From Table 18, it is evident that most students thought the experiential training during year 2 was adequate preparation for year 3. Almost half of the students (47,6%) regarded the training as "good" and 19,0% regarded the training as "very good." The mean of responses was 3,71 and the median and mode were 4,0.
Table 18: Experiential training in year 2 as preparation for year 3
Very Poor Average Good Very Total
poor good
2 5 14 30 12 63
3,2% 7,9% 22,2% 47,6% 19,0% 100,0%
[image:19.397.43.306.363.414.2]Acta Structilia 2003: 10(1 & 2)
Table 19 presents the reasons that students gave for their responses about the adequacy of the experiential training during year 2 as preparation for year 3. Most of the students (35,8%) who regarded the course as adequate to prepare them for year 2, indicated that "the work in year 3 was more familiar". They (20,8%) also opined that they had "gained experience and confidence". Most of the students (17,0%) who felt that year 2 was inadequate "did not gain much experience". They (5, 7%) also thought that they did not have as "much site experience as I would've liked".
Table 19: Reasons about the adequacy of experiential training as preparation for year 3
Frequency Valid percentage
19 35,8
ll 20,8
3 5,7
3 5,7
3 5,7
9 17,0
l l,9
l l,9
l l,9
2 3,8
Reason
The work in year 3 was more familiar Gained experience and confidence Enaibled me to cope better with the workload Could apply some knowledge gained in industry Not as much site experience as I would've liked Did not gain much experience
Period of in-service training too short Need closer monitoring by tech. Training was good
Not always relevant to what year 3 requires
Total 53 100,0
Relevance of subjects offered to the work situation
The data in Table 20 indicate that most students felt that the subjects offered in the present course were relevant to the work situation, with 40,3% thinking that the subjects were relevant and 29,0% that the subjects were very relevant. The mean of responses was 3,92 and the median and mode were 4,0.
[image:20.397.67.351.167.333.2]Table 20: Relevance of subjects presently offered to the work situation
Very Irrelevant Average Relevant Very Total
Irrelevant relevant
2 17 25 18 62
3,2 27,4% 40,3% 29,0% 100,0%
Table 21 presents the reasons that students gave for their responses
about the relevance of the subjects presently offered to the work situation. Most of the students (27,8%) who regarded the subjects as relevant, indicated, that "everything done at work [was] being taught this year", They (l l, l %) also opined that the "work was similar".
Most of the students (22,2%) who thought the subjects were irrelevant, suggested that the "work at tech does not always relate to what is done at work", They (l 9,4%) also indicated, that "only some subjects are relevant",
Nature of course
The data in Table 22 indicate that most of the students regarded the
[image:21.396.41.327.60.123.2]course as more academic than practical. The mean of responses about the academic nature was 3,57 and the median and mode were 4,0, On the issue of the academic nature of the course QS students (mean= 3,3) regarded the course as more academic than did their CM counterparts (mean = 3,42),
Table 21: Reasons for responses regarding relevance of subjects to the work situation
Reason Frequency Valid percentage
l 2,8
l 2,8
4 11,l
8 22,2
2 5,6
10 27,8
7 19,4
l 2 .. 8
l 2,8
l 2,8
At work I needed to do everything I learnt Not all subjects were irrelevant
Work was similar
Work at tech does not always relate to what is done at work Provided some idea of what to expect
Everything done at work is being taught this year Only some subjects are relevant
Year l subjects could be done more in-depth Average
Need industry involvement in program
[image:21.396.43.333.341.485.2]Acta Structilia 2003: 10(1 & 2)
The mean of responses about the practicality of the course was 3,28 and the median and mode were 3,0. Similarly, QS students (mean= 3,35) regarded the course as more practical than did their CM counterparts (mean = 3,08). However, when comparing the means of the responses to the aspects of practicality and academic nature of the course, irrespective of discipline, students regarded the course as more academic than practical.
Table 22: Nature of program
Nature 2 3 4 5 Total
Academic 2 3 23 24 9 61
3.3% 4,9% 37,7% 39,3% 14,8% 100,0%
Practical 4 25 18 61
6.6% 11.5% 41.0% 29,5% 11.5% 100,0%
The reasons that students gave for their responses about the academic
nature of the course are shown in Table 23.
Table 23: Reasons regarding the academic nature of the program
Reason Frequency Valid percentage
Covers most of the theory needed for the job l 4,3
Provides some understanding of the industry 3 13,0
Needs improvement/more practicals 11 47,8
Need theory before practice 3 13,0
Average 2 8,7
Too practical l 4,3
Well covered l 4,3
Does not get to grips with the needs of the industry l 4,3
Total 23 100,0
Students who thought the course was too academic opined as follows:
Needs improvement/more practicals (47,8%), and
[image:22.396.65.348.60.240.2] [image:22.396.65.356.274.406.2]Those who thought that the course was not too academic responded as follows:
Need theory before practice (13,0%)
Provides some understanding of the industry (13,0%) Covers most of the theory needed for the job (4,3%).
The reasons that students gave for their responses about the practical
[image:23.396.41.333.170.279.2]nature of the course are shown in Table 24.
Table 24: Reasons regarding the practical nature of the program
Frequency Valid percentage
l 5,0
3 15,0
10 50,0
l 5,0
3 15,0
2 10,0
Reason
Covers a lot of technology Needs more effort into practicals Work at tech too theoretical; more site visits Need to find good company to work for 2 years Practical aspects important and enjoyable Balanced approach
Total 20 100,0
Socio-economic and political relevance and responsiveness of course Most students regarded the program as relevant and responsive to the economic, social and political needs of South Africa. The mean of their responses was 3,68 and the median and mode were 4,0. However, a significant number of students (40,4%) had neutral feelings about this
aspect of the program. This result is shown in Table 25. Similarly, 40,9% of
CM students and 43,8% of QS students were neutral about this issue. However, QS students (mean = 3,50) regarded the course as more relevant and responsive than did their CM counterparts (mean = 3,08).
Table 25: Relevance and responsiveness of program to economic, social and political needs of South Africa
4
23 25
1,8% 40.4% 43,9%
5
14,0% Total
[image:23.396.43.236.406.514.2]Acta Structilia 2003:10(1&2)
Some of the reasons students gave for their responses relative to whether the program was relevant and responsive to the socio-eco nomic and political needs of the country included:
Allows for affirmative action to become reality Important to economy to have the best QS's available
Equips us to contribute to infrastructure/economic development Average and needs improvement
Exposed to what is needed internationally Too irrelevant to express an opinion, and
Upgrading content of courses will improve contribution.
Discussion
There are real concerns in the construction industry about whether construction-related curricula adequately prepare students for their future careers in the industry. This is particularly true of students studying construction management and quantity surveying. This research project sought to determine from students' perspectives whether they perceived a disjunction between theory and practice. As Ross and Elechi (2002) pointed out in their study, it might be questionable to expect students to determine with validity the disjunction between theory and practice. However, as previously stated, students are one of the three co-operative partners in the co-operative education model. This particular study sought, therefore, to examine the attitudes of CM and QS students concerning their own learning experiences relative to their career preparation. The author concurs with Ross and Elechi (2002) that, as the main clients of higher education institutions, students are in the best position to assess whether they were educationally prepared for their practical year in industry and whether this year prepared them for the remainder of their program. As such their views are important.
The results of the surveys of students' attitudes regarding their co operative education experiences confirm in the main the findings in the literature on this educational approach.
each discipline had neutral feelings about the relevance of the program to the work situation. These students contended that work at the education institution did not "relate to what is done at work". However, in addressing this perceived shortcoming, caution needs to be exercised that the cooperative curriculum does not become too nar row, resulting in an unbalanced approach that makes workplace train ing suit only the demands of the construction industry. Rather students should be equipped to tackle the workplace and wider sociocivic issues and problems (Wraga, 1998).
Further, irrespective of discipline, the majority of students expressed satisfaction with the subjects that made up the first year course. However, there was also a sizable dissatisfaction factor, with a significant number of students in each discipline either being dissatisfied outright with first-year subjects or not being sure. There is probably a need for a simple conceptual model that integrates course objectives with work based outcomes, preferably around a specific project or set of competencies (Schoafsmo, 1996). Students, faculty members and employers con work together to create practical educational problems that narrow the gap between the needs and expectations of the academic institution and the industry (Smith, 2000).
Acta Structilia 2003: 10(1 & 2)
Irrespective of discipline, most first year students thought the course was not too academic. Those who thought it were suggested that practical aspects and site visits needed more emphasis. Senior students disagreed with this sentiment in that most of them regarded the course as more academic than practical. They agreed that 'more practicals' had to be included in the academic component. This finding is supported by Smith (2000: 243), who suggested that:
Learner-centered methods of teaching help students understand work related problems and also develop a range of solutions that can be tested before trying to use them at work.
Most of the senior (third-and fourth-year) students had the prescribed 12-month period of experiential training. An interesting finding was that a much wider range of employers employed students studying quantity surveying than those studying CM. Employers not only included QS firms, but also contractors, municipalities, consultants, suppliers, community organizations, developers and subcontractors. QS firms did not employ any CM students.
The findings suggest that employers were fulfilling their role as one of the partners in the cooperative education model by providing valuable industry experience and supervision in the workplace. On the other hand, the academic institutions need to revisit their monitoring and placement roles to ensure a greater degree of:
Satisfaction by students regarding their cooperative experience; and
Employability and resilience of students to workplace and work force changes (Smith, 2000).
Of concern is the large number of students in each discipline who had neutral attitudes about the relevance and responsiveness of the program to the economic, social and political needs of South Africa. Conclusion
The findings of the study suggest that much more needs to be done to ensure that students are adequately prepared, not only in the confines of a narrow curriculum, to address the socio-civic needs of South African society. Similarly, while the cooperative experience of students confirmed that employers were fulfilling their role by supervising them and ensuring that they gained adequate practical and meaningful experience, higher education institutions needed to do more to close the gap between academic preparation and job requirements. It is possible to achieve this objective through more effective placements and monitoring during students' periods in employment. Returning students confirmed that their practical period in industry enhanced their understanding of concepts in the classroom during their third and final years of study. However, it was inconclusive whether their direct hands-on experience had prepared them for their future careers in construction.
While junior and senior students had different opinions about the disjunction between classroom learning and workplace experience, it is evident that all the cooperative partners, namely academic institution, student and employer, need to narrow the gap even further between the academic and experiential learning components. Presently a study is concluded of the attitudes of employers concerning co-operative construction education at higher education institutions.
Acknowledgement
The author acknowledges the contribution of the students and staff at Cape Technikon and Peninsula Technikon, whose participation and support made this study possible.
References
BOYER COMMISSION
1998. Reinventing undergraduate education: a blueprint for America's research universities, The Boyer Commission on Educating Undergraduates. Stony Brook: The Research University, State University of New York.
COOK, J.S. & COOK, L.L.
1998. How technology enables the quality of student-centered
learning. Quality Progress, July, pp. 59-63.
ELLINGTON, H. GORDON, M. & FOWLIE, J.
1998. Using games and simulations in the classroom. London:
Kogan Page.
FELLOWS, R. & LIU, A.
Acta Structilia 2003: 10(l & 2 )
FRAIN, P.
1992. Multiplicity in Action: co-operation between higher education and industry in Ireland. European Journal of Education, 27(4), pp. 349-364.
GORDON, G., HAGE, H. & McBRIDE, R.
2001. Criminal Justice internship: theory into practice. Cincinnati: Anderson Publishing.
GUILLARD, H. & GARNIER, P.
2001. Editorial. Basin News, December, 2:2. HICKS, R.E.
1996. Experiential learning in a postgraduate project management programme. Education & Training, 38(3), pp. 28-38.
JONASSEN, D.H., CAMPBELL, J.P. & DAVIDSON, M.E.
1994. Learning with media: restructuring the debate. Educational Technology Research and Development, 42(2), pp. 31-39. KIM, B., WILLIAMS, R. & DATTILO, J.
2002. Students' perception of interactive learning modules. Journal of Research and Technology in Education, 34(4), pp. 453-473. RAINSBURY, E., HODGES, D. SUTHERLAND, J. & BARROW, M.
1998. Academic, employer and student collaborative assessment in a work-based co-operative education course. Assessment and Evaluation in Higher Education, 23(3), pp. 313-324.
ROSS, L.E. & ELECHI, 0.0.
2002. Student attitudes towards internship experiences: from theory to practice. Journal of Criminal Justice Education, 13(2), pp. 297-312. SANYAL, C.C.
1991. Higher education and the labor market. In: Altbach, P.G. (ed). Higher Education: An Encyclopaedia, l, pp. 147-168.
SHAAFSMA, H.
1996. Back to the realworld: work placements revisited. Education& Training, 38(1), pp. 5-13.
SMITH, E.A.
2000. Applying knowledge-enabling methods in the classroom and in the workplace. Journal of Workplace Learning, 12(6), pp. 236-244. WRAGA, W.G.