Q:A
Mammalian X chromosome
Q:1;2
inactivation
evolved as a
dosage-compensation mechanism for dosage-sensitive
genes on the X chromosome
Q:3
Eugénie Pessiaa, Takashi Makinob,c, Marc Bailly-Becheta, Aoife McLysaghtc, and Gabriel A. B. Maraisa,d,1
Q:4
aLaboratoire de Biométrie et Biologie évolutive, Université Lyon 1, Centre National de la Recherche Scienti
fique, Unité Mixte de Recherche 5558, Villeurbanne, F-69622 cedex, France;bDepartment of Ecology and Evolutionary Biology, Graduate School of Life Sciences, Tohoku University, Aoba-ku, Sendai 980-8578, Japan;cSmur
fit Institute of Genetics, University of Dublin, Trinity College, Dublin 2, Ireland; anddInstituto Gulbenkian de Ciência, P-2780-156 Oeiras,
Q:5 Portugal
Edited* by Michael Freeling, University of California, Berkeley, CA, and approved February 3, 2012 (received for review October 13, 2011)
How and why female somatic X-chromosome inactivation (XCI) evolved in mammals remains poorly understood. Ohno proposed
Q:6
a two-step process where XCI is a dosage-compensation mecha-nism that evolved to equalize expression levels of X-linked genes
Q:7
in females (2X) and males (1X), with a prior twofold increase in expression of X-linked genes in both sexes [Ohno S (1967) (Springer, Berlin)]. Whereas the parity of X chromosome expres-sion between the sexes has been clearly demonstrated, tests for the doubling of expression levels globally along the X chromo-some have returned contradictory results. However, changes in gene dosage during sex-chromosome evolution are not expected to impact on all genes equally, and should have greater conse-quences for dosage-sensitive genes. We show that, for genes en-coding components of large protein complexes (≥7 members)—a
class of genes that is expected to be dosage-sensitive—expression of X-linked genes is similar to that of autosomal genes within the complex. These data support Ohno’s hypothesis that XCI acts as a dosage-compensation mechanism, and allow us to refine Ohno’s model of XCI evolution. We also explore the contribution of dos-age-sensitive genes to X aneuploidy phenotypes in humans, such as Turner (X0) and Klinefelter (XXY) syndromes. X aneuploidy in humans is common and is known to have mild effects because most of the supernumerary X genes are inactivated and not af-fected by aneuploidy. Only genes escaping XCI experience dosage changes in X-aneuploidy patients. We combined data on dosage sensitivity and XCI to compute a list of candidate genes for
Q:8
X-aneuploidy syndromes.
T
he sex chromosomes of therian mammals (placentals and marsupials) originated from a pair of autosomes about 150 million years ago (1–5). The X and Y chromosomes graduallydiverged after several events of recombination suppression, probably inversions on the Y chromosome (3, 6, 7). With the exception of two very small pseudoautosomal regions (PARs), the Y chromosome never recombines. Because of its nonrecombining nature, the Y chromosome has degenerated and lost most of its genes (reviewed in ref. 8). In contrast, during therian evolution the recombining X chromosome has retained many ancestral genes (6), gained new genes, and evolved new expression patterns for some genes (4, 9, 10).
Early in the differentiation of the sex chromosomes, most ancestral genes were present on both X and Y and the imbalance of gene products between males and females would have been small. As the attrition of Y chromosome genes progressed, an increasing number of loci were uniquely present on the X chromosome, implying a twofold reduction of their expression in males (XY) compared with females (XX). X chromosome in-activation (XCI) in females makes expression of X-linked genes similar in males and females (11). However, instead of solving the problem of dosage imbalance between autosomal and X genes, XCI seemed to expand it to females. Ohno proposed that the global expression of the X chromosome must have doubled
in both sexes during evolution, solving the X:autosome imbal-ance in males, and suggested that XCI had evolved subsequently to reduce the output of X-linked genes back to the ancestral levels in females (1). Both steps are required to call XCI a dos-age-compensation mechanism.
Consistent with Ohno’s hypothesis, microarray data suggested
that the mammalian X chromosome global expression level was similar to that of autosomes (12–14). However, analysis of
RNA-seq data, which yield much more precise expression-level esti-mates than microarray data, indicated that X chromosome global expression level in humans and mice was half that of autosomes in both sexes (15). This analysis suggested that thefirst step in
Ohno’s scenario was missing and raised doubt about XCI as
a dosage-compensation mechanism (16). It was recently shown that this conclusion was strongly affected by the inclusion of testis-specific X genes in the analysis (17) (see also refs. 18–22
about the controversy regarding dosage compensation in humans). However, even though excluding these genes with no expression in somatic tissues brings X chromosome global expression closer to that of autosomes, it is still significantly lower, suggesting that the
true nature of X dosage compensation may differ from these“all
or nothing”scenarios.
In zebrafinch, chicken, and crow, partial dosage compensation
has been observed on the avian Z chromosome (23–26), with
only some Z-linked genes being dosage-compensated (27, 28). Partial Z chromosome dosage compensation has also been ob-served in silkworm (29, 30) and in the parasiteSchistosoma mansoni
(31). Studies on the platypus indicate incomplete X chromosome dosage compensation in monotremes (32, 33). Data from stick-lebacks show that the X is more strongly expressed in females than in males (34), consistent with a lack of global sex-chromosome dosage compensation in thisfish. All this work suggests that global
dosage compensation might not be a general feature of sex chro-mosomes (35).
Changes in gene dosage during sex-chromosome evolution are only expected to affect dosage-sensitive genes (35). Thisfinding
could explain why partial dosage compensation has been ob-served when analyzing all X/Z genes combined together. In this study, we focused on dosasensitive genes in the human ge-nome and tested for dosage compensation of these genes only. Early experiments comparing polyploids and aneuploids in plants have shown that imbalanced expression of dosage-sensi-tive genes can strongly impact the phenotype (36). It was later
Author contributions: G.A.B.M. designed research; E.P., T.M., and M.B.-B. performed re-Q:9;10 search; T.M. and A.M. contributed new reagents/analytic tools; E.P., M.B.-B., and G.A.B.M. analyzed data; and E.P., A.M., and G.A.B.M. wrote the paper.
The authors declare no conflict of interest.
*This Direct Submission article hada prearranged editor. Q:11
1To whom correspondence should be addressed. E-mail: gabriel.marais@univ-lyon1.fr.
This article contains supporting information online atwww.pnas.org/lookup/suppl/doi:10. 1073/pnas.1116763109/-/DCSupplemental.
EVOLUTI
ON
1 2 3 4 5 6 7 8 9 10 11 12 13 14 15 16 17 18 19 20 21 22 23 24 25 26 27 28 29 30 31 32 33 34 35 36 37 38 39 40 41 42 43 44 45 46 47 48 49 50 51 52 53 54 55 56 57 58 59 60 61 62
63 64 65 66 67 68 69 70 71 72 73 74 75 76 77 78 79 80 81 82
84 85 86 87 88
shown that in yeast, most dosage-sensitive genes are involved in protein complexes (37). Using experimental data from strains heterozygous for single-gene knockouts, researchers could in-deed show that a strong decline infitness is only observed for
genes encoding proteins involved in complexes (hereafter named protein-complex genes), such as the ribosome. These inves-tigators also found that proteins from the same complexes tend to be coexpressed at very similar levels and tend to have the same number of copies. All these lines of evidence, and others, suggest that there are strong constraints on the stoichiometry of the mem-bers of a complex and that an imbalance in such stoichiometry can be deleterious (37).
This“balance hypothesis”has become very popular and has
been repeatedly used to explain patterns of duplicate gene evo-lution in yeast, Arabidopsis, rice, composites, and Paramecium
(reviewed in refs. 38 and 39). In these organisms, most duplicate genes maintained after whole-genome duplication (WGD) events over large evolutionary periods are involved in protein complexes (40–45). In contrast, protein-complex genes are
un-derrepresented in duplicates from segmental duplications (46, 47). These patterns of gene duplicability are fully predicted by the
Q:12 balance hypothesis because WGD events will not affect the
stoichiometry of the components of a complex (but subsequent loss of a single component will be counter-selected), whereas segmental duplications will disrupt the stoichiometry.
It has been suggested that in multicellular organisms, selection for balanced dosage may be weaker than in unicellular organisms because selection is reduced in such organisms with small ef-fective population size (48, 49). Additionally, genes involved in regulatory networks (such as transcription factors) are also expected to be dosage-sensitive, and in multicellulars these genes are probably numerous (39). However, in multicellulars, many dosage-sensitive genes are likely to be protein-complex genes. This theory was explored in humans and dosage-sensitive genes were identified as genes maintained after WGD events and
re-sistant to segmental duplications and copy-number variations, and called dosage-balanced ohnologs (DBOs) (50).
Protein-complex genes were found overrepresented among these DBO genes. Strikingly, 75% of the Down syndrome (trisomy 21) candidate genes are DBOs and a highly significant excess of
DBOs was found in the Down syndrome critical region, which is known as a major determinant of the features of this syndrome. This finding is consistent with the observation that many
hap-loinsufficient genetic diseases in humans are caused by
protein-complex genes (51).
Here we focused on protein-complex genes in humans to test for the evolution of dosage compensation, specifically in
dosage-sensitive X-linked genes. We used a list of protein-complex genes inferred from experimental data and expression-level estimates from RNA-seq data in humans. Based on these results we built a list of genes of interest for X aneuploidy syndromes, our ra-tionale being that dosage-sensitive genes that escape X in-activation could be a cause of the phenotypes observed in these syndromes.
Results and Discussion
Expression Analysis of Dosage-Sensitive X Genes and Evidence for Dosage Compensation in Humans.Assuming global autosomal ex-pression level has not changed since the X and Y chromosomes originated, and if XCI has evolved to make autosomal and X expression equal (dosage compensation), as in Ohno’s scenario,
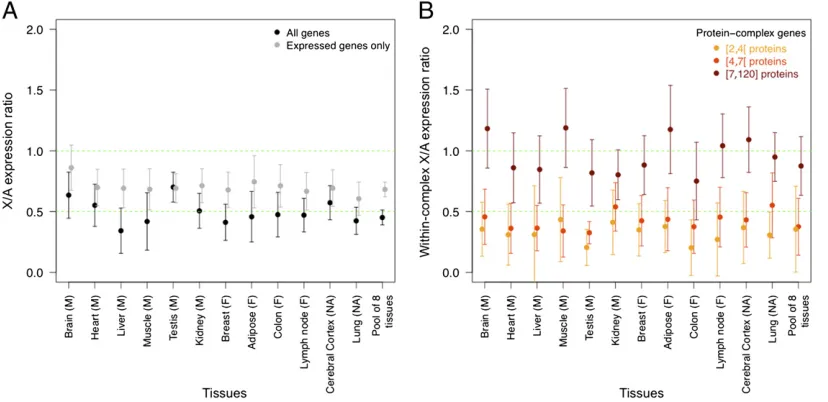
[image:2.585.92.506.450.651.2]then the X/A mean expression ratio should be 1 in both males and females. A value of 0.5 in males is expected if X expression has remained constant along XY chromosome evolution, be-cause males only have one copy of the X chromosome. In this case, a value of 0.5 is also expected in females because one of the two X chromosomes is inactivated and not transcribed. An X/A expression ratio of 0.5 would mean that XCI does not act as a dosage-compensation mechanism and its role is equivocal. Our independent analysis of data from 12 male and female tissues from ref. 15 found, as did the authors of the original analysis of that dataset, that X chromosome global expression is about half the expression of autosomes in both male and female (Fig. 1A). We checked whether differences in dataset/raw read processing
Fig. 1. X/A expression ratio. (A) For the study, 734 X genes and 19,066 autosomal genes are included (Materials and Methods). Expression of X genes is normalized by the median of autosomal gene expression. The median of X/A ratios and associated 95% confidence interval are shown for each tissue. Results for both all genes (black, as in ref. 15) and excluding nonexpressed genes (gray, as in ref. 17) are shown. (B) Here only genes involved in protein complexes are included. For each complex, we computed the median of X gene expression over that of autosomal gene expression. We prepared three groups with similar sample size with increasing protein-complex size in number of proteins: small (2≤4 proteins, yellow), medium (4≤7 proteins, orange), large (7–120 proteins, brown). For each tissue and complex size category, the median of within-complex X/A ratios and associated 95% confidence interval are shown. In both panels we show the results for a pool of eight tissues (see text). The two green dashed lines indicate expectations with dosage compensation (X/A = 1) and without dosage compensation (X/A = 0.5).
2 of 7 | www.pnas.org/cgi/doi/10.1073/pnas.1116763109 Pessia et al.
125 126 127 128 129 130 131 132 133 134 135 136 137 138 139 140 141 142 143 144 145 146 147 148 149 150 151 152 153 154 155 156 157 158 159 160 161 162 163 164 165 166 167 168 169 170 171 172 173 174 175 176 177 178 179 180 181 182 183 184 185 186
could explain differences in conclusions found in Xiong et al. (15) and Deng et al. (17), but found expression-level estimates from both studies to be strongly correlated (Materials and Methods). Using data from Xiong et al. (15), we found that the X/A expression ratio significantly increases when the
nonex-pressed genes are removed, as in Deng et al. (17): it is now close to 0.7 for most of the tissues (Fig. 1A). Thisfinding is because the
fraction of those genes is higher on the X chromosome than on the autosomes; indeed, the X chromosome includes many testis-specific genes not expressed in somatic tissues in both humans
and mice (17, 19, 22). Taken together, these data suggest that our work is not affected by differences in datasets or procedure for data-analysis, as we are able to make the same observations as in refs. 15 and 17 using differentfilters.
Deng et al. (17) inferred
Q:13 that there is a global up-regulation of
X gene expression in humans (see also ref. 19). For most tissues, however, the X/A expression ratio is close to 0.7 and is not 1, the expected value for global X up-regulation (Fig. 1A). Deng et al. (17) suggested that this is because RNA-seq data are noisy: genes with RNA-seq–estimated low expression levels can actually be
nonexpressed genes (see also ref. 19). As these genes are com-paratively more numerous on the X than on the autosomes, an X/A expression ratio smaller than 1 is expected from noisy RNA-seq data. Using brain as an example, Deng et al. (17) argued that when the expression-level distributions from X and autosomes are compared, they seem to be similar, which supports global X up-regulation (seefigure 1Ain ref. 17). However, many tissues
do show nonoverlapping X and autosomal distributions (see
Q:14
figure S1 in ref. 17). Moreover, in testis for which the number of
nonexpressed X and autosomal genes is small (17), the X/A expression ratio is still lower than 1 (Fig. 1A) (17). Instead, we interpret these data as suggestive that the X chromosome includes a mixture of up-regulated and nonup-regulated genes, the combined analysis of which returns a“mixed”X/A
expres-sion ratio between 0.5 (no dosage compensation) and 1 (full dosage compensation).
To refine the analysis we examined genes involved in protein
complexes from the Human Protein Reference Database (HPRD) list (Materials and Methods) because these genes are likely to be dosage-sensitive and should be the main target for dosage compensation. This list includes 207 human protein complexes with proteins from both X and autosomal genes. We computed the X/A expression ratio within each complex and we obtained the median of this ratio among all complexes present in a given tissue, as well as pooled for all tissues excluding “
re-productive”organs (testis, breast) and brain/nervous system
tis-sues, because X-linked genes are known to be overrepresented and overexpressed in these tissues (6, 15) (Fig. 1). A preliminary analysis showed that complex size is a strong determinant of the X/A expression ratio within protein complexes, as revealed by a multiple regression analysis, including complex size, whole-complex gene expression, and percentage of X proteins in a complex [effects on X/A: (i) complex size,Pvalue = 0.0007; (ii) percentage of X proteins,Pvalue = 0.03; (iii) global complex expression, nonsignificant]. In Fig. 1B, we therefore showed the
results for three protein-complex size categories, each containing the same number of complexes. This analysis clearly shows that the X/A expression ratio increases with protein-complex size. For large protein complexes (≥7 proteins), the X/A expression ratio is significantly higher than 0.5 for 11 of 12 tissues, as well as
in the pooled expression data. For most tissues (10 + pooled expression data), the X/A expression ratio is not significantly
different from 1, the value expected in case of dosage compen-sation. Our observation suggests that dosage-sensitivity is stronger for genes involved in large protein complexes than for genes involved in small protein complexes, which makes dosage compensation required more often for the former. Complex size has also been found to have some influence on dosage sensitivity
in yeast, because the fitness effect of dosage imbalance in
het-erozygous knockout mutants is correlated to protein-complex size (37). Several explanations could account for this finding.
First, if imbalance leads to incomplete (and nonfunctional) complexes that are destroyed by the cell, the bigger the complex, the bigger the metabolic cost for the cells. Second, subunits forming a bridge between parts of the complex can inhibit complex assembly if present in excess. This problem should in-crease with the number of subunits in a complex.
Importantly, our results are unaffected by inclusion or exclu-sion of nonexpressed genes (the patterns shown in Fig. 1B re-main exactly the same after removal of nonexpressed genes)Q:15
(Fig. S1). Deng et al. (17) showed that the X/A expression ratio
increased from 0.5 to 1, also increasing the minimum expression-level threshold required for a gene to be included in the analysis (see figure 1Din ref. 17; see also ref. 19). These authors
sug-gested this finding was because of noise in the RNA-seq data
affecting lowly expressed genes (see above) and concluded that the X chromosome was probably up-regulated as a whole. Using a similar test, we found that when the X/A expression ratio reaches 1, only a small fraction of X genes (159; i.e., 21% of the initial set of X genes) are still being analyzed, which weakens the idea of global up-regulation on the X chromosome (Fig. S2). We also found that the fraction of protein-complex genes increases when applying different thresholds for gene expression and moving the X/A expression ratio from 0.5 to 1. Importantly, this pattern is stronger for large complexes than for other complexes (Pvalue = 0.034, Fisher’s exact test with two categories for
ex-pression level using data from ref. 15:≤0.05 and>0.05), which suggests highly expressed genes include more dosage-sensitive genes, a trend that has been noted before (52). When excluding lowly expressed genes from the dataset, we may be getting rid of noisy data but we also seem to be enriching the dataset in dos-age-sensitive genes, which could help getting an X/A expression ratio of 1. Thisfinding is consistent with up-regulation of the X
chromosome affecting mostly dosage-sensitive X genes. A balanced X/A expression ratio for a given complex could result from a twofold increase of X gene expression (as in Ohno’s
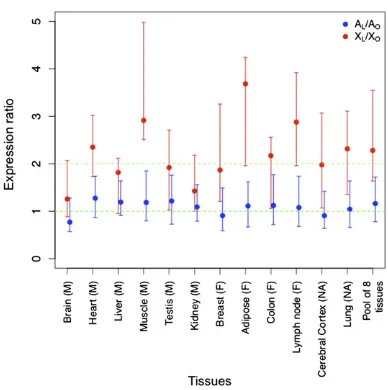
scenario) to match autosomal gene expression, or a twofold re-duction of autosomal gene expression to match X gene expres-sion. To distinguish these results, we split our dataset in two categories: large complexes (≥ 7 proteins; L) and other com-plexes (<7 proteins; O) and computed the ratio of the expres-sion in large complexes and in other complexes separately for X genes (XL/XOratio) and for autosomal genes (AL/AOratio). We found that the AL/AOratio is close to 1 for all tissues (Fig. 2 and
Fig. S1). This result indicates that expression of autosomal genes
does not differ significantly between large and other complexes,
so the dosage changes we observed (Fig. 1B) are not a general feature of high expression levels of large complexes; rather, this feature is restricted to the X chromosome. Only about 100 X genes are included in the computation of XL/XO ratio (Fig. 2 legend) and, as expected for such a small dataset, the error bars are large. Nevertheless, the XL/XO ratio is significantly higher
than 1 for 9 of 12 tissues (Pvalue = 4.9×10⁻⁴, Wilcoxon paired test) and in seven cases, this ratio is close to two, suggestive of a doubling of expression levels in agreement with dosage com-pensation. This doubling could be explained by an enrichment of RNA polymerase II in 5′of the X genes compared with auto-somal genes (17, 22) mediated by active histone marks (22).
We thusfind evidence that the scenario put forward by Ohno
of a twofold increase of X gene expression in both sexes plus inactivation of one X in female as a way of compensating for Y gene loss is valid for dosage-sensitive genes in humans. Our analysis focused on protein-complex genes, which are considered the main source of dosage-sensitive genes in yeast (37). In multicellulars, genes involved in regulatory networks may be another major source of dosage-sensitive genes (39). We know
that the dosage of some X genes escaping XCI can modulate autosomal gene expression, although the effect is small (53). This
finding suggests that many dosage-sensitive regulatory X genes
may be compensated, and it would be interesting to test for dosage compensation in these genes.
Dosage-Sensitive XCI Escapees as Candidate Genes for X Aneuploidy Syndromes.Most autosomal aneuploidies are nonviable, with the notable exception of chromosome 21. Interestingly, chromosome 21 is the human chromosome with the lowest number of dosage-sensitive genes, which suggests dosage-dosage-sensitive genes are key elements of aneuploidy phenotypes (50). The X aneuploidy in humans is known to have only mild effects, which atfirst sight
may be surprising given the size and the number of genes of the X chromosome; aneuploidies of autosomes of equivalent size are all lethal. Sex-chromosome aneuploidies have a very high prev-alence in humans, with Klinefleter (XXY) being the most
com-mon aneuploidy in men (1/500–600), Triple-X (XXX) being the
most common in females (1/1,000), and Turner (X0) being quite common in females (1/2,000–2,500). Thisfinding is explained by
X-inactivation of all of the supernumerary X chromosomes, which means that in case of loss of one X or the presence of extra X chromosomes, only one X chromosome will be active, as in XX females (54, 55). Some genes, however, escape XCI and it has been proposed long ago that these genes could underlie Turner, Klinefelter, and other X aneuploidy syndromes (56–60).
About 100 XCI escapees are currently known in humans from experiments on about 600 X genes (these are two-thirds of the X genes), which means that maybe about 150 X genes could escape XCI in total (58). This small number of genes could explain why X aneuploidies have an even milder effect than chromosome 21 trisomy (there are 449 genes on chromosome 21). Interestingly, in mice only 3% of X genes escape XCI, compared with 15% in
humans, and X monosomy in mice has smaller phenotypic effects than in human, which is consistent with XCI escapees underlying X aneuploidy syndromes (61).
Dosage is clearly central in Klinefelter syndrome, as the neurodevelopmental and psychological features of patients be-come more severe as the number of supernumerary X chromo-somes increases, for example in XXXY and XXXXY males (60). Very few candidate genes are known for any X aneuploidy syn-drome. One well-established candidate gene is SHOX, a gene from PAR1 that is involved in small stature in Turner syndrome (62, 63). SHOXis haploinsufficient in Turner patients. In
Kli-nefelter patients,SHOXescapes XCI and is overdosed and the prototypic Klinefelter patient is tall, which is consistent with
SHOX being a Klinefelter gene (59, 60). The case of SHOX
suggests that the same genes could underlie Klinefelter, Turner, and other X aneuploidy syndromes, which would make sense as these syndromes often relate to the same traits (e.g., stature, cognition). Another somewhat equivocal candidate for Turner syndrome isRPS4(57, 63).RPS4escapes XCI, has a functional Y homolog, and is located in Xq. This gene encodes a ribosomal protein and clearly falls in our dosage-sensitive gene category. Interestingly, it has been shown that 46,Xi(Xq) karyotype (i.e., isochromosome Xq) cannot be differentiated phenotypically from 45,X Turner syndrome patients (64). Thisfinding was
ini-tially considered evidence that Turner syndrome genes are on Xp because Xp is missing in 46,Xi(Xq) patients. However, the 46,Xi (Xq) patients carry three copies of the RPS4X gene and the above-mentioned results are also consistent with overdosage of
RPS4being as deleterious as half-dosage, whichfits well with the
dosage-balance hypothesis. The case ofRPS4shows that dosage-sensitive genes may have similar phenotypic effects in Turner, Klinefelter, and other X aneuploidy syndromes, but other genes, such asSHOX, may have opposed phenotypic effects depending on gene dosage.
Our results on X chromosome protein-complex genes suggest that among the XCI escapees, those that are dosage-sensitive genes might have the strongest impact on the phenotype of X0, XXY, and XXX individuals. Importantly, these genes should impact X0, XXY, and XXX individuals in a similar way, as haploinsufficiency or doubled-dosage of protein-complex genes
are expected to yield improper stoichiometry in both cases and be deleterious (37). We used the list of protein-complex genes on the X chromosome and identified those escaping XCI (Materials
and Methods) as likely candidates for X aneuploidy syndromes (Table 1). This list includes the already known RPS4 Turner candidate gene. The most interesting candidates are probably those involved in large complexes because our results suggest that constraints on dosage are stronger for these. The persistence of a Y homolog also suggests strong constraints on dosage (65) and candidates with a Y homolog and involved in large com-plexes are in boldface in Table 1. This should not be considered an exhaustive list because the data on X-inactivation and pro-tein-complex genes (and dosage-sensitive genes in general) are known to be partial.
Klinefelter syndrome is characterized by high stature, sparse body hair, gynecomastia, infertility, small testes, decreased verbal intelligence, and increased risks for autoimmune diseases (60). Features of Triple-X syndrome include tall stature, epicanthal folds, hypotonia, clinodactyly, seizures, renal and genitourinary abnormalities, premature ovarian failure, motor and speech delays, and increased risks of cognitive deficits and learning
disabilities (59). Turner syndrome is characterized by short stature, premature ovarian failure, and a variety of anatomic abnormalities, including webbing of the neck, lymphedema, aortic coarctation, autoimmune diseases, and characteristic neurocognitive deficits (impaired visual-spatial and
[image:4.585.68.262.48.243.2]visual-per-ceptual abilities, motor function, nonverbal memory, executive function and attentional abilities; see ref. 63). Interestingly, some
Fig. 2. X expression and autosomal expression in large protein complexes versus others. For each tissue, we computed the ratio of the median of X gene expression of large complexes (≥7 proteins,n= 59) and the median of X gene expression of other protein complexes (<7 proteins,n= 52), which we called the XL/XOratio (red). Both categories have been defined from results presented in Fig. 1B. The ratio of the median of autosomal gene expression of large complexes (n= 696) and the median of autosomal gene expression of other protein complexes (n= 151)—the AL/AOratio (blue)—
was computed similarly. Error bars have been obtained by bootstrapping protein complexes and computing both ratios and represent 95% bootstrap confidence interval. We pooled the data for eight tissues (see text) and computed the median and confidence interval the same way. The two green dashed lines indicate expectations with a twofold increase of expression (ratio of 2) and without any change in expression (ratio of 1).
4 of 7 | www.pnas.org/cgi/doi/10.1073/pnas.1116763109 Pessia et al.
373 374 375 376 377 378 379 380 381 382 383 384 385 386 387 388 389 390 391 392 393 394 395 396 397 398 399 400 401 402 403 404 405 406 407 408 409 410 411 412 413 414 415 416 417 418 419 420 421 422 423 424 425 426 427 428 429 430 431 432 433 434
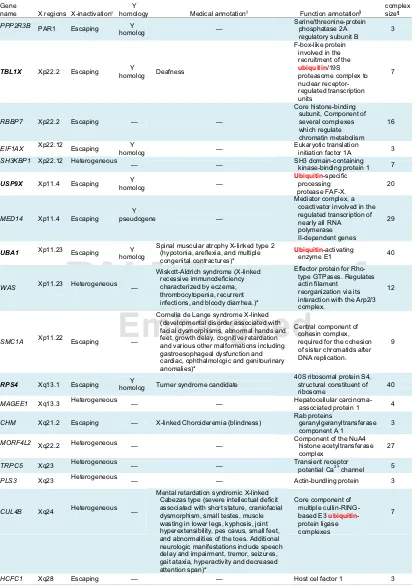
Table 1. List of candidate genes for X aneuploidy syndromes
Gene
name X regions X-inactivation† Medical annotation‡
Max complex size¶ — Deafness — — — — —
Spinal muscular atrophy X-linked type 2 (hypotonia, areflexia, and multiple congenital contractures)*
Cornelia de Lange syndrome X-linked (developmental disorder associated with facial dysmorphisms, abnormal hands and feet, growth delay, cognitive retardation and various other malformations including gastroesophageal dysfunction and cardiac, ophthalmologic and genitourinary anomalies)*
Turner syndrome candidate —
X-linked Choroideremia (blindness)
— — — PPP2R3B TBL1X RBBP7 EIF1AX SH3KBP1 USP9X MED14 UBA1 WAS SMC1A RPS4 MAGEE1 CHM MORF4L2 TRPC5 PLS3 CUL4B HCFC1 3 7 16 3 7 20 29 40 12 9 40 4 3 27 5 3 7 3 — PAR1 Xp22.2 Xp22.2 Xp22.12 Xp22.12 Xp11.4 Xp11.4 Xp11.23 Xp11.23 Xp11.22 Xq13.1 Xq13.3 Xq21.2 Xq22.2 Xq23 Xq23 Xq24 Xq28
Wiskott-Aldrich syndrome (X-linked recessive immunodeficiency characterized by eczema, thrombocytopenia, recurrent infections, and bloody diarrhea.)* Escaping Escaping Escaping Escaping Escaping Escaping Escaping Escaping Escaping Heterogeneous Escaping Heterogeneous Escaping Heterogeneous Heterogeneous Heterogeneous Heterogeneous Heterogeneous
Function annotation§
F-box-like protein involved in the recruitment of the
ubiquitin/19S proteasome complex to nuclear receptor-regulated transcription units
Eukaryotic translation initiation factor 1A SH3 domain-containing
kinase-binding protein 1
Ubiquitin-specific processing protease FAF-X.
Ubiquitin-activating enzyme E1
Central component of cohesin complex, required for the cohesion of sister chromatids after DNA replication.
Hepatocellular carcinoma-associated protein 1
Component of the NuA4 histone acetyltransferase complex
Transient receptor potential Ca2+ channel
Actin-bundling protein Core component of
multiple cullin-RING-based E3 ubiquitin -protein ligase complexes
Host cel factor 1 Core histone-binding
subunit, Component of several complexes which regulate chromatin metabolism
Mediator complex, a coactivator involved in the regulated transcription of nearly all RNA polymerase II-dependent genes
Effector protein for Rho-type GTPases. Regulates actin filament
reorganization via its interaction with the Arp2/3 complex.
Rab proteins component A 1 geranylgeranyltransferase Serine/threonine-protein
phosphatase 2A regulatory subunit B Y homology Y homolog Y homolog — Y homolog — Y Y Y homolog — — Y homolog — — — — — — — pseudogene homolog
Mental retardation syndromic X-linked Cabezas type (severe intellectual deficit associated with short stature, craniofacial dysmorphism, small testes, muscle wasting in lower legs, kyphosis, joint hyperextensibility, pes cavus, small feet, and abnormalities of the toes. Additional neurologic manifestations include speech delay and impairment, tremor, seizures, gait ataxia, hyperactivity and decreased attention span)*
40S ribosomal protein S4, structural constituent of ribosome
The best candidates (members of large complexes and with a Y homolog) are shown in bold. Ubiquitin-related genes are highlighted in
Q:20 blue.
†Escaping, gene always escaping X-inactivation; Heterogeneous, gene escaping X-inactivation in some cells (Materials and Methods). ‡Medical annotation is mainly from NextProt, the database on human proteins developed by Swissprot (http://www.nextprot.org/).
An asterisk denotes when the annotation shares keywords with Turner, Klinefelter, or Triple-X syndromes. §Function annotation is also from NextProt.
{Most of the genes are involved in several complexes in the list from HPRD (seeMaterials and Methods), only the size of the larger
complexes is indicated here.
[image:5.585.85.501.69.656.2]of the candidate genes have annotations reminiscent of these X aneuploidy features, although the syndromes are not explicitly cited. In addition, three of the four best candidates (in large complexes and with a Y homolog; in boldface in Table 1) are involved in the ubiquitin pathway, which relates to protein deg-radation and addressing in the cell. Ubiquitination occurs in a wide range of cellular processes, such as differentiation and de-velopment, immune response and inflammation, neural and
mus-cular degeneration, morphogenesis of neural networks, and ribosome biogenesis.
Conclusions
Our results open perspectives forfinding candidate genes for X
aneuploidy syndromes. Such syndromes are very common (up to 1 in 500 for Klinefelter) and, although the phenotypic con-sequences are mild and vary a lot among individuals, with some individuals being asymptomatic, many practicians call for effi
-cient diagnosis because many X aneuploidy individuals can ex-perience health, fertility, and cognitive difficulties if not treated
(59, 60, 63). Surprisingly for such common diseases, very little is known about the genotype-phenotype relationships. We suggest dosage-sensitive genes that escape XCI should be tested, for example in animal models (66), as they seem to be good candi-date genes for X aneuploidy syndromes.
Our results also show that Ohno’s idea of a two-step
dosage-compensation mechanism (twofold increase of X expression in both sexes plus an XCI in females) is valid for dosage-sensitive genes (i.e., protein-complex genes). How this two-step dosage-compensation mechanism evolved still needs to be understood. In Ohno’s logic, the doubling step should comefirst and then the
halving one (through XCI). However, we know that XCI is very old because theXistlocus is located within the earliest diverging segment of the sex chromosomes (stratum 1; see ref. 3) and XCI is found in both marsupials and placentals, which suggests XCI may have evolvedfirst. As the range of XCI silencing crept along
the chromosome, then X-linked dosage-sensitive genes (but not other genes) would have experienced selection for doubling of expression. However, in this case, the reason why XCI would evolvefirst is not clear. In marsupials and in some tissues
(pla-centa, brain) of some placentals, XCI always affects the paternal X (67–71). Some authors suggested that XCI may have originally
been a form of genomic imprinting related to parental conflicts
(72, 73). Further work is needed to distinguish these two alter-natives, but in any case, our work establishes the role of XCI in balancing expression between X and autosomal genes that are dosage-sensitive.
Materials and Methods
Expression Data.We used gene-expression levels obtained from RNA-Seq data
of 19,800 human genes (19,066 autosomal and 734 X) in 12 male and female tissues compiled by Xiong et al. (15). Sources of RNA-Seq data and methods are described in ref. 15 but, briefly, only reads uniquely mapped to exons were considered valid hits and expression level of a gene was defined by the number of valid hits to the gene divided by the effective length of the gene. For comparisons between tissues or developmental stages, expression levels
were normalized by dividing the total number of valid hits in the sample. Genes with effective length smaller than 100 were discarded, resulting in 19,800 genes.
We cross-linked ref. 15 and ref. 17 datasets using gene names (as no other identifier was available in the latter). We could keep 9,835 genes, which revealed that expression estimates from both studies are strongly correlated: lung (Spearmanρ= 0.87), adipose (ρ= 0.91), brain (ρ= 0.92), colon (ρ= 0.88), heart (ρ= 0.94), liver (ρ= 0.94), lymph node (ρ= 0.90), muscle (ρ= 0.94), testes (ρ= 0.85), kidney (ρ= 0.89), breast (ρ= 0.88); all with aPvalue<10–5.
Protein-Complex Data.We obtained a list of members of human protein
complex from HPRD release 9 (http://www.hprd.org). This list includes 1,521 annotated (and experimentally confirmed) protein complexes (74). Human genes and their chromosomal locations (X, autosomal) as described in Ensembl release 52 (http://www.ensembl.org) were assigned to the members of protein complexes using Ensembl IDs in HPRD. Using protein-complex IDs, we counted the number of the members for each complex to get the pro-tein-complex size. Members without any Ensembl gene IDs were excluded, as well as complexes including only X or autosomal genes. This process led to a dataset of 207 complexes with proteins from 235 X and 1,381 autosomal genes and 89 X and 800 autosomal unique genes, as some genes are in-volved in several complexes.
X-Inactivation Data.We used data on XCI from ref. 58. These data were
obtained constructing nine different rodent/human somatic cell hybrids that retained an inactivated human X. National Center for Biotechnology In-formation build 34.3 annotations of X genes was used to design primers to amplify mRNAs and quantify X-inactivation of human X genes (58). Using these data, we classified as“inactivated”the genes that were significantly expressed only in two cells or less, as“escaping”the ones for which at least seven cells with a significant expression was observed, and as“ heteroge-neous”all other genes.
We checked all of the primers by blasting them on the updated X chro-mosome sequence from Ensembl release 60 (www.biomart.org). From the original 634 genes studied by Carrel and Willard (58), only 495 had both primers that matched both opposite strands and were separated by less than 100 Kb on the Ensembl release 60 X chromosome sequence. In some cases, several genes fellin the interval amplified by the same pair of primers; 69Q:16 genes were concerned. We excluded pseudogenes and selected the same gene as in ref. 58 when possible, and picked a gene at random in the interval otherwise. We also checked if primers matched on human autosomal chro-mosomes or on mouse X chromosome. Five genes had both primers that matched on human autosomes (EIF2S3,TIMM8A,SEDL,DDX3X,GLUD1) and four genes on the mouse X chromosome (DUSP21,HNRPH2,PHF16,ABCB7), and all were withdrawn to avoid false-positives of the RT-PCR experiment. Wefinally obtained a list of 392 genes. Among these, 55 are escapees, 304 are X-inactivated, and 33 are heterogeneous.
Statistical Analysis.About 15% of X genes are known to escape XCI (58); we
did not exclude these genes from the dataset as in ref. 15. Details on analysis are found in thefigure legends. All statistical analyses were done using R.
ACKNOWLEDGMENTS. We thank Xionglei He and Jianzhi Zhang, and Di Nguyen and Christine Disteche for sharing with us the Xiong et al. (15) and Deng et al. (17) datasets, respectively; Judith Ross, Hugues Roest Crollius,Q:17 Erika Kvikstadt, Tristan Lefébure, and Susana Coelho for discussions; and two anonymous referees for their constructive comments. This study was supported by Agence Nationale de la Recherche Grant ANR-08-JCJC-0109 (to G.A.B.M.) and a Science Foundation Ireland grant (to A.M.).
1. Ohno S (1967)Sex Chromosomes and Sex Linked Genes(Springer, Berlin). 2. Graves JAM (1995) The origin and function of the mammalian Y chromosome and
Y-borne genes—An evolving understanding.Bioessays17:311–320.
3. Lahn BT, Page DC (1999) Four evolutionary strata on the human X chromosome.
Science286:964–967.
4. Potrzebowski L, et al. (2008) Chromosomal gene movements reflect the recent origin and biology of therian sex chromosomes.PLoS Biol6:e80.
5. Veyrunes F, et al. (2008) Bird-like sex chromosomes of platypus imply recent origin of mammal sex chromosomes.Genome Res18:965–973.
6. Ross MT, et al. (2005) The DNA sequence of the human X chromosome.Nature434: 325–337.
7. Lemaitre C, et al. (2009) Footprints of inversions at present and past pseudoautosomal boundaries in human sex chromosomes.Genome Biol Evol1:56–66.
8. Charlesworth B, Charlesworth D (2000) The degeneration of Y chromosomes.Philos Trans R Soc Lond B Biol Sci355:1563–1572.
9. Potrzebowski L, Vinckenbosch N, Kaessmann H (2010) The emergence of new genes on the young therian X.Trends Genet26:1–4.
10. Zhang YE, Vibranovski MD, Landback P, Marais GA, Long M (2010) Chromosomal redistribution of male-biased genes in mammalian evolution with two bursts of gene gain on the X chromosome.PLoS Biol8: pii, e1000494. Q:18 11. Lyon MF (1961) Gene action in the X-chromosome of the mouse (Mus musculusL.).
Nature190:372–373.
12. Nguyen DK, Disteche CM (2006) Dosage compensation of the active X chromosome in mammals.Nat Genet38:47–53.
13. Gupta V, et al. (2006) Global analysis of X-chromosome dosage compensation.J Biol5:3.
14. Lin H, et al. (2007) Dosage compensation in the mouse balances up-regulation and silencing of X-linked genes.PLoS Biol5:e326.
15. Xiong Y, et al. (2010) RNA sequencing shows no dosage compensation of the active X-chromosome.Nat Genet42:1043–1047.
6 of 7 | www.pnas.org/cgi/doi/10.1073/pnas.1116763109 Pessia et al.
16. Casci T (2011) What dosage compensation?Nat Rev Genet12:2.
17. Deng X, et al. (2011) Evidence for compensatory upregulation of expressed X-linked genes in mammals,Caenorhabditis elegansandDrosophila melanogaster.Nat Genet
43:1179–1185.
18. Castagné R, et al. (2011) The choice of thefiltering method in microarrays affects the inference regarding dosage compensation of the active X-chromosome.PLoS ONE6: e23956.
19. Kharchenko PV, Xi R, Park PJ (2011) Evidence for dosage compensation between the X chromosome and autosomes in mammals.Nat Genet43:1167–1169, author reply 1171–1172.
20. Lin H, et al. (2011) Relative overexpression of X-linked genes in mouse embryonic stem cells is consistent with Ohno’s hypothesis.Nat Genet43:1169–1170, author reply 1171–1172.
21. He X, et al. (2011)Nat Genet43:1171–1172
Q:19 .
22. Yildirim E, Sadreyev RI, Pinter SF, Lee JT (2011) X-chromosome hyperactivation in mammals via nonlinear relationships between chromatin states and transcription.Nat Struct Mol Biol19:56–61.
23. Itoh Y, et al. (2007) Dosage compensation is less effective in birds than in mammals.J Biol6(22):2.
24. Ellegren H, et al. (2007) Faced with inequality: Chicken do not have a general dosage compensation of sex-linked genes.BMC Biol5:40.
25. Itoh Y, et al. (2010) Sex bias and dosage compensation in the zebrafinch versus chicken genomes: General and specialized patterns among birds.Genome Res20: 512–518.
26. Wolf JB, Bryk J (2011) General lack of global dosage compensation in ZZ/ZW systems? Broadening the perspective with RNA-seq.BMC Genomics12:91.
27. Mank JE, Ellegren H (2009) All dosage compensation is local: Gene-by-gene regulation of sex-biased expression on the chicken Z chromosome.Heredity (Edinb)102:312–320. 28. McQueen HA, Clinton M (2009) Avian sex chromosomes: Dosage compensation
matters.Chromosome Res17:687–697.
29. Zha X, et al. (2009) Dosage analysis of Z chromosome genes using microarray in silkworm,Bombyx mori.Insect Biochem Mol Biol39:315–321.
30. Walters JR, Hardcastle TJ (2011) Getting a full dose? Reconsidering sex chromosome dosage compensation in the silkworm,Bombyx mori.Genome Biol Evol3:491–504. 31. Vicoso B, Bachtrog D (2011) Lack of global dosage compensation inSchistosoma
mansoni, a female-heterogametic parasite.Genome Biol Evol3:230–235. 32. Deakin JE, Hore TA, Koina E, Marshall Graves JA (2008) The status of dosage
com-pensation in the multiple X chromosomes of the platypus.PLoS Genet4:e1000140. 33. Deakin JE, Chaumeil J, Hore TA, Marshall Graves JA (2009) Unravelling the
evolu-tionary origins of X chromosome inactivation in mammals: Insights from marsupials and monotremes.Chromosome Res17:671–685.
34. Leder EH, et al. (2010) Female-biased expression on the X chromosome as a key step in sex chromosome evolution in threespine sticklebacks.Mol Biol Evol27:1495–1503. 35. Mank JE, Hosken DJ, Wedell N (2011) Some inconvenient truths about sex
chromo-some dosage compensation and the potential role of sexual conflict.Evolution65: 2133–2144.
36. Birchler JA, Newton KJ (1981) Modulation of protein levels in chromosomal dosage series of maize: The biochemical basis of aneuploid syndromes.Genetics99:247–266. 37. Papp B, Pál C, Hurst LD (2003) Dosage sensitivity and the evolution of gene families in
yeast.Nature424:194–197.
38. Edger PP, Pires JC (2009) Gene and genome duplications: The impact of dosage-sensitivity on the fate of nuclear genes.Chromosome Res17:699–717.
39. Birchler JA, Veitia RA (2010) The gene balance hypothesis: Implications for gene regulation, quantitative traits and evolution.New Phytol186:54–62.
40. Seoighe C, Gehring C (2004) Genome duplication led to highly selective expansion of theArabidopsis thalianaproteome.Trends Genet20:461–464.
41. Blanc G, Wolfe KH (2004) Functional divergence of duplicated genes formed by polyploidy duringArabidopsisevolution.Plant Cell16:1679–1691.
42. Freeling M, Thomas BC (2006) Gene-balanced duplications, like tetraploidy, provide predictable drive to increase morphological complexity.Genome Res16:805–814. 43. Aury JM, et al. (2006) Global trends of whole-genome duplications revealed by the
ciliateParamecium tetraurelia.Nature444:171–178.
44. Hakes L, Pinney JW, Lovell SC, Oliver SG, Robertson DL (2007) All duplicates are not equal: The difference between small-scale and genome duplication.Genome Biol8: R209.
45. Barker MS, et al. (2008) Multiple paleopolyploidizations during the evolution of the Compositae reveal parallel patterns of duplicate gene retention after millions of years.Mol Biol Evol25:2445–2455.
46. Davis JC, Petrov DA (2005) Do disparate mechanisms of duplication add similar genes to the genome?Trends Genet21:548–551.
47. Maere S, et al. (2005) Modeling gene and genome duplications in eukaryotes.Proc Natl Acad Sci USA102:5454–5459.
48. Liang H, Plazonic KR, Chen J, Li WH, Fernández A (2008) Protein under-wrapping causes dosage sensitivity and decreases gene duplicability.PLoS Genet4:e11. 49. Fernández A, Lynch M (2011) Non-adaptive origins of interactome complexity.Nature
474:502–505.
50. Makino T, McLysaght A (2010) Ohnologs in the human genome are dosage balanced and frequently associated with disease.Proc Natl Acad Sci USA107:9270–9274. 51. Kondrashov FA, Koonin EV (2004) A common framework for understanding the
ori-gin of genetic dominance and evolutionary fates of gene duplications.Trends Genet
20:287–290.
52. Gout JF, Kahn D, Duret L; Paramecium Post-Genomics Consortium (2010) The re-lationship among gene expression, the evolution of gene dosage, and the rate of protein evolution.PLoS Genet6:e1000944.
53. Wijchers PJ, et al. (2010) Sexual dimorphism in mammalian autosomal gene regula-tion is determined not only by Sry but by sex chromosome complement as well.Dev Cell19:477–484.
54. Monkhorst K, Jonkers I, Rentmeester E, Grosveld F, Gribnau J (2008) X inactivation counting and choice is a stochastic process: Evidence for involvement of an X-linked activator.Cell132:410–421.
55. Monkhorst K, et al. (2009) The probability to initiate X chromosome inactivation is determined by the X to autosomal ratio and X chromosome specific allelic properties.
PLoS ONE4:e5616.
56. Ferguson-Smith MA (1965) Karyotype-phenotype correlations in gonadal dysgenesis and their bearing on the pathogenesis of malformations.J Med Genet2:142–155. 57. Fisher EM, et al. (1990) Homologous ribosomal protein genes on the human X and Y
chromosomes: Escape from X inactivation and possible implications for Turner syn-drome.Cell63:1205–1218.
58. Carrel L, Willard HF (2005) X-inactivation profile reveals extensive variability in X-linked gene expression in females.Nature434:400–404.
59. Tartaglia NR, Howell S, Sutherland A, Wilson R, Wilson L (2010) A review of trisomy X (47,▪▪▪).Orphanet J Rare Dis5:8.
60. Tüttelmann F, Gromoll J (2010) Novel genetic aspects of Klinefelter’s syndrome.Mol Hum Reprod16:386–395.
61. Yang F, Babak T, Shendure J, Disteche CM (2010) Global survey of escape from X inactivation by RNA-sequencing in mouse.Genome Res20:614–622.
62. Blaschke RJ, Rappold G (2006) The pseudoautosomal regions, SHOX and disease.Curr Opin Genet Dev16:233–239.
63. Ross J, Roeltgen D, Zinn A (2006) Cognition and the sex chromosomes: Studies in Turner syndrome.Horm Res65:47–56.
64. Geerkens C, Just W, Held KR, Vogel W (1996) Ullrich-Turner syndrome is not caused by haploinsufficiency of RPS4X.Hum Genet97:39–44.
65. Park C, Carrel L, Makova KD (2010) Strong purifying selection at genes escaping X chromosome inactivation.Mol Biol Evol27:2446–2450.
66. Wistuba J (2010) Animal models for Klinefelter’s syndrome and their relevance for the clinic.Mol Hum Reprod16:375–385.
67. Heard E (2004) Recent advances in X-chromosome inactivation.Curr Opin Cell Biol16: 247–255.
68. Deakin JE, Chaumeil J, Hore TA, Marshall Graves JA (2009) Unravelling the evolu-tionary origins of X chromosome inactivation in mammals: Insights from marsupials and monotremes.Chromosome Res17:671–685.
69. Al Nadaf S, et al. (2010) Activity map of the tammar X chromosome shows that marsupial X inactivation is incomplete and escape is stochastic.Genome Biol11:R122. 70. Wang X, Soloway PD, Clark AG (2010) Paternally biased X inactivation in mouse
neonatal brain.Genome Biol11:R79.
71. Okamoto I, et al. (2011) Eutherian mammals use diverse strategies to initiate X-chromosome inactivation during development.Nature472:370–374.
72. Haig D (2006) Self-imposed silence: Parental antagonism and the evolution of X-chromosome inactivation.Evolution60:440–447.
73. Engelstädter J, Haig D (2008) Sexual antagonism and the evolution of X chromosome inactivation.Evolution62:2097–2104.
74. Keshava Prasad TS, et al. (2009) Human Protein Reference Database—2009 update.
Nucleic Acids Res37(Database issue):D767–D772.
Q: A_Your article exceeds the six-page limit. To resolve this, please delete the equivalent number of lines
that appear on any pages beyond the sixth page and do not add any text without deleting the
equivalent amount. You might also reduce the size of your figures, if possible, or consider moving
a portion of your Materials and Methods section, tables, and/or figures to Supporting Information
(SI). If you choose to move any content to SI, please update the in-text citations for these materials
appropriately. Please remember that authors are responsible for any additional charges incurred at
this stage, including but not limited to charges to delete, reduce, enlarge, or replace figures and
charges to add or lengthen SI.
Q: 1_Please contact PNAS_Specialist.djs@sheridan.com if you have questions about the editorial
changes, this list of queries, or the figures in your article. Please include your manuscript number in
the subject line of all e-mail correspondence; your manuscript number is 201116763. Please (i)
review the author affiliation and footnote symbols carefully, (ii) check the order of the author names,
and (iii) check the spelling of all author names and affiliations. Please indicate that the author and
affiliation lines are correct by adding the comment “OK” next to the author line. Please note that this
is your opportunity to correct errors in your article prior to publication. Corrections requested after
online publication will be considered and processed as errata.
Q: 2_Please review the short title you provided at submission and indicate any changes: Evolution of X
dosage compensation in humans. Please note that short titles are limited to 50 characters.
Q: 3_If your article contains links to Web sites (other than the SI links for your article), please verify that
the links are valid and will direct readers to the proper Web page.
Q: 4_Author names may have been edited to match those provided during article submission; please check
carefully and note your approval in the margin. (Your article cannot be published until your approval
has been received.)
Q: 5_Please provide a departmental affiliation for affiliation "d" and verify the postal code for “c” (Dublin
2 correct?).
Q: 6_Ohno is cited in the abstract and thus the reference has been added per style from ref. 1. Please amend
or confirm.
Q: 7_PNAS italicizes the names of genes and alleles. Please check throughout the manuscript and correct
as necessary. If, by “XXX gene,” you mean “the gene that encodes protein XXX,” then italic type is
not necessary. (Note: If all instances of a gene/allele name should be changed, please make only
one correction and simply indicate that it should be made throughout the paper.)
Q: 8_All key terms have been deleted because they repeated terms present in the title or abstract (which are
searchable online). Please provide up to 5 new key terms that (i) do not repeat terms present in the
TITLE OR ABSTRACT and (ii) do not include nonstandard abbreviations. Because we prefer to
AUTHOR QUERIES
avoid publishing a single key term, please add at least two terms (and specify your preferred order
in which the terms should appear) if you add any terms.
Q: 9_Please review the information in the author contribution footnote carefully. Please make sure that the
information is correct and that the correct author initials are listed. Note that the order of author
initials matches the order of the author line per journal style. You may add contributions to the list in
the footnote; however, funding should not be an author’s only contribution to the work.
Q: 10_You will receive a notification from the PNAS eBill system in 1-2 days. Each corresponding author
is required to log in to the system and provide payment information for applicable publication
charges (purchase order number or credit card information) upon receipt of the notification. You
will have the opportunity to order reprints through the eBill system if desired, as well. Failure to log
in and provide the required information may result in publication delays.
Q: 11_Reminder: You have chosen not to pay an additional $1300 (or $975 if your institution has a site
license) for the PNAS Open Access option.
Q: 12_Quotation marks are used at the first appearance of a word or phrase; they do not appear with each
subsequent use of that word or phrase. See "balance hypothesis."
Q: 13_It has been assumed that the reference to "Deng et al. (2011)" is ref. 17. Please check and correct as
needed.
Q: 14_Please check the callout for "figure S1 in ref. 17" in the sentence beginning "However, many tissues
. . .
" Should this be cited as "supplemental figure 1" instead? Please check the journal style for ref.
17 and amend as necessary.
Q: 15_Please verify that all supporting information (SI) citations are correct. Note, however, that the
hyperlinks for SI citations will not work until the article is published online. In addition, SI that is
not composed in the main SI PDF (appendices, datasets, movies, and “Other Supporting
Information Files”) have not been changed from your originally submitted file and so are not
included in this set of proofs. The proofs for any composed portion of your SI are included in this
proof as subsequent pages following the last page of the main text. If you did not receive the
proofs for your SI, please contact PNAS_Specialist.djs@Sheridan.com.
Q: 16_Does edit preserve your intent? Please check the sentence beginning "In some cases, several genes
. . .
"
Q: 17_Please verify refs. 15 and 17 as added in the place of the years for both datasets or amend as needed.
Both datasets should be cited as references and added to the reference list if not already listed.
Q: 18_Please verify the page range in ref. 10.
Q: 19_Please provide an article title for ref. 21.
AUTHOR QUERIES
Q: 20_Please verify that the blue highlighted rows are the ubiquitin-related genes and clarify what the red
"ubiquitin" signifies in the Function column by defining red text in the table legend. If the blue rows
are not the intended "highlight," please clarify what the blue signifies or remove it from the table and
amend the table legend to clarify your intent.
AUTHOR QUERIES
Supporting Information
[image:11.585.94.491.124.332.2]Pessia et al. 10.1073/pnas.1116763109
Fig. S1. Protein-complex analysis without nonexpressed genes. (A) See Fig. 1Blegend. (B) See Fig. 2 legend. Thisfigure was prepared excluding non-expressed genes.
Fig. S2. X/A expression ratio excluding nonexpressed or poorly expressed genes. We show the X/A expression ratio computed as in Fig. 1Ausing pooled expression data for different thresholds for minimum expression levels (from 0≥0.3) using Xiong et al.’s (1) expression data. For each threshold, we show the number of remaining X genes and the percentage of large-complex and other-complex genes (as defined in Fig. 2). The two green dashed lines indicate expectations with dosage compensation (X/A = 1) and without dosage compensation (X/A = 0.5).
Q:1
1. Xiong Y, et al. (2010) RNA sequencing shows no dosage compensation of the active X-chromosome.Nat Genet42:1043–1047. 1
2 3 4 5 6 7 8 9 10 11 12 13 14 15 16 17 18 19 20 21 22 23 24 25 26 27 28 29 30 31 32 33 34 35 36 37 38 39 40 41 42 43 44 45 46 47 48 49 50 51 52 53 54 55 56 57 58 59 60 61 62
[image:11.585.56.534.128.598.2]