LOD Human Representations: A Comparative Study
Rachel McDonnell, Simon Dobbyn, Carol O’Sullivan
Image Synthesis Group
Trinity College Dublin, Dublin 2, Ireland
Telephone: +353 1 608 1220, Fax: +353 1 677 2204
[image:1.595.75.501.293.416.2]E-mail: [email protected], [email protected], [email protected]
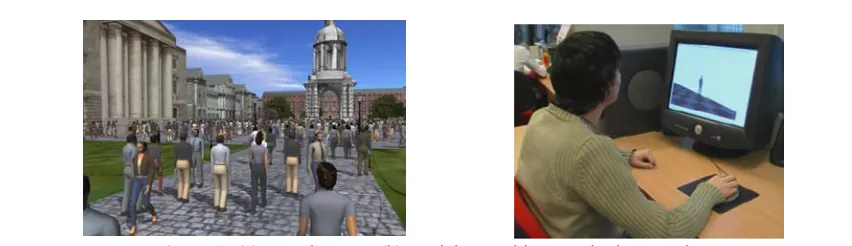
Figure 1: (a) crowd system (b) participant taking part in the experiments Abstract
Real-time crowd systems are increasing in popularity and importance. With this comes the need for accurate low level of detail (LOD) human model representations. Currently, the two most commonly used representations for large scale crowds are image based representations and low level geometric meshes. In this paper, we evaluate the effectiveness of the two representations in terms of their appearance and how accurately they convey motion. We show that low resolution geometry is not equivalent to image based representations at replicating the motion of high resolution geometry. We also report the distances from the camera at which impostors and different simplified meshes are perceptually equivalent to high resolution geometry.
Keywords
Perception, evaluation, LOD, impostors.
1.
Introduction
resolution polygon meshes are the two most commonly used substitutes at present. In previous work [1], we showed that impostors are an effective substitute for high resolution meshes when displayed at certain distances from the camera. We now compare the relative effectiveness of the low resolution mesh. We address the questions: Are low resolution meshes and impostors equally effective at replicating the motion of a high resolution mesh? How much can you decrease the resolution of a mesh by, while still having it perceptually equivalent to the high resolution mesh, and at what distance from the camera? How does this compare to the distance at which you can notice an impostor and is it as cost effective in terms of rendering?
In our research, we use the scientific discipline of Psychophysics to explore the relationship between physical stimuli and subjective responses so that we can investigate the effect of model representation on perception with regards to motion and appearance. We present a study that analyzes people’s ability to perceive variation in motion when using different representations. We also perform a series of perceptual experiments to investigate human sensitivity to different model representations based on their appearance.
2.
Background
Previous work on real-time crowd systems was focused on developing the most efficient ways of displaying large crowds. Tecchia et al. [2] populated an environment with thousands of animated characters at run-time using pre-generated impostors. Aubel et al. [3] showed how dynamic impostors can be used to render virtual humans. De Heras Ciechomski et al. [4] designed a real-time virtual audience for a virtual heritage reconstruction. They chose low level geometry meshes rather than impostors to populate their environment, as they felt that the viewer would be too close to the virtual audience to use impostors, who can look pixillated at close distances. In [5] we presented a LOD rendering system for crowds, where seamless interchanges between pre-generated impostors and geometry model representations were implemented in order to balance visual quality and performance (Figure 1a).
buildings and dynamic virtual humans, and investigated their impact on the perception of human motion. We found that impostors were an effective substitute for detailed geometry in the targeted application area (i.e., large-scale simulations inhabited by crowds).
In this paper, we extend the virtual human representation evaluation of our previous study with a broader study of different LODs for crowds in order to improve the realism of our crowd system, while maintaining interactive frame rates. We also aim to establish an effective experimental procedure to evaluate human representations that can be used by developers of other crowd systems.
We used Psychophysics to explore the connection between physical stimuli and subjective responses [13]. In a typical psychophysical experiment, subjects are asked to compare various stimuli to a reference stimulus and report if they thought that they were the “same” or “different”. A statistical curve called a Psychometric Function is fitted to the cumulative responses of the experiment to provide a way of analysis. A simple Ogive inverse normal distribution can be fitted to evenly distributed stimulus data, while a logistical function such as that described by Linschoten et al. [14] can be fitted to experimental data where the probability of detection of a stimulus falls below a chance detection level.
The Point of Subjective Equality (PSE) and the Just Noticeable Difference (JND) are two typical values that can be estimated from the fitted curve. The PSE is the threshold at which participants are able to tell two stimuli apart. This is typically estimated as the 50% detection level on the best fit psychometric curve (i.e., the point where same and different responses are equally likely). The JND is the smallest difference in intensity required for a person to distinguish 2 stimuli. The JND is typically estimated as the amount of additional stimulus needed to increase a participant’s detection rate from 50% to 75% on the fitted psychometric function. It is a measure of the participant’s uncertainty; the larger the value of the JND, the more uncertain they were in making their choices. The steeper the function, the smaller the JND. ANalysis of Variance (ANOVA) is used to test the null hypothesis that two means are equal. The null hypothesis is rejected if there are significant differences between the means.
3.
Perception of Human Motion
In a LOD crowd system that simultaneously displays different model representations, as described in [5], it is important that the quality of the motion of the lower LODs is not significantly different from that of the high resolution. As discussed in Section 2, Hodgins et al. [12] showed that model type affected user perception of human motion, when a stick figure model’s motion was compared to a polygonal model. We found in Hamill et al. [1] that the motion of the impostor accurately replicated the motion of the high resolution model. We now test whether or not the low resolution polygon mesh replicates the motion of the high resolution mesh as accurately as the impostor, using the same psychophysical procedure. We also test the performance of a stick figure model to compare our results to those of Hodgins et al. [12] and a point light source model as a baseline test.
3.1.
Model Types
resolution model. The modifier allows one to manually maintain part of the mesh at full resolution while reducing the LOD of the rest. Initially, we chose this option in order to keep a high number of polygons around the areas that would be deformed most by the joints. However, this manual selection is only necessary when simplifying meshes to very low resolutions, so we used automatic simplification. We automatically simplified the mesh as much as possible, without making the simplified version look different from the original, resulting in a mesh of 40% of the number of vertices of the original.
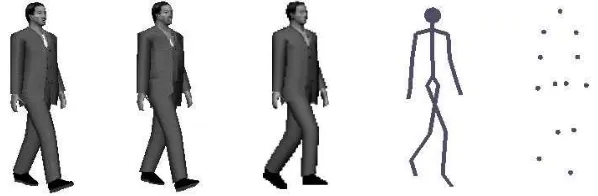
Figure 2: High resolution, low resolution, impostor, stick figure, point light source model
Impostors were the third type used and were created by mapping an image of the 3D object onto a quadrilateral and orientating this quadrilateral towards the viewer. As in Hamill et al. [1], a pre-generated impostor approach was used, which involved the offline rendering of the human model’s high resolution polygonal model from 17*8 different viewpoints around the model for 10 animation keyframes. All geometric and impostor representations were dynamically lit in the experiments. A stick figure was the next type and was created by drawing lines between the joints of the underlying skeleton. This representation was used in order to compare our findings with those of Hodgins et al. [12]. Studies have shown that 13 moving light points, attached to the joints of the body, suffice to create a rich perception of a moving human figure [15]. Using only 13 dots to display a human is the simplest representation and it is also the least computationally expensive of the 5 models, so we included this representation as the lowest LOD.
3.2.
Method and Participants
We used a between-groups design for this experiment, where each group viewed a different model representation. This approach was chosen as we felt that, if allowed to view all of the models, the participants might base their judgments on characteristics of the models rather than the actual differences in motion, e.g., the impostor images contain artefacts along the edges which may cause the participant to focus on the artefacts instead of the overall motion if they had already seen the geometric model which showed less artefacts.
3.3.
Creating the Motion Variation
A reference motion R was created which consisted of 10 frames of a key-framed walk motion. This motion was cyclic and was repeatedly looped until 4 seconds of animation were recorded. The 10 frames of R were modified a number of times to create the arm, leg, and torso motion variation sequences. The arm and the torso variations were chosen as they were also used by Hodgins et al. [12].
Figure 3: 10 frames of animation of the reference motion R. kA1 is the frame highlighted on the left, kA2 is the frame highlighted on the right.
Firstly, the performance of the participants in distinguishing smaller and larger dynamic arm motions was examined. Assessing the arm motion variation involved comparing R to a set of motions which altered the distance of the arm from the body at certain keyframes. kA1 and
kA2 were the keyframes in R where the arms were furthest away from the body (Figure 3).
kA1 and kA2 were modified by a fixed amount 10 times, and the resulting 10 motions represented the 10 different steps in the staircase analysis. The modifications were made by rotating the upper left arm joint in kAl at the shoulder along the positive horizontal axis by a fixed number of degrees. The right arm was altered by the same amount in the reverse direction. The pose of the skeleton at kA1 was then copied and the inverse pose was pasted onto the skeleton at kA2.
The 10 altered biped motion sequences were then exported and loaded into an OpenGL rendering system and applied to our high and low resolution models with deformable meshes. The stick figure and point light source models were also rendered using these motion sequences. All of the altered motions were cyclic and looped until 4-second movies could be recorded. Forty of these movies were recorded (10 for each model type). The 10 impostor sequences were then rendered from the high resolution polygon model and recorded as movies.
A similar test was conducted to test the ability of the participants in distinguishing larger and smaller leg motions for all representations. A further set of 50 motion sequence movies was created in a similar manner to the arm motions, except that the leg was altered by iterative translations along the longitudinal and vertical axes.
Finally, the ability of the participants to distinguish modifications to the torso was tested. A further 50 movies were created by making kinematic alterations to R. In this instance, the alterations were made by iteratively rotating the lower spine of the skeleton by a fixed number of degrees around the longitudinal axis.
3.4.
Experiment Procedure
decide whether they thought that the motions were the same or different and press the corresponding on-screen button. Five groups of 13 participants took part, with each group seeing a different model representation.
Experimental data can be gathered efficiently using a staircase procedure [16, 17]. This is a method whereby a stimulus is alternately increased and decreased until it passes a participant’s detection level. The reader is referred to [1] for detailed descriptions of the experimental procedures employed. This experiment consisted of 3 ascending staircases and 3 descending staircases randomly interleaved, i.e., an ascending and descending staircase for each of the motion variation types. The ascending staircases began with a comparison of the reference motion R to itself, and the descending staircases began with a comparison of R with the most exaggerated motion sequence (i.e., step 10 of the staircase). For the ascending staircases, a simple up-down staircase was employed so that, for every correct response, 2 steps were added to the current step, and for every incorrect response, 1 step was subtracted from the current step. A reversal occurred when the participant made a different decision on the comparison from the decision they made about the previous comparison. We adapted the step-size after the first reversal so that only 1 step was added or subtracted. We felt that this refinement would keep the comparisons occurring in the area of interest i.e., close to the point at which they began to distinguish the differences in motion. Once the refinement to the step-size was made, the procedure was continued until 8 reversals were recorded. For the descending staircases, the same procedure was employed, but with the steps decreasing in the opposite direction. Staircases were randomly interleaved, and participants were randomly shown either R or the motion sequence at the current step-size. This gave a 50% detection threshold which is used to estimate the PSE.
3.5.
Joint Weighting
The animations were created by altering certain joints by discrete amounts, but it was not immediately obvious how to compare the changes made to the arms with those of the legs or torso. Originally we used steps 0-10 for the arm, leg, and torso step-sizes. This scale told us nothing about the actual differences in motion, e.g., the arm moved only a small amount between steps whereas the legs moved a much larger amount. In order to be able to compare the performance of the different models used for rendering across all motion variation types, a scheme was needed to scale the variations and consequently the step-sizes. This involved finding a distance metric to compute the actual amount of motion change made at each step for the arm, leg and torso animations.
We took the approach of comparing the pose of the skeleton at the keyframe with the most exaggerated pose between two steps of the motion variation. The distance metric described in [7] was used to compute the difference between the 2 frames of animation. This distance metric sums the weighted differences of joint orientations and velocities.
For the arm animations, we computed the distance metric between the most exaggerated arm pose of the skeleton at step θi, 0 ≤ i ≤ 10, and the corresponding pose at step θi+1 . Similarly for the leg and torso motion, we chose the most exaggerated animation keyframe at step θi and compared it to the corresponding frame in step θi+1.
in an attempt to capture this observed change. We approximated the importance of the joints based on their projected pixel area. This area was computed by counting the number of pixels for each joint of the skeleton that was applied to all of the models at the appropriate camera angle and pose. The distance metric was computed for arm variation, leg variation and torso variation, and was used to scale the step-sizes of the experiments. It was found that the distance of the arm variations was (dA = 0.049), the torso (dT = 0.483) and the leg (dL = 1). The steps for the arm were then set to dA, 2dA, 3dA up to 10dA, and similarly for the leg and torso variations.
3.6.
Results
For each participant, the number of times that they viewed a pair of motions at each stimulus level was recorded, along with the number of correct responses that they gave at that level. The percentages of correct responses were then plotted against the stimulus level values. The data for the ascending and descending staircases were combined, and a separate curve was created for each motion variation type for each participant. Psychometric curves were then fitted to the datasets and, for each participant, a PSE and JND were calculated from these curves. The PSE was the stimulus level value at the 50% detection level. The JND was then found by calculating the difference between the PSE and the stimulus level value that corresponded to 75% correct responses on the psychometric curve.
Firstly, we will look at the performance for the model types over the whole dataset in order to get an overall picture. We will then look in more detail at the results for each of the motion variation types in the hope of gaining further insights. A two-factor ANOVA with replication was performed on the full dataset by collapsing all the recorded JND and PSE values over model type.
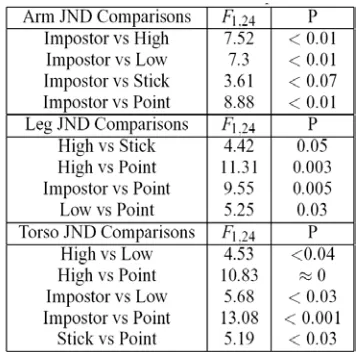
Results showed no significant differences between the mean PSE values of the participants when viewing different model types (Figure 4a). This implied that the point at which people could notice differences in motion was the same for all model types. However, this measure gave no indication of their uncertainty. Similarly, an ANOVA was used to compare mean JND values across all of the participants and showed that there was a significant difference in their sensitivities with respect to the changes viewed (Table 1). The significances for the differences between model types indicate that the motion of the impostor was closer to that of the high resolution polygon model than that of the low resolution model (Figure 5a).
We suggest that this is due to the fact that, even though the impostor appears perceptually different to the high resolution model at the distance shown in the experiments, it replicated the motion of the high resolution model accurately. The low resolution model may not replicate this motion as effectively because there are fewer vertices on the mesh, and even though it is the same skeleton used to deform this mesh, the deformation loses subtle motion information. As expected, the perception of the lowest LOD model (the point light source model) was furthest from the high resolution model. The stick figure was a closer match, as it retained the links between the joints of the skeleton.
each level took approximately 1 hour to compute with a further 30 minutes of manual cleanup to recapture lost viewpoints in frames. As discussed previously, the results for the mean JND values of the full dataset highlighted a trend where the performance for the high resolution and the impostor were most similar, with the stick figure and the low resolution at the next level and the point light source model eliciting the worst scores. This same trend can be seen with the JND values for the Leg motion variation, indicating that the participants found it most difficult to notice changes in the leg motion on the lowest LOD model.
[image:8.595.69.523.295.391.2]Figure 4: (a) Mean PSE values for all motion variations collapsed over model type, (b) Mean PSE values for arm motion variation, (c) Mean PSE values for torso motion variation, (d) Mean PSE values for leg motion variation. The vertical axis shows differences in motion as estimated in Section 3.5.
[image:8.595.74.300.436.677.2]Figure 5: (a) Mean JND values for all motion variations collapsed over model type, (b) Mean JND values for arm motion variation, (c) Mean JND values for torso motion variation, (d) Mean JND values for leg motion variation.
Table 1: ANOVA results of mean JND comparisons for model types where Fcrit = 4
Table 3:ANOVA results of mean JND comparisons,
Fcrit = 4.3
Table 2:ANOVA results of mean PSE comparisons, Fcrit = 4.3
[image:8.595.141.493.446.672.2] [image:8.595.325.504.464.640.2]model than any other model representation. We attribute this to the fact that the torso motion is the motion which moves the most number of bones of the skeleton, and as the low resolution model had fewer vertices to move than the high resolution model, the resulting poor deformation had an effect on the perception of the motion.
4.
Perception of Human Appearance
The main aim of this second set of experiments is to establish if and when various virtual human representations are perceptually equivalent. This is especially important in LOD crowd systems displaying different representations simultaneously. Using a psychophysical approach, we attempt to derive a perceptual metric to aid in deciding when to use a particular representation based on the appearance.
4.1.
Model Types
In these experiments, a female model was used. For its most detailed representation, we used a deformable mesh that was controlled by the motion of its underlying skeleton. The mesh consisted of 2170 polygons, and was also used to generate the two forms of less detailed representations in these experiments: low resolution mesh [4] and impostor [5]. For these experiments, automatic simplification required manual intervention to keep the integrity of the very low resolution meshes. Otherwise, using automatic simplification would result in losing important vertices needed to maintain the appearance of such models under motion, and subsequently bias the experimental results. Using the 3D Studio MAX multires modifier, nineteen low resolution meshes were generated in this manner, ranging from a reduced vertex percentage of 60% to 15% (1258 polygons to 298 polygons) at intervals of 2.5%.
Impostors were used as the third model type, and they constitute the least computationally expensive of the three human-like representations while retaining much of the visual richness of the high resolution polygon model through dynamic relighting. Impostors were generated in the same manner as in Section 3.1.
4.2.
Experiment 1: Impostor Experiment
Methods and Participants
Thirty-eight participants (13 females, 25 males, aged between 17 and 35) took part in the first experiment, drawn from various educational backgrounds. All participants were naive as to the purpose of the experiment and had normal or corrected to normal vision, and were rewarded with book tokens. Since we wanted the participants to discriminate representations based on detail, all models were displayed in grey-scale as it was felt that colour would introduce distracting factors. The experiment was displayed on a 21 inch flat screen C.R.T. monitor. Lighting and rendering conditions were constant throughout the experiment. Due to the performance hit caused by implementing anti-aliasing on detailed environments populated by large crowds, it is disabled in our system. To match the rendering conditions of our experiments with those of our system, we disabled anti-aliasing in our experiments, so that the results could be of practical use.
Experiment Procedure
The experiment consisted of an ascending and descending staircase randomly interleaved, where the participants were shown the virtual human’s geometric and impostor representations at different distances for 5 seconds. Each representation was animated with a 1-second cyclical walk animation. A 2 Alternative Forced Choice (2AFC) paradigm was employed, whereby the participants were asked to indicate on which side the virtual human “looked better” by pressing the corresponding trigger button on a USB gamepad. The response was considered correct if the participants had chosen the mesh representation, and incorrect for the impostor. For both staircases, a Three-Up, One-Down (3U-1D) stepping procedure was employed i.e., each time the participant indicated 3 consecutive correct responses, the distance at which the representations were displayed was increased by the step-size, otherwise one incorrect response caused the distance to decrease by the step-size. Each staircase ran for twelve reversals i.e., each time the participant’s response changed from 3 consecutive correct responses to incorrect and vice versa. An adaptive step-size was used during the course of the experiment where the initial step-size was halved for the first four reversals of each staircase. Data from previous work [1] and preliminary observations were used for setting the appropriate range of distances at which to display the virtual human’s representations. The ascending staircase began with the representations displayed at the furthest stimulus distance of 29 virtual world units corresponding to approximately 9 cm of vertical screen-space. One virtual world unit represents 1 meter in the real world. The descending staircase started at the closest distance of 9 units, corresponding to approximately 3cm of screen-space. The initial step-size was set to 4 units, and after the first four reversals the final step-size was 0.25 units. Since applications containing virtual humans would typically involve displaying them from multiple viewpoints, both representations were rotated at 5.625 degrees every 100 milliseconds in a randomised direction around the y-axis, so that the participant was not comparing the representations based on a single viewpoint. To keep the distance between the representations constant, they were separated with a fixed number of screen pixels.
Experiment Results
the ascending and descending staircase. If they did not overlap, then the participant’s data was considered to be diverging and therefore unusable.
The data converged for 16 out of the 38 participants. The large amount of diverging data is thought to be a result of a flaw related to using a 2AFC task, whereby a series of lucky guesses at low stimulus levels, e.g., when the representations are far away from the viewer, can erroneously drive the staircase to levels that are too low [13]. On further analysis of this diverging data, it was discovered that the ascending staircases were not able to recover from a string of lucky guesses. However, it was found that, for the majority of the descending staircases, the minimum and maximum distances of the last 4 reversals overlapped with the results of both staircases for the converging data.
For converging data, we first calculated the distance at which the representations were displayed in terms of the pixel to texel ratio [5]. We then calculated the percentage of correct responses for each ratio at which the representations were displayed, and plotted this as a function of the ratio. In this experiment we used a logistical function to fit a curve to the converging dataset and subsequently calculated the PSE and JND for each participant. The mean PSE and JND for the 16 participants were 1.164 ± 0.064 and 0.1 ± 0.01 respectively. At this PSE level, the participant will judge the representations with equal likelihood as “looking better”. The mean PSE is close to the hypothesized value of 1, and this result represents an improvement of the reported value of 1.4 in [1]. This change in result is attributable to learning from the previous study’s experiment data and adapting the psychophysical procedure accordingly.
4.3.
Experiment 2: Low Resolution Experiment
A common LOD approach for reducing the computational cost associated with rendering a high detailed mesh is to replace it with a simpler, lower resolution mesh containing fewer triangles where the loss of detail should be imperceptible to the viewer of the system. However, care has to be taken when generating these low resolution meshes, as removing too much detail can produce blocky shaped results, along with animation artefacts due to the loss of joint vertices, and the overall visual realism of the virtual human is reduced. The second experiment was aimed at establishing the resolution, in terms of percentage of vertices, at which participants were able to discriminate between a virtual human’s high resolution mesh and nineteen simplified low resolution meshes for 3 different distances. Eighteen participants (5 females, 13 males, aged between 17 and 28) took part in the second experiment. All other conditions were as before.
Experiment Procedure
observations were used for setting the appropriate range of resolutions for the low LOD mesh. The ascending staircase began with the low LOD mesh displayed at the highest resolution of 60%, and the descending staircase started with the low LOD mesh displayed at the lowest resolution of 15%. The initial resolution step-size was set to 5%, and after the first reversal the final step-size was 2.5%. As mentioned previously, 3 distances at which to display the representations from the viewer were chosen. The first distance was 5 units, and the other 2 distances were calculated based on a percentage of the representation’s initial screen-space size at the first distance. The second distance was 8 units and the third distance was 16 units, which corresponded to 66.6% and 33.3% of the representation’s initial screen space size. As in the impostor experiment, the distance between the representations was kept to a fixed number of screen pixels and both representations were rotated by 5.625 degrees every 100 milliseconds in a randomized direction around the y-axis.
Experiment Results
For each staircase, we recorded the participant’s response for each mesh resolution displayed, as well as the resolution at which the 12 reversals occurred. We eliminated any diverging data using the same method as previously. Out of the 18 participants, 16 converged for the first distance, 13 converged for the second distance and finally 12 converged for the third distance. For each participant whose data converged, for each distance, we calculated the percentage of correct responses for each resolution at which the representations were displayed, and plotted this as a function of the resolution. For this experiment, we used an Ogive to fit a curve to the dataset and subsequently calculated each participant’s JND and PSE. The mean PSE and JND for each distance were calculated and the corresponding number of vertices and polygons are shown in Table 4. An ANOVA comparing the mean PSE between each distance over 12 participants revealed a statistical significance in the PSE (F1,22 < Fcrit where p ≈ 0.0 for all 3 comparisons). This difference shows that distance affected perception of the low resolution mesh’s visual appearance, with participants being able to discriminate better between different resolution meshes at closer distances. There was no significant difference between the mean JND values, which indicates that the same amount of stimulus change had to be added to the stimulus level at each distance in order for the participant to notice a difference. It is interesting to note that people were equally sensitive to the amount of vertex percentage difference, irrespective of distance.
From the perception of human appearance experiments, we found that at the closest distance, a low resolution mesh generated at 36.4% is perceptually equivalent to the high resolution model. This suggests that we are using a mesh that is too detailed for the highest LOD in our crowd system, and a less detailed model could be used without the user noticing, while improving the system's performance.
Figure 6: a. Illustration of the distances at which different LOD representations are perceptually equivalent to the highest resolution mesh using results from section 4, b. graph of results from section 4.
Table 4:Mean PSE and JND for Low Resolution Geometry
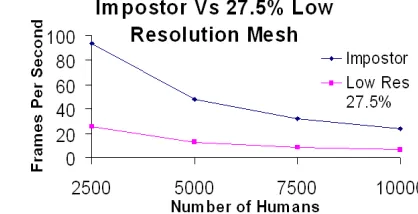
Figure 7: Average rendering cost for one human using an impostor and low resolution mesh models
5.
Conclusions and Future Work
[image:13.595.69.316.270.342.2]Table 5:Comparison of advantages and disadvantages of the 2 different low LOD representations
IMPOSTOR LOW RESOLUTION GEOMETRY
+ - + - Can appear visually
equivalent to high resolution meshes
Limited to animation used in pre-generated
sequences
Can appear visually equivalent to high
resolution meshes High rendering cost
Small rendering cost Large texture memory consumption Possible to have different animations
Doesn’t replicate the motion of the high resolution geometry well Replicates motion well consumption minimal Texture memory
We are currently altering our system to include low LOD geometry meshes along with the impostors and high LOD meshes. By displaying low LOD meshes at the reported distances, we expect see a substantial increase in frame rate, particularly since we found that even at the closest distance, a much less detailed mesh was considered perceptually equivalent to the mesh that we are currently using as our most detailed mesh.
Future work will include performing the experiments with a crowd of virtual humans in the scene; we expect that participants would find it more difficult to discriminate representations, or to judge motion, when there is more happening in the scene. We are also interested in the effect of perception of LOD in crowds when the user is being asked to perform a task while viewing the scene, as previous research by Cater et al. [18] has shown that humans fail to notice degradations in image quality in parts of the scene unrelated to their assigned task. All of the models in these experiments were displayed in grey-scale, but replicating these experiments using colour models to see if this factor affects the results would be very interesting. Also, a male model was used for the experiments in Section 3, and a female model for the experiments in Section 4. We are currently investigating how model type affects motion perception, by running the motion experiments on a female model. When considering the results of all of the experiments, an interesting observation can be made. When choosing a simplification level for our low level representation of our male model in Section 3, we picked a model of 40% of the original, as we felt that it looked the same as the original. In Section 4, it was found that the female model of 36.4% was considered perceptually equivalent to the high resolution mesh at approximately the same distance as our other experiments. So, even though it was a different model used, the resolution was very similar, which suggests that the values reported might hold across all models, but further experimentation would be needed to validate this informal observation.
The generation of low resolution meshes was a time-consuming process, involving manual intervention in order to retain the integrity of the model. Future work will investigate how our results could be used to create an automatic simplification method like QSLIM [19] for virtual human meshes, in order to facilitate the generation of perceptually equivalent low resolution meshes.
Acknowledgements
We would like to thank IRCSET, IITAC and HEA who sponsor this research.
References
2. Tecchia, F., Loscos, C., and Chrysanthou, Y. Visualizing crowds in real-time. Computer Graphics Forum 21, 4, p.p. 753-765, 2002.
3. Aubel, A., Boulic, R., and Thalmann, D. Real-time display of virtual humans: Levels of details and impostors. IEEE Transactions on Circuits and Systems for Video Technology 10, 2, p.p. 207-217, 2000.
4. De Heras Ciechomski, P., Ulicny, B., Cetre, R., and Thalmann, D. A case study of a virtual audience in a reconstruction of an ancient roman odeon in Aphrodisias. The 5th International Symposium on Virtual Reality, Archaeology and Cultural Heirtage (VAST), ChrysanthouY., Cain K., Silberman N., Niccolucci F., Eds., EurographicsAssociation, p.p. 9–17, 2004
5. Dobbyn, S., Hamill, J., O’Conor, K., and O’Sullivan, C. Geopostors: a real-time geometry / impostor crowd rendering system. In Proceedings of ACM Siggraph Symposium on Interactive 3D Graphics and Games, April 2005, p.p. 95-102, 2005 6. Wang, J., and Bodenheimer, B. An evaluation of a cost metric for selecting
transitions between motion segments. Proceedings of the 2003 ACM SIGGRAPH/Eurographics Symposium on Computer Animation, p.p. 232–238, 2003. 7. Lee, J., Chai, J., and Reitsma, P. Interactive control of avatars animated with
human motion data. International Conference on Computer Graphics and Interactive Techniques, p.p. 491– 500, 2002.
8. Harrison, J., Rensink, R., and DePanne, M. Special issue: Proceedings of the 2004 siggraph conference. SIGGRAPH 23, p.p. 569–573, 2004.
9. Reitsma, P., and Pollard, N. Perceptual metrics for character animation; sensitivity to errors in ballistic motion. ACM Transactions on Graphics 22, 3, p.p. 537–542, 2003.
10.Harrison, J., Booth, K. S., and Fisher, B. D. Experimental investigation of linguistic and parametric descriptions of human motion for animation. Computer Graphics International, p.p. 154-155, 2002.
11.Oesker, M., Hecht, And Jung, B. Psychological evidence for unconscious processing of detail in real-time animation of multiple characters. Journal of Visualization and Computer Animation 11, p.p. 105–112, 2000.
12.Hodgins, J., O’Brien, J., and Tumblin, J. Perception of human motion with different geomentric models. IEEE Transactions on Visualization and Computer Graphics. 4, 4, p.p. 307–316, 1998.
13.Klein, S. A. Measuring, estimating and understanding the psychometric function: a commentary. Perception and Psychophysics 63, 8, p.p. 1421–55, 2001.
14.Linschonten, M., Harvey, L., Eller, P., and Jafek, W. Fast and accurate measurement of taste and smell thresholds using a maximum-likelihood adaptive staircase procedure. Perception and Psychophysics 63, 8, p.p. 1330–1347, 2001. 15.Johansson, G. Visual perception of biological motion and a model for its analysis.
Perception and Psychophysics 14, p.p. 201–211, 1973.
16.Cornsweet, T. The staircase method in psychophysics. American Journal of Psychology 75, p.p. 485-491, 1962.
17.Treutwein, B. Minireview: Adaptive psychophysical procedures. Vision Res. 35, 17, p.p. 2503–2522, 1995.
18.Cater, K., Chalmers, A., and Ward, G. Detail to attention: Exploiting visual tasks for selective rendering. In Proceedings of the 2003 Eurographics Symposium on Rendering, Eurographics, Christensen and D. Cohen-Or, Eds., p.p. 270–280, 2003. 19.Garland, M., and Heckbert, P. 1997. Surface simplification using quadric error