Finding Patterns in Noisy Crowds: Regression-based Annotation
Aggregation for Crowdsourced Data
Natalie Parde and Rodney D. Nielsen Department of Computer Science and Engineering
University of North Texas
{natalie.parde,rodney.nielsen}@unt.edu
Abstract
Crowdsourcing offers a convenient means of obtaining labeled data quickly and inex-pensively. However, crowdsourced labels are often noisier than expert-annotated data, making it difficult to aggregate them meaningfully. We present an aggregation approach that learns a regression model from crowdsourced annotations to predict aggregated labels for instances that have no expert adjudications. The predicted la-bels achieve a correlation of 0.594 with expert labels on our data, outperforming the best alternative aggregation method by 11.9%. Our approach also outperforms the alternatives on third-party datasets. 1 Introduction
Publicly-available labeled datasets are scarce for many NLP tasks, and crowdsourcing services such as Amazon Mechanical Turk1 (AMT) offer
re-searchers a quick, inexpensive means of labeling their data. However, workers employed by these services are typically unfamiliar with the anno-tation tasks, and they may have little motivation to perform high-quality work due to factors such as low pay and anonymity. To further complicate matters, some workers may produce spam or ma-licious responses. Thus, it is not uncommon for workers to correlate poorly with one another.
Researchers using crowdsourcing services com-monly aggregate the labels they receive via sim-ple strategies such as using the majority or av-erage label. These methods are best suited for simple, straightforward tasks; with noisier data such as that which may be obtained for more dif-ficult or subjective tasks, these strategies may pro-duce skewed labels that misrepresent the instance.
1www.mturk.com
Thus, it is desirable to devise more effective aggre-gation strategies that consider factors such as label distribution and worker quality, while still avoid-ing manual adjudication of all instances.
In this work, our contributions are as follows: (1) we develop a regression-based method for au-tomatically aggregating crowdsourced annotations of varying quality, with poor agreement and mini-mal expert-adjudicated data, that addresses multi-ple potential flaws or biases in non-expert human annotation. To do so, we (2) crowdsource anno-tations for a difficult NLP task, metaphor novelty scoring, and (3) describe a process by which we automatically detect untrustworthy workers. We then (4) introduce a feature set that captures label distribution and trustworthiness, and extract the features from our crowdsourced annotations. Fi-nally, (5) we train a regression model that predicts aggregated labels for unseen instances and com-pare the predictions to expert annotations, finding that our method outperforms the best alternative approach. We evaluate our approach both on our data and on existing crowdsourcing datasets. All datasets and source code are available for the re-search community to improve on our results.2
2 Related Work
Several methods have been proposed to identify low-quality workers in crowdsourced data. Jaga-bathula et al.(2016) filtered adversarial workers in binary labeling tasks by identifying those with out-lier labeling patterns, andLin et al. (2014) identi-fied when additional labels for binary tasks should be crowdsourced to optimize classifier accuracy. Unlike these approaches, our filtering algorithm is suitable for multi-class annotation tasks.
2Our data can be downloaded athttp://hilt.cse.
unt.edu/resources.html, and our source code is available at https://github.com/natalieparde/ label-aggregation.
Various methods have also been explored as in-telligent modes of label aggregation. Most (Snow et al., 2008; Raykar et al., 2010; Karger et al.,
2011; Liu et al., 2012; Hovy et al., 2013; Felt et al., 2014;Huang et al., 2015) have built upon the probabilistic item-response model first pro-posed byDawid and Skene(1979), which simul-taneously estimates annotator quality and aggre-gated labels using an expectation-maximization algorithm. MACE (Hovy et al.,2013) is a popular implementation inspired by this that aggregates la-bels as a function of the annotation and a learned binary variable indicating whether the annotator is a spammer. We posit that although annotator qual-ity is an important factor in predicting accurate ag-gregations, the interplay between it and other fac-tors is more nuanced. Thus, rather than adapting the item-response method, our learning approach incorporates features that address multiple poten-tial flaws or biases in crowdsourced annotations.
Some researchers have also used data-aware ap-proaches to predict aggregations (Raykar et al.,
2010;Felt et al., 2014, 2015, 2016). We do not use the data itself in this work, to avoid skewing labels in a way that makes it trivial to learn clas-sifiers based on the same data. To the best of our knowledge, our work is the first to frame label ag-gregation as a regression task, with features based solely on workers and their labels, that learns en-tirely from a small amount of expert-adjudicated crowdsourced annotations.
3 Methods
3.1 Data Collection
We evaluated our approach on our new metaphor novelty dataset, as well as on third-party datasets. To build our dataset, we crowdsourced annota-tions for 3112 potentially metaphoric word pairs, and randomly divided the instances into training (1036), validation (1038), and test (1038) subsets. We developed features and selected our regression algorithm using the training and validation sets only; the test set was withheld until the evaluation.
3.1.1 Annotation Task
Instances were comprised of pairs of words from 1840 sentences in the VU Amsterdam Metaphor Corpus (VUAMC) (Steen et al., 2010). The VUAMC consists of documents for which individ-ual words are labeled as metaphors. The novelty of those metaphors varies widely, from highly
con-Example Score
Alice looked up, and there stood the Queen in front of them, with her arms folded,frowninglike athunderstorm.
Novel Metaphor (3) ‘Once,’ said the Mock Turtle at last, with
adeepsigh, ‘I was a real Turtle.’ ConventionalMetaphor (1) A large rose-treestoodnear theentrance
of the garden: the roses growing on it were white, but there were three garden-ers at it, busily painting them red.
[image:2.595.311.526.60.165.2]Non-Metaphor (0)
Table 1: Sample word pairs provided to Turkers.
ventional to quite novel. Each sentence for which we collected annotations contained a content word (noun, verb, adjective, or adverb) labeled as being metaphoric, and one or more other content words or personal pronouns that were syntactically re-lated to the metaphoric word. Word pairs contain-ing a metaphoric word and a syntactically-related content word or personal pronoun were considered instances. AMT workers (“Turkers”) were asked to score each instance on a discrete scale from non-metaphoric (0) to highly novel metaphor (3). Some examples are shown in Table1.3
Instances were grouped into Human Intelli-gence Tasks (HITs) containing all instances asso-ciated with 10 sentences each. Five worker assign-ments were requested per HIT, and Turkers were paid $0.20 per HIT. Overall, 237 Turkers anno-tated 942 assignments, with an average correlation of 0.269 per HIT (the poor agreement suggests this is a very difficult annotation task). An expert adju-dicated all 3112 instances; those labels were con-sidered the gold standard.
3.1.2 Data Filtering
Spam and malicious workers were identified dur-ing data collection usdur-ing a filterdur-ing algorithm that compared annotations with those completed by “potentially good annotators” (P GA). Alg. 1 de-scribes this process. LettingHi be a set of HITs collected, Ai be the set of annotators who anno-tatedHi, and A=∪(A1, . . . , Aj) be the set of all annotators, the algorithm computes three sets of annotators: good annotators (GA), spammers or malicious annotators (Bad Robots, or BR), and annotators of currently unknown qualityUQA.
R(aj, ak) computes the correlation coefficient
Algorithm 1Worker Filtering for Annotation Seti P GA←A\BR
repeat
forajinAdo
Aj← {a∈P GA}who annotated≥1unfiltered
HIT in common withaj
forakinAjdo
rj,k←R(aj, ak)
rj←AVG R(aj)
B−← {a
j∈A|rj<0.0}
B0← {a
j∈A|rj== 0.0orrj==∞}4
B+← {a
j∈A}, of size|B−|, with the lowestrj>
0.0
B<.1← {a
j∈A|rj<0.1}
P GA=A−(B−+B0+B++B<.1)
untilconvergence or iterations=max GA← {aj∈A|rj>0.35}
BR←B−+B0+BOTTOM(ROUND(2
3|B−|), B+)
completed under a minimum time threshold were also filtered. Following algorithm completion, fil-tered HITs and unpaid HITs from members ofBR were rejected, and annotators inBRwere disqual-ified from accepting future HITs. 116 total as-signments were rejected by the filtering algorithm. Annotators in UQA (UQA=A−GA−BR) who had completed≥2HITs and had anrj <0.1were also disqualified. All other HITs were accepted.
3.2 Features
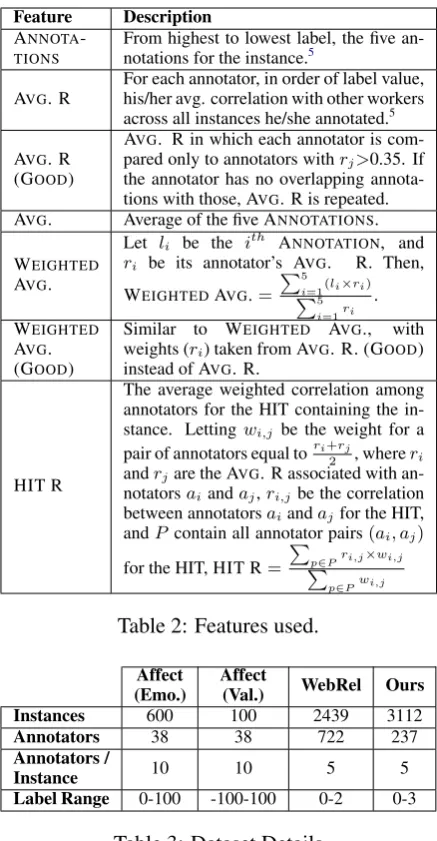
We designed features to capture the distribution and trustworthiness of crowdsourced labels for each instance. The features are described in Ta-ble2. ANNOTATIONSare designed to provide the
regression algorithm with label distributions based on label value and worker trustworthiness. AVG.
R features are intended to further clarify worker quality, and AVG. R (GOOD) is meant to provide
a more selective view of the same characteristic. AVG., WEIGHTED AVG., and WEIGHTED AVG.
(GOOD) allow the regressor to consider three
dif-ferent versions of a popular aggregation strategy, and finally, HIT R supplies the algorithm with an estimate of agreement on the current instance to consider when making its prediction.
3.3 Regression Algorithm
The approach utilizes a random subspace regres-sor, which was selected based on its performance on the training and validation data relative to a 4Turkers who assigned the same label to every instance, or
whose assignments had already been filtered for some other reason (e.g., violating the minimum time threshold).
5We also include a second copy of these features ordered
by the annotators’ averagervalues.
Feature Description
ANNOTA -TIONS
From highest to lowest label, the five an-notations for the instance.5
AVG. R For each annotator, in order of label value,his/her avg. correlation with other workers across all instances he/she annotated.5
AVG. R (GOOD)
AVG. R in which each annotator is com-pared only to annotators withrj>0.35. If
the annotator has no overlapping annota-tions with those, AVG. R is repeated. AVG. Average of the five ANNOTATIONS. WEIGHTED
AVG.
Let li be the ith ANNOTATION, and
ri be its annotator’s AVG. R. Then,
WEIGHTEDAVG.=
P5
i=1(li×ri)
P5
i=1ri
. WEIGHTED
AVG. (GOOD)
Similar to WEIGHTED AVG., with weights (ri) taken from AVG. R. (GOOD)
instead of AVG. R.
HIT R
The average weighted correlation among annotators for the HIT containing the in-stance. Lettingwi,j be the weight for a
pair of annotators equal tori+rj
2 , whereri andrjare the AVG. R associated with
an-notatorsaiandaj,ri,jbe the correlation
between annotatorsaiandajfor the HIT,
andPcontain all annotator pairs(ai, aj)
for the HIT, HIT R= P
p∈Pri,j×wi,j P
p∈Pwi,j
Table 2: Features used.
Affect
(Emo.) Affect(Val.) WebRel Ours Instances 600 100 2439 3112
Annotators 38 38 722 237
Annotators /
Instance 10 10 5 5
[image:3.595.307.526.59.480.2]Label Range 0-100 -100-100 0-2 0-3
Table 3: Dataset Details
large variety of other regression algorithms. Ran-dom subspace is similar in nature to bagging and random forests, using multiple decision trees con-structed from subsets of features selected ran-domly without replacement to make its predictions (Ho, 1998). We used the implementation from the Weka library (Frank et al.,2016), with Weka’s REPTree classifier as the base decision tree model.
4 Evaluation 4.1 Other Datasets
Affect (Emotion and Valence). Affect (Emo-tion) and Affect (Valence) were created for Snow et al.’s (2008) work, and contain emotion (anger,
fear, disgust, joy, sadness, andsurprise) and va-lence ratings for 100 headlines from the SemEval affective text annotation task (Strapparava and Mi-halcea,2007) test set. Annotations indicate the de-gree of emotion in an emotion-headline pair (Af-fect (Emotion)) and the overall positive or negative valence of a headline (Affect (Valence)). Snow et al. report an average correlation among annotators of 0.669 (emotion) and 0.844 (valence).
WebRel. WebRel was originally created for the TREC 2010 Relevance Feedback Track (Buckley et al.,2010), and its annotations indicate the rele-vance of web documents retrieved for queries. The full dataset contains crowdsourced annotations for 20,232 topic-document pairs; 3277 of those pairs additionally have gold-standard labels. The num-ber of annotations collected per instance varied. We used the subset of instances with gold stan-dard labels and at least five annotations, and recon-structed their HIT groupings based on the workers that annotated each instance (we assumed all in-stances annotated by the exact same set of work-ers were originally from the same HIT). Average correlation per HIT was 0.102 (quite noisy).
4.2 Experimental Setup
We compare our approach to a number of alter-native methods, detailed with justifications in Ta-ble 4. The alternatives are popular aggregation techniques that address different potential flaws in non-expert annotation. We train our approach on the training (and validation, for our dataset) data, and test on the test set. Since MACE (used for Item-Response) learns from and outputs pre-dictions for the same data, we provide it with the entire dataset (training, validation if available, and test), but report its results for the test in-stances only. We provide input to MACE in an n-dimensional sparse matrix (1 row per instance and 1 column per each ofndistinct annotators in the dataset, with filled values only for the annotators who provided annotations for that instance), since the approach requires knowledge of which annota-tor provided each annotation to function properly.6
6Note: Item-response approaches are better-suited to
sce-narios in which fewer workers annotate more instances each, but our results would also improve under such circumstances where a worker’s trustworthiness, as measured by averager value, is more reliable.
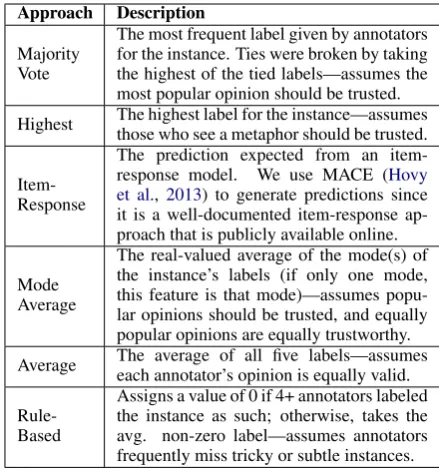
Approach Description
Majority Vote
The most frequent label given by annotators for the instance. Ties were broken by taking the highest of the tied labels—assumes the most popular opinion should be trusted. Highest The highest label for the instance—assumesthose who see a metaphor should be trusted.
Item-Response
The prediction expected from an item-response model. We use MACE (Hovy et al., 2013) to generate predictions since it is a well-documented item-response ap-proach that is publicly available online. Mode
Average
The real-valued average of the mode(s) of the instance’s labels (if only one mode, this feature is that mode)—assumes popu-lar opinions should be trusted, and equally popular opinions are equally trustworthy. Average The average of all five labels—assumeseach annotator’s opinion is equally valid.
Rule-Based
[image:4.595.305.525.61.298.2]Assigns a value of 0 if 4+ annotators labeled the instance as such; otherwise, takes the avg. non-zero label—assumes annotators frequently miss tricky or subtle instances.
Table 4: Alternative Approaches.
We also evaluate the performance of different feature subsets on our data. All−Averages con-tains all features except for AVG., WEIGHTED
AVG., and WEIGHTEDAVG. (GOOD). Each other
subset contains all features except for the respec-tive feature type noted from Table2. The corre-lation coefficient (r) and root mean squared er-ror (RMSE) were recorded for each test condition since our estimator produced continuous-valued scores. SinceMode Average,Average, and Rule-Based result in continuous values and Majority Vote,Highest, andItem-Responseresult in discrete values, we present two versions of our results; in one, predictions were rounded to the nearest inte-ger (forcing a 0, 1, 2, or 3) and in the other, they were left as-is. For the discrete approaches on our data, we also report accuracy.
4.3 Results
Method r RMSE Acc.
Majority Vote 0.443 1.011 0.536
Highest 0.295 1.701 0.183
Item-Response 0.362 1.083 0.483
Ours (Rounded) 0.490 0.690 0.600
Mode Average 0.501 0.836 —
Average 0.531 0.743 —
Rule-Based 0.351 1.126 —
[image:5.595.308.527.61.147.2]Ours (Continuous) 0.594 0.605 —
Table 5: Comparison with alternative methods.
Method r RMSE
Affect (Emotion)
Majority Vote 0.510 23.2
Highest 0.416 52.4
Item-Response 0.526 21.8
Ours (R) 0.578 16.6
Mode Average 0.506 21.9
Average 0.613 16.7
Rule-Based 0.462 26.5 Ours (C) 0.578 16.6
Affect (Valence)
Majority Vote 0.423 50.1
Highest 0.573 75.3
Item-Response 0.483 46.0
Ours (R) 0.938 18.4
Mode Average 0.644 37.4
Average 0.926 22.4
Rule-Based 0.913 19.7
Ours (C) 0.938 18.4
WebRel
Majority Vote 0.325 1.0
Highest 0.219 1.2
Item-Response 0.385 0.9
Ours (R) 0.412 0.8
Mode Average 0.350 0.9
Average 0.372 0.8
Rule-Based 0.282 0.9
Ours (C) 0.523 0.7
Table 6: Comparison on third-party datasets.
rounded predictions also outperformed all discrete alternatives (Majority Vote, Highest and Item-Response) with relative correlation improvements of 10.6%, 66.1%, and 35.4%, respectively. All ap-proaches had strong positive statistically signifi-cant (p<<0.0001) correlations and the improve-ment of our results over the alternatives was sta-tistically significant (p<<0.0001).
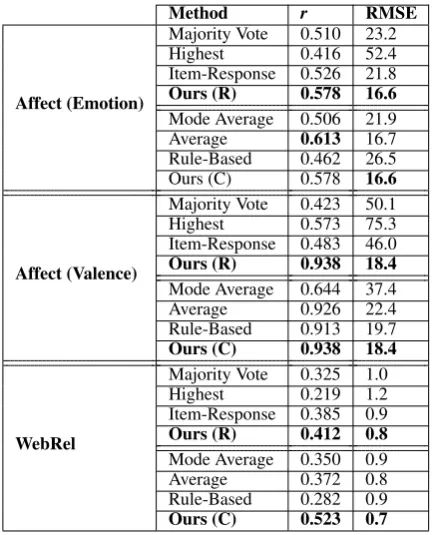
On WebRel and Affect (Valence), our approach outperformed all other approaches for both the dis-crete and continuous conditions. On Affect (Emo-tion), our approach outperformed all alternatives for the discrete condition and had a lower RMSE than all other approaches for the continuous condi-tion (relative reduccondi-tions in error to RULE-BASED,
AVERAGE, and MODE AVERAGE were 37.4%,
0.6%, and 24.2%, respectively), but the predic-tions from AVERAGE correlated better with the
gold standard than did those of our approach.
Rounded Continuous Feature Set r RMSE r RMSE
All 0.490 0.690 0.594 0.605
[image:5.595.89.277.63.162.2]All−Annotations 0.440 0.716 0.557 0.627 All−Avg. R 0.480 0.701 0.581 0.611 All−Avg. R (G.) 0.494 0.692 0.582 0.611 All−Averages 0.465 0.703 0.594 0.607 All−HIT R 0.486 0.693 0.587 0.608
Table 7: Feature subset performance comparison.
Interestingly, Table 7 shows that the discrete version of our approach performed slightly better when the features indicating annotators’ correla-tions with good annotators were removed; this was not the case for the continuous-labeled version. The raw annotations themselves were the most valuable features for both cases. Their removal led to a correlation reduction of 10.2% (rounded) and 6.2% (continuous) relative to using all features.
The results suggest that our approach is a suit-able means of automatically aggregating noisy crowdsourced labels, and that reasonable results can be obtained even when training on only a small amount of expert-adjudicated instances. Further, the performance of the alternative approaches sug-gests that typical aggregation techniques may be less suitable for tasks with many workers who completed relatively few annotations.
5 Conclusion
In this work, we present a regression-based ag-gregation method that addresses multiple poten-tial flaws or biases in non-expert human annota-tion. We show that the predictions from our ap-proach correlate atr=0.594 with expert adjudica-tions for a noisy, difficult task, outperforming the best alternative approach by 11.9% on our data and by up to 63.7% on third-party crowdsourcing datasets. This improvement shows that a learn-ing approach can overcome some of the challenges faced by simple label aggregation techniques for these types of tasks. Our data and source code is publicly available for further research by others. Acknowledgments
[image:5.595.73.291.196.464.2]References
Chris Buckley, Matthew Lease, Mark D Smucker, Hyun Joon Jung, Catherine Grady, et al. 2010.
Overview of the trec 2010 relevance feedback track (notebook). InThe Nineteenth Text Retrieval
Con-ference (TREC) Notebook, pages 88–90. Association
for Computational Linguistics.
A. P. Dawid and A. M. Skene. 1979. Maximum likeli-hood estimation of observer error-rates using the em algorithm. Journal of the Royal Statistical Society. Series C (Applied Statistics), 28(1):20–28.
Paul Felt, Robbie Haertel, Eric Ringger, and Kevin Seppi. 2014. Momresp: A bayesian model for multi-annotator document labeling. InProceedings of the Ninth International Conference on Language
Resources and Evaluation (LREC’14), Reykjavik,
Iceland. European Language Resources Association (ELRA).
Paul Felt, Eric Ringger, Jordan Boyd-Graber, and Kevin Seppi. 2015. Making the most of crowd-sourced document annotations: Confused super-vised lda. In Proceedings of the Nineteenth Con-ference on Computational Natural Language Learn-ing, pages 194–203, Beijing, China. Association for Computational Linguistics.
Paul Felt, Eric Ringger, and Kevin Seppi. 2016.
Semantic annotation aggregation with conditional crowdsourcing models and word embeddings. In Proceedings of COLING 2016, the 26th Interna-tional Conference on ComputaInterna-tional Linguistics:
Technical Papers, pages 1787–1796, Osaka, Japan.
The COLING 2016 Organizing Committee. Eibe Frank, Mark A. Hall, and Ian H. Witten. 2016.
The weka workbench. In Online Appendix for ”Data Mining: Practical Machine Learning Tools
and Techniques”, fourth edition. edition. Morgan
Kaufmann.
Tin Kam Ho. 1998. The random subspace method for constructing decision forests. IEEE Transac-tions on Pattern Analysis and Machine Intelligence, 20(8):832–844.
Dirk Hovy, Taylor Berg-Kirkpatrick, Ashish Vaswani, and Eduard Hovy. 2013. Learning whom to trust with mace. InProceedings of the 2013 Conference of the North American Chapter of the Association for Computational Linguistics: Human Language
Technologies, pages 1120–1130, Atlanta, Georgia.
Association for Computational Linguistics.
Ziheng Huang, Jialu Zhong, and Rebecca J. Passon-neau. 2015. Estimation of discourse segmentation labels from crowd data. InProceedings of the 2015 Conference on Empirical Methods in Natural
Lan-guage Processing, pages 2190–2200, Lisbon,
Portu-gal. Association for Computational Linguistics. Srikanth Jagabathula, Lakshminarayanan
Subrama-nian, and Ashwin Venkataraman. 2016. Identifying
unreliable and adversarial workers in crowdsourced labeling tasks. Journal of Machine Learning Re-search, 17(1).
David R. Karger, Sewoong Oh, and Devavrat Shah. 2011. Iterative learning for reliable crowdsourcing systems. In J. Shawe-Taylor, R. S. Zemel, P. L. Bartlett, F. Pereira, and K. Q. Weinberger, editors, Advances in Neural Information Processing Systems 24, pages 1953–1961. Curran Associates, Inc. Christopher H Lin, Daniel S Weld, et al. 2014. To re
(label), or not to re (label). In Proceedings of the Second AAAI Conference on Human Computation
and Crowdsourcing (HCOMP 2014).
Qiang Liu, Jian Peng, and Alexander T Ihler. 2012. Variational inference for crowdsourcing. In F. Pereira, C. J. C. Burges, L. Bottou, and K. Q. Weinberger, editors, Advances in Neural
Informa-tion Processing Systems 25, pages 692–700. Curran
Associates, Inc.
Vikas C Raykar, Shipeng Yu, Linda H Zhao, Ger-ardo Hermosillo Valadez, Charles Florin, Luca Bogoni, and Linda Moy. 2010. Learning from crowds. Journal of Machine Learning Research, 11(Apr):1297–1322.
Rion Snow, Brendan O’Connor, Daniel Jurafsky, and Andrew Y. Ng. 2008. Cheap and fast—but is it good?: Evaluating non-expert annotations for nat-ural language tasks. In Proceedings of the Con-ference on Empirical Methods in Natural Language
Processing, EMNLP ’08, pages 254–263,
Strouds-burg, PA, USA. Association for Computational Lin-guistics.
Gerard J Steen, Aletta G Dorst, J Berenike Herrmann, Anna Kaal, Tina Krennmayr, and Trijntje Pasma. 2010. A method for linguistic metaphor identifica-tion: From MIP to MIPVU, volume 14. John Ben-jamins Publishing.