warwick.ac.uk/lib-publications
Original citation:
Dickson, James, Wright, Steven A., Maheswaran, Satheesh, Herdman, J. A., Harris, Duncan,
Miller, Mark C. and Jarvis, Stephen A. (2017) Enabling portable I/O analysis of commercially
sensitive HPC applications through workload replication. In: Cray User Group 2017,
Redmond, California, USA, 7-12 May 2017. Published in: Cray User Group 2017 Proceedings
Permanent WRAP URL:
http://wrap.warwick.ac.uk/88043
Copyright and reuse:
The Warwick Research Archive Portal (WRAP) makes this work by researchers of the
University of Warwick available open access under the following conditions. Copyright ©
and all moral rights to the version of the paper presented here belong to the individual
author(s) and/or other copyright owners. To the extent reasonable and practicable the
material made available in WRAP has been checked for eligibility before being made
available.
Copies of full items can be used for personal research or study, educational, or not-for-profit
purposes without prior permission or charge. Provided that the authors, title and full
bibliographic details are credited, a hyperlink and/or URL is given for the original metadata
page and the content is not changed in any way.
A note on versions:
The version presented in WRAP is the published version or, version of record, and may be
cited as it appears here.
Enabling Portable I/O Analysis of Commercially
Sensitive HPC Applications Through Workload
Replication
James Dickson∗, Steven Wright∗, Satheesh Maheswaran†,
Andy Herdman†, Duncan Harris†, Mark C. Miller‡ and Stephen Jarvis∗ ∗Department of Computer Science, University of Warwick, UK
†UK Atomic Weapons Establishment, Aldermaston, UK ‡Lawrence Livermore National Laboratory, Livermore, CA
Corresponding Email: [email protected]
Abstract—Benchmarking and analyzing I/O performance across high performance computing (HPC) platforms is necessary to identify performance bottlenecks and guide effective use of new and existing storage systems. Doing this with large production applications, which can often be commercially sensitive and lack portability, is not a straightforward task and the availability of a representative proxy for I/O workloads can help to provide a solution. We use Darshan I/O characterization and the MACSio proxy application to replicate five production workloads, showing how these can be used effectively to investigate I/O performance when migrating between HPC systems ranging from small local clusters to leadership scale machines. Preliminary results indicate that it is possible to generate datasets that match the target appli-cation with a good degree of accuracy. This enables a predictive performance analysis study of a representative workload to be conducted on five different systems. The results of this analysis are used to identify how workloads exhibit different I/O footprints on a file system and what effect file system configuration can have on performance.
I. INTRODUCTION
Gaining insight into the performance characteristics of ap-plication is vital in the high performance computing (HPC) life cycle. Detailed knowledge of performance is required by those tasked with the maintenance and modernization of production code, enabling application end-users to produce results in the challenging time-frames of a scientific production environment. Furthermore, when it comes to performing the exercise of system procurement, the availability of a repre-sentative production workload is invaluable to predict what a potential system might offer in terms of performance, should it be deployed to support such a workload. Characterizing the performance of a workload helps to inform system designers and vendors how new architectures can be developed and configured to offer the best achievable performance now and as extreme scale computation continues to grow larger.
The importance of the data input/output (I/O) element of HPC applications and systems is continuing to grow, as new computational architectures and programming models reduce the proportion of runtime spent doing computation and communication, leading to the storage and retrieval of
results becoming a bottleneck to performance. It has long been identified that there exists a gap between the rate at which processing power is increasing and the rate at which I/O performance is increasing, and this gap is anticipated to grow as scientific computation strives to achieve exascale.
I/O is vitally important for three primary reasons: visu-alization, results output, and failure recovery – usually in the form of checkpointing. Understanding how these three activities are interleaved over the run of an application is important to successfully imitate the sensitive workloads of some organizations. The MACSio Proxy application can be used to partially achieve this goal, taking input files replicating commercially sensitive workloads and allowing them to be simulated in an open environment.
Identifying the I/O performance characteristics of large production applications is not a straightforward task, with the peak performance of storage systems impossible to reach in practice. Furthermore, changes in the architecture of storage systems present new challenges, the most prominent being the emergence of burst buffer technologies such as Cray’s DataWarp I/O accelerator. Understanding how best to con-figure applications to make best use of these technologies is a time consuming process, and particularly impractical for large complex simulations. Additionally, when procuring new systems it is vital to benchmark I/O performance in a way that is representative of real and varied workloads to get a true picture of system potential.
This work presents a study of the workload replication of a commercially sensitive production application to enable the analysis of its I/O performance on a range of open HPC systems. In addition to enabling a portable proxy for a large controlled application, we assess how I/O performance can be tuned using this proxy. Specifically, this paper makes the following contributions:
• We make modifications to the structure of the MACSio
We show that our replicated I/O data volumes match the original with a good degree of accuracy, with the overall size of data transfered differing by less than 10%;
• We use Darshan I/O profiling and identify counters that
can be translated to a set of workload parameters. In particular, we outline two equations for the estimation of parameters not readily available from Darshan logs and demonstrate how the size of the dataset varies based on its composition parameters. Additionally, we are able to map the known pattern of dataset growth to the visualization pattern to account for this information being unavailable in profiling;
• Finally, we extend our previous replication work by
outlining five distinct I/O patterns exhibited by a com-mercially sensitive multi-physics application. We use replications of this application to evaluate and predict I/O performance on five different systems with various file system configurations. Using the workload replications, we make observations about how the different systems behave under contrasting I/O patterns and volumes of data demonstrated in the multi-physics application. We identify which of the application workloads perform less efficient I/O on the test systems, and predict how these workloads might be expected to scale beyond their current use.
The remainder of this paper is structured as follows: Section II presents a review of related work; Section III provides back-ground on parallel I/O and the different components important to this work; Section IV details the changes made to MACSio and the elements defined to perform the parameter translation; in Section V, the results of characterizing and replicating production workloads are presented with analysis; finally, Section VI concludes this paper and presents opportunities for future investigation.
II. RELATEDWORK
With I/O representing increasing proportions of application runtime, investigation into its intricacies has been carried out at a system level on representatively large scale machines. It has been established that mixed workloads often struggle to reach peak performance and vary drastically with the use of different I/O libraries and specific tuning parameters [1].
Snyder et al. propose interesting workload generation tech-niques and identify three classes of I/O workload repre-sentations: traces, synthetic and characterization [2]. Trace workloads refer to those generated using snapshots of in-dividual I/O operations along with associated timing data. Tools such as Recorder [3], RIOT [4] and ScalaIOTrace [5] capture the required granularity of information at multiple levels in the software stack. With such high fidelity data collection, it is possible to translate application traces into a representative proxy using auto-generation tools, such as the Replayer tool [6]; however these require refinement and there are questions as to how much of an effect intensive data collection has on the application behavior being monitored.
Synthetic workloads are manually defined using a domain specific language to exercise a desired pattern on a storage sys-tem. An example being the CODES I/O language [7], which has been used to demonstrate performance improvements in burst buffer systems for some user interpreted workloads [8]. Characterizing I/O activity uses a technique similar to that of tracing, however compact high level statistics are produced rather than comprehensive trace logs. Darshan [9] has been used to produce characterization data of this form, and is effective due to its lightweight instrumentation and suitability for continuous machine wide deployment. Vitally, the data produced is still rich enough to study I/O behavior at the demands of petascale machines [10].
A common technique among I/O benchmarks, such as FLASH-IO [11], MADBench2 [12], Chombo I/O [13] and S3D-IO [14], is to manually extract important kernels from an application. FLASH-IO focuses on write performance of the Flash supernova code, while MADBench2 attempts to gain a more complete picture through the inclusion of both read and write operations for the same simulation. This approach attempts to bridge the gap between a stand-alone benchmark and the applications it attempts to model. While highly effec-tive at providing insight for a single application, there is a lack of flexibility for handling a wider range of I/O paradigms.
IOR [15] is a synthetic parametrized benchmark derived from workload analysis of applications used at the US National Energy Research Scientific Computing Center (NERSC). This work attempts to cover two of the common shortfalls of I/O benchmarks: a lack of representative access patterns and the inconsistent use of parallel libraries. With diverse configu-ration options, the authors claim to be able to reconstruct the behavior of an application to within 10%. While this behavioral prediction is only achievable with a very specific selection of parameters, with careful use, IOR can be an effective benchmarking tool. We adopt a similar parametrized approach, attempting to focus on the performance of high level libraries.
be demonstrated.
In previous work, we have demonstrated a workflow for using I/O characterization to replicate a mini-application with a basic I/O pattern, generating a set of parameters for a configurable proxy application [20]. The outcome of this work allowed us to demonstrate how leveraging features of a high level I/O library could improve I/O performance without the need to modify the target application source code.
III. BACKGROUND
In this section we provide details on the parallel I/O patterns that are employed in parallel computing and describe how this is handled in the M-Phys application. Additionally, we give an overview of the elements of the parallel I/O stack and the Darshan characterization tool that are used in this study.
A. Parallel I/O Patterns
The reading and writing of data during a simulation is a process that is performed by almost all applications in sci-entific computing. The footprint of this I/O can vary dra-matically between applications and even between multiple users of the same application or different input decks. It is possible however, to generalize a large portion of the I/O that applications perform into two categories: checkpoint restart and visualization data dumps. The writing of checkpoints often represents the greatest proportion of application I/O time, and is intended to preserve intermediate states of a simulation to protect against system failures that would be costly in terms of wasted computation time and loss of valuable results. Visualization files are often associated with smaller volumes of data but a high frequency of access. Valuable quantities are preserved that demonstrate the results of a simulation, which are usually a subset of the dataset required for a checkpoint based restart.
There are different methods of moving data in or out of an application in parallel, and they are categorized by the number of processes and the number of files that are involved in the I/O exchange. The simplest form of parallel I/O available to applications is to write a single file for each process, referred to as N-to-N. The performance of this method can be good when files are well distributed across a file system, removing file access contention. The drawback however is the scalability of file accesses due to the increased metadata load. Shared file I/O operates in an N-to-1 model where all of the processes in the simulation write to a single shared file. This method avoids the inefficiency of generating a large volume of files but can be difficult to coordinate in a way that does not create performance bottlenecks due to contention. Mediating these bottlenecks can be done with file striping to offset the accesses that are made concurrently to the same file by multiple processes. To address some of the scalability issues with both to-N and to-1, a hybrid between the two of N-to-M can be used to write data from all processes to a number of independent files in a way that shared file I/O can also be performed to each file by a subset of the simulation processes.
B. IO Software Stack
To handle I/O performed in parallel, a software stack com-prised of parallel file systems, middleware and higher level libraries exist to coordinate read and write operations from parallel processes such that this responsibility is removed from the application itself.
1) Parallel File Systems: Lustre [21] and IBM’s General
Parallel File System (GPFS) [22] are high performance dis-tributed file systems developed for use in large scale cluster computing. Data is spread across multiple storage nodes, with individual files being striped across multiple storage devices. This allows for blocks of data to be written and read in parallel and reduces the time to commit large volumes of data to the storage system.
The Lustre file system is by far the most commonly de-ployed in HPC systems and is made up of Object Storage Servers (OSSs) and Object Storage Targets (OSTs), represent-ing the storage nodes and storage media respectively. The file system is managed by a central management server in addition to metadata being stored by a central Metadata Server (MDS), often containing one or two Metadata Targets (MDT). The arrangement in Lustre commonly sees groups of OSTs connected to each OSS rather than connecting all OSSs to all OSTs.
GPFS has a largely similar design, however with the most notable difference that metadata is distributed across the stor-age components including the directory tree. There is no single directory controller or index server to handle management and lookup of data in the file system. Distribution can be achieved in one of two modes, where metadata is either shared across a metadata target in each storage node or striped across storage targets. The structure of GPFS also differs in that each file system node has equal access to each storage disk across a switching fabric.
2) MPI-IO: The MPI-IO interface forms the middleware
layer in the parallel I/O stack and effectively provides a standard for describing parallel I/O operations in MPI applica-tions. MPI-IO was introduced into the MPI 2.0 standard; the ROMIO implementation provides the MPI-IO functionality in the majority of MPI implementations used currently.
The function of the middleware layer for parallel I/O is to translate a file operation distributed across parallel processes to corresponding calls in the POSIX file layer, allowing the operations to be passed through to the POSIX compliant file system underneath. At this middleware layer it is the responsibility of the call maker, be it application developer or high level library, to specify details such as the file data offsets. It is the case that performing I/O at this layer offers the desired parallel behavior, but its use places a certain amount of design complexity on the application developer.
3) HDF5: It is becoming increasingly prevalent for large
enables more efficient parallel I/O to be coordinated for a range of use cases from simulations to data storage systems. In particular HDF5 simplifies the use of more advanced practices such as two phase I/O where data is aggregated and reordered to ensure more efficient data placement. The use of a self describing file format also enables data portability between systems and applications.
4) TyphonIO: TyphonIO [24] is a library of routines that
perform I/O for scientific data in applications. The library provides a C/C++ and a Fortran 90 API to write and read TyphonIO-format files for restart or visualization purposes that are completely portable across HPC platforms. The library, which is based on HDF5, provides the portable data infras-tructure. The way TyphonIO has been designed means that it would be possible to replace HDF5 with an alternative library implementation without having to make any code changes to applications using TyphonIO.
The TyphonIO file format is a hierarchical structure of dif-ferent objects, with each object corresponding to a simulation or model feature, like those found in scientific or engineering applications. Each object is designed to hold the data and associated metadata for each feature and some of these objects are chunked. Due to the way TyphonIO is designed, it is straightforward to add more objects in future and expand the format to cover more models.
C. Darshan I/O Characterization
Darshan [9] is a lightweight library for instrumenting I/O activity at multiple levels in the software stack. During ex-ecution, calls from the application are intercepted as they are translated down from high level libraries to the middleware and file systems layers before data eventually reaches the underlying parallel file system. To perform this monitoring in a lightweight fashion, complete data is not stored on each intercepted operation, instead a combination of counters and timestamps are used alongside data compression to ensure there is no unacceptable overhead to application execution. Additionally, the instrumentation can be done dynamically at runtime and hence enables monitoring of job I/O workloads to be enforced by default across a system. This makes Darshan an accessible tool for a wide range of applications and well suited to the work presented here. Version 3.1.3 introduces a module into the Darshan framework that enables an extended tracing capability, complimenting the base characterization functionality. This capability is implemented in a scalable way, and hence its use has been included in our studies to deepen the level of insight we can obtain from our investigation of I/O.
D. The MACSio Proxy Application
MACSio [25] was developed to fill a long existing void in co-design proxy applications that allow for I/O performance testing as well as evaluation of trade-offs in data model interfaces and parallel I/O paradigms for multi-physics HPC applications. Two key design features of MACSio set it apart from existing I/O proxy applications and benchmarking tools.
The first is the level of abstraction at which MACSio operates and the second is the degree of flexibility MACSio provides in driving an HPC I/O workload through parametrized, user-defined data objects and a variety of parallel I/O paradigms and I/O interfaces. Combined, these features allow MACSio to closely mimic I/O workloads for a wide variety of real HPC applications, in particular, multi-physics applications where data object distribution and composition vary dramatically both within and across parallel tasks. These data objects are then marshaled between primary and secondary storage ac-cording to a variety of application use cases (e.g. restart dump or trickle dump). Using one or more I/O interfaces (plugins) and parallel I/O paradigms, allows for direct comparisons of software interfaces, parallel I/O paradigms, and file system technologies with the same set of customizable data objects.
In previous work, MACSio was used to replicate a mini-application to verify its suitability for the purpose of investi-gating I/O behavior and libraries [20].
E. Production Multi-Physics Application
The application that is the subject of this study is a large multi-physics application used in a commercially sensitive production environment, henceforth referred to as M-Phys. The application is designed to operate with a certain degree of modularity, with a base physics simulation and based on the input configuration a variety of different physics packages can be activated at certain points in the simulation. The different configurations used in the simulation have a notable effect on the I/O workload that is generated by M-Phys, causing large variations in the simulation dataset and requirement for checkpointing along with visualization output. This work focuses on five different categories of problem typically solved with M-Phys, each displaying different characteristics. We have labeled these problems Simulation A through E.
IV. IMPLEMENTATION
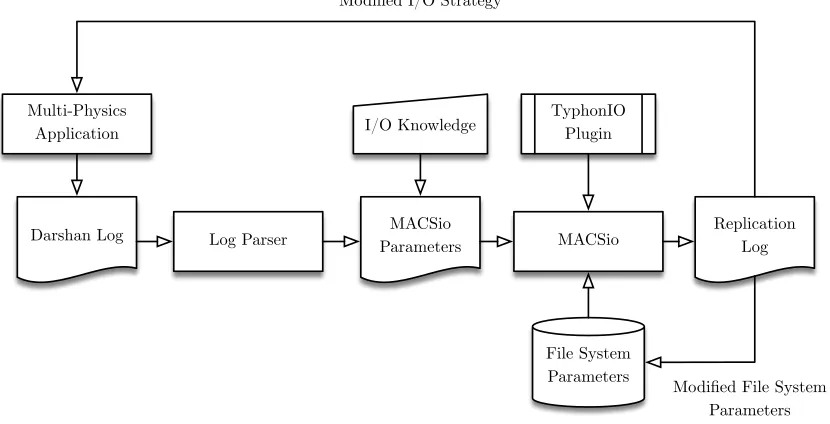
In this section we explain some of the features of our workflow components and how they have been implemented to enable proxy replications. In general, the replication workflow that we have followed is illustrated in Figure 1.
A. MACSio Code Modification
Multi-Physics Application
Log Parser
Darshan Log MACSio
Parameters I/O Knowledge
MACSio TyphonIO
Plugin
Replication Log Modified I/O Strategy
File System
Parameters Modified File System
[image:6.612.96.511.75.287.2]Parameters
Fig. 1: Replication workflow
Another modification required in MACSio for this work was the introduction of a visualization data capability distinct from that currently used for handling checkpoint dumps. As discussed in Section III-A, the requirements for a visualization dump are often very different to those used in checkpoint restart. A subset of data is required to produce a visualization of the simulation data and hence a data object was introduced to the internal JSON object data structure used in MACSio to represent the features of this dataset. Additionally, new file access behavior was introduced to the TyphonIO plugin for appending new states to a visualization file that remains open for the length of the simulation. To protect against file corruption should the simulation fail and avoid the overhead of file open and close operations, the data was flushed to the open file at the end of a visualization dump sequence. This was done with the TIO Flush function, which ensures any data cached by TyphonIO is committed to the file system.
B. Workload Design Characteristics
Workload characteristics are currently expressed to MACSio in the form of a command line parameter list. The careful selection of these parameters is what enable us to work towards replicating real world applications as closely as possible.
In order to process the knowledge we have about the target workload and generate a set of parameters for MACSio, there are a few key areas of the workload description that need to be modeled.
1) Checkpoint File Size Calculation: The total bytes written
to each checkpoint file is a counter that is provided by the base POSIX and MPI-IO modules in Darshan. This value for the volume of data we want to write can not as yet be directly fed in to MACSio, which generates a dataset based on the
weak scaling of a data ‘part size’ per process. The overall dataset composition is largely dependent on this part size, the variable count and the number of processes, and hence we must translate the overall dataset size to a combination of these parameters.
Each of the three parameters increase the dataset size in a pattern that fits a simple linear regression, with the dependent variable being dataset size and the independent variable being the processor count, part size or variable count. The combi-nation of these three linear equations into a single function, gives the equation seen in Equation 1. In this equation:F is
the filesize;P r is processor count;P S is the part size;V ars
is the number of dataset variables; and, α, β, γ, δ, ψ and η
are constants. The values of these constants are determined empirically from a dataset scaling study, and are necessary terms to account for the base volume of data associated with the mesh objects and metadata required in the HDF5 file structure.
F=P r(P S(αV ars+β) +γV ars+δ) +ψV ars+η (1)
2) Dataset Growth Pattern: A feature of some of the
simulations that we are replicating in the M-Phys applica-tion is the growth in size of the dataset as the simulaapplica-tion progresses. A discussion of this simulation characteristic is given in Section V-B. To incorporate this dataset growth in our replication, adata growth sequencecomponent has been
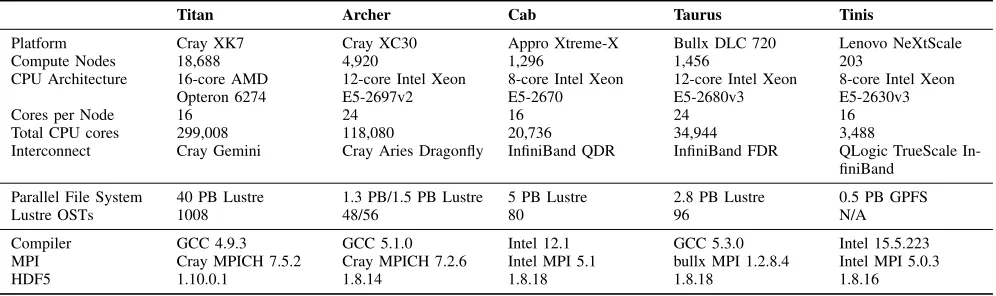
TABLE I: Experimental Platforms
Titan Archer Cab Taurus Tinis
Platform Cray XK7 Cray XC30 Appro Xtreme-X Bullx DLC 720 Lenovo NeXtScale Compute Nodes 18,688 4,920 1,296 1,456 203
CPU Architecture 16-core AMD
Opteron 6274 12-core Intel XeonE5-2697v2 8-core Intel XeonE5-2670 12-core Intel XeonE5-2680v3 8-core Intel XeonE5-2630v3
Cores per Node 16 24 16 24 16
Total CPU cores 299,008 118,080 20,736 34,944 3,488
Interconnect Cray Gemini Cray Aries Dragonfly InfiniBand QDR InfiniBand FDR QLogic TrueScale In-finiBand
Parallel File System 40 PB Lustre 1.3 PB/1.5 PB Lustre 5 PB Lustre 2.8 PB Lustre 0.5 PB GPFS
Lustre OSTs 1008 48/56 80 96 N/A
Compiler GCC 4.9.3 GCC 5.1.0 Intel 12.1 GCC 5.3.0 Intel 15.5.223 MPI Cray MPICH 7.5.2 Cray MPICH 7.2.6 Intel MPI 5.1 bullx MPI 1.2.8.4 Intel MPI 5.0.3
HDF5 1.10.0.1 1.8.14 1.8.18 1.8.18 1.8.16
3) Visualization File Scheme: As we have outlined in
Sec-tion III-A, the pattern of I/O in the visualizaSec-tion files we are replicating differs from checkpoint restart. A single file is opened at the beginning of the simulation and states are appended to the open file, marshaled by a timestep frequency. Due to the limited granularity afforded by the lightweight data collection of Darshan, a complete picture of the characteristics of each visualization dump is not reported and so this has to be modeled using the knowledge we have of the volume of data in the simulation.
The data reported on the overall size of the visualization output in combination with the growth factors calculated for the checkpoints provided can be used to fit the visualization dump sizes to the implicit dataset growth function. Equation 2 demonstrates how intuitively the overall visualization file is the sum of all simulation dumps of this type. If we consider the growth of the simulation dataset, the size of the visualization data written at any stage is the product of the previous data volume and the factor of growth between the steps. Combining Equation 2 and Equation 3 and rearranging we can describe the size of the initial individual visualization dump in terms of the total file size and the sequence of growth factors, shown in Equation 4.
V isT otal=V is0+V is1+...+V isn (2)
V isn+1=Fn.V isn (3)
V is0=
V isT otal
1 +F0(1 +F1(...(1 +Fn)))
(4)
4) Execution Scheduling: To achieve the correct pattern of
interspersed ‘computation’, checkpointing, and visualization file writing, the total number of I/O blocks is required as well as timestamp data for the start and end of file accesses. An end timestep is calculated for the simulation as the product of the total number of I/O blocks required for both checkpointing and visualization. The frequency of access for these I/O events is then calculated to distribute them between the starting and
ending timestep. As the main loop progresses, the timestep advances by one and the different behaviors are activated when the relevant timestep frequency is reached.
As we look to model I/O activity in the context of a simulation as a whole, it is necessary to factor in the often sparse ‘bursty’ nature of storage accesses. To achieve this, we account for a variable amount of time between accesses that relate to periods of compute and communication in the host simulation. Simulating these elements is currently beyond the scope of the replication we perform, and so a sleep period is introduced at the end of a timestep. The total gap between two accesses is achieved by calculating aseconds by dtfrom
a division of the timesteps between the accesses and the actual gap in execution time taken from the Darshan application log.
V. RESULTS
To assess the I/O demands and performance of five M-Phys simulation problems, we have used MACSio to conduct a series of experiments.
A. Experimental Configuration
The hardware used in these experiments is summarized in Table I.
Titan is a Cray XK7 comprised of 18,688 nodes, each containing a single 16-core AMD Opteron processor. The system is connected with the Gemini interconnect and is backed by two identical Lustre file systems. Each of these contains 1,008 object storage targets (OSTs) and has a total usable disk space of 14 PB.
Archer is a 4,920 node Cray XC30, with dual 12-core Intel Ivy Bridge processors per node. The system uses the Cray Aries interconnect in a Dragonfly topology and is attached to three Lustre file systems, two of which contain 48 OSTs and one 56 OSTs. The three file systems provide 1.3 PB, 1.3 PB and 1.5 PB respectively. We use one of the 48 OST file systems for our experiments.
parallel file systems. These file systems are both 5 PB of Lustre storage with 80 OSTs.
The theoretical peak bandwidth of these file systems varies due to their shared nature and their proximity to Cab. For this work we elected to use thelscratchefile system, which reports
a greater achievable performance ceiling.
Taurus is also a Linux cluster comprised of three tightly coupled islands. Phase two of the system was used in our experiments, and is a 1,456 node island with two 12-core Intel Haswell processors per node. Compute nodes are connected with FDR InfiniBand and the system is backed by a 2.8 PB Lustre file system made up of 96 OSTs.
Tinis is a Linux cluster of 203 nodes containing two 8-core Intel Haswell processors. Nodes in the system are connected with TrueScale InfiniBand and a 0.5 PB data store is provided by GPFS. This file system is made up of 120 disks organized into six data pools, attached to two Network Shared Disk (NSD) servers with metadata distributed across the data drives. For completeness, the original application profiling was performed on the Spruce A system. This machine is an SGI ICE X with 16 cores per node, backed by a Lustre file system of 140 OSTs. The configuration of this file system uses a default stripe width of 8 and default stripe size of 1 MB. Access to this machine is limited and hence experimental data collection is difficult to perform.
The software used on each of the machines studied is given in Table I. Along with these configurations, the 1.6 release of TyphonIO and Darshan version 3.1.3 are used.
B. M-Phys I/O Patterns
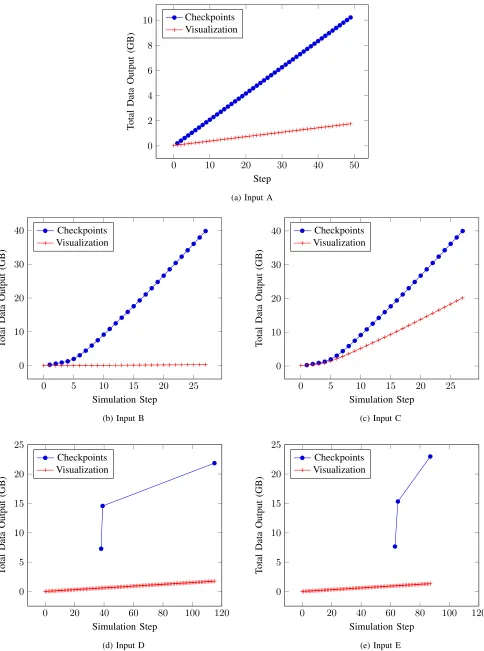
To begin our experiments, we first outline the I/O workload characteristics extracted from profiling runs of the M-Phys ap-plication. There are five simulation setups used in this study, which represent some important workloads generated by the application. We label these five inputs A to E and present an overview of their characteristics in Figure 2.
1) Simulation A: The first simulation type is the most
simple to characterize in terms of its I/O behavior. Over the course of the 119 minute runtime, 49 checkpoints are written with 213 MB of data stored in each. Additionally there are 50 states written to a visualization file giving a total visualization output of 1.75 GB. This simulation represents a reference test problem and so is typically run on a single node.
2) Simulation B: The pattern of the second simulation has
the additional characteristic that the composition of the dataset used for checkpointing and visualization is varied through the course of execution. The runtime of 131 minutes spans 27 checkpoints and 28 visualization states.
The dataset growth in the simulation can be seen in the size of each checkpoint, which grow from 259 MB at the beginning of the simulation and reach a total size of 1.9 GB. The total size of visualization data written reaches 285 MB.
The total cumulative data output of the simulation is shown in Figure 2b. It can be seen that there is a non-linear increase in the total checkpoint output, with a much greater rate of
increase around fifth checkpoint, which corresponds to the activation of additional simulation components.
From the perspective of understanding the I/O workload requirements of the simulation, it could be valuable to exploit knowledge of when this change will occur to influence a vari-ation in I/O strategy such as modifying checkpoint frequency.
3) Simulation C: Simulation C performs the same
exper-iment as B, but with an important additional physics pack-age added. The I/O pattern of this simulation, including the observed dataset growth, matches Simulation B but a much larger volume of data is required to visualize the additional data elements. As a result the total size of visualization data reaches 20.2 GB.
4) Simulation D: Simulation D represents a much larger
calculation, with very different I/O characteristics. Check-pointing is only performed at three key stages in the sim-ulation, with 7.3 GB of data committed to file for each at notably irregular intervals. The visualization file data totals 1.8 GB, and is stored in 116 separate state outputs, giving a much higher temporal granularity to the results that can be visualized than to the restart capability of the calculation.
5) Simulation E: The final input type for the M-Phys
ap-plication considered here performs a similar experiment to Simulation D. Similarly, three checkpoints of 7.7 GB are written at irregular intervals, while 1.4 GB of visualization data is produced across 88 simulation states.
C. Data Volume Accuracy
Matching the volumes of data movement in the simulation carefully is important to generate similar I/O traffic in our replication compared to the original. Writing the same quan-tities of data from memory to the storage media is the first step towards generating comparable behavior to the original simulation. Section IV-B provides some of equations used to translate known quantities from the target simulation to a dataset description in MACSio, and here we analyze the accuracy of the data volumes generated.
0 10 20 30 40 50 0
2 4 6 8 10
Step
Total
Data
Output
(GB)
Checkpoints Visualization
(a) Input A
0 5 10 15 20 25
0 10 20 30 40
Simulation Step
Total
Data
Output
(GB)
Checkpoints Visualization
(b) Input B
0 5 10 15 20 25
0 10 20 30 40
Simulation Step
Total
Data
Output
(GB)
Checkpoints Visualization
(c) Input C
0 20 40 60 80 100 120
0 5 10 15 20 25
Simulation Step
Total
Data
Output
(GB)
Checkpoints Visualization
(d) Input D
0 20 40 60 80 100 120
0 5 10 15 20 25
Simulation Step
Total
Data
Output
(GB)
Checkpoints Visualization
(e) Input E
[image:9.612.54.538.52.703.2]TABLE II: Dataset size accuracy
A B C D E
Mean % Error in
Checkpoints size 0.17% 1.90% 3.05% 1.14% 0.46% Max % Error in
Checkpoint size 0.43% 16.22% 16.27% 1.16% 0.46% % Error in
Visualiza-tion size 8.29% 0.23% 5.72% 1.88% 1.96% % Error in
Visualiza-tion size per state 0.16% 0.01% 0.20% 0.02% 0.02%
0 5 10 15 20 25
500 1,000 1,500 2,000
Checkpoint Number
Size
(MB)
[image:10.612.50.297.69.376.2]Original Replication
Fig. 3: Dataset Growth of Input B
D. Machine Performance
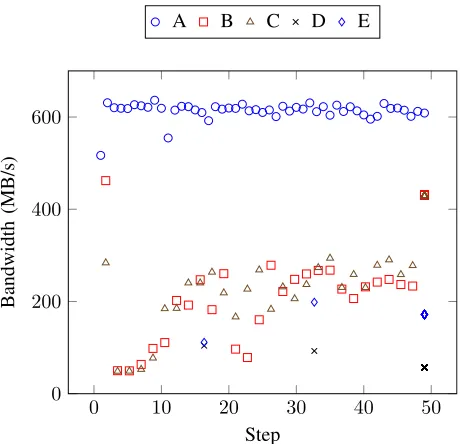
A key motivation for our workload replication is the ability to understand how a particular application will perform on different platforms under different file system configurations. We have used the replication parameters created for each simulation type to investigate the performance characteristics of each of the platforms in Table I. In particular, we focus on the file bandwidth of the checkpoint files written in the simulations as this can be easily calculated based on the available Darshan log data.
In Figure 5 the checkpoint bandwidths are given for each of the original simulations under the default file system configuration. In order to display the I/O performance for each of the simulation types in a way that allows direct comparison, the y-axis here represents execution steps relative to the end of the run rather than the walltime. It is clear from this plot that Simulation A achieves the best performance in terms of bandwidth, which is expected due to the regularity and smaller scale of the workload. The remaining four simulations demon-strate more similar performance with regards to the bandwidth range achieved by checkpointing activity during execution. Importantly, the I/O performance for Simulations B and C can be seen to increase during execution. This improvement in performance shows a correlation with the changes to the dataset composition seen in these classes of experiment, and
0 5 10 15 20 25
0 2 4 6 8 10
Step
%
[image:10.612.315.545.298.520.2]Error
Fig. 4: Percentage error for total checkpoint data output during Simulation B
0 10 20 30 40 50
0 200 400 600
Step
Bandwidth
(MB/s)
A B C D E
Fig. 5: File bandwidth achieved for each of the simulation categories in the original M-Phys application
highlight some of the non-determinism that can be expected from the I/O workloads in the M-Phys application. In contrast to the increasing bandwidth trend displayed in B and C, Simulations D and E display generally worse performance for their much larger dataset volumes.
We now analyze the performance of each of the simulation types across our experimental platforms using the MACSio replication.
1) Simulation A: The first simulation type is both the
Titan Archer Cab Taurus Tinis
0 100 200 300 400 500
Machine
Bandwidth
(MB/s)
[image:11.612.52.285.50.250.2](a) Default Setting (b) Node-count Striping (c) Proc-count Striping
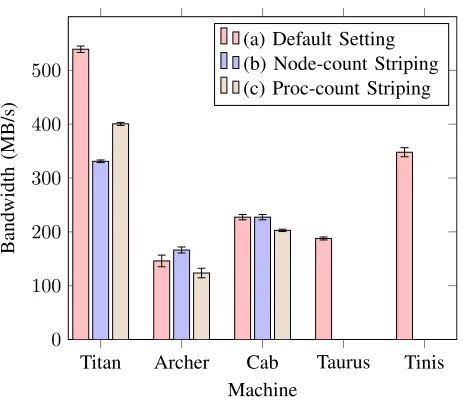
Fig. 6: File bandwidth achieved for Simulation A under different file striping conditions
system configuration; (b) with the stripe count set to 1 to match the node count; and, (c) with the stripe count set to match the number of cores used.
Figure 6 shows the mean file bandwidth achieved over the course of the simulation annotated with the calculated standard error. These results demonstrate a difference in file bandwidth on Titan for the default Lustre configuration and the modified stripe counts, with the increase and decrease in stripe count having an adverse effect on performance. A decrease in bandwidth here indicates that the performance of a small scale problem can be particularly sensitive to the underlying file system configuration when executed on such a large platform. This characteristic is not mirrored on either Archer or Cab, both of which which show much smaller variations in data throughput. Both of these machines display a small decrease in bandwidth when increasing the stripe count to match the number of processors, indicating that the problem size is suitably small that distributing it across a greater number of storage targets offers no benefit in terms of performance.
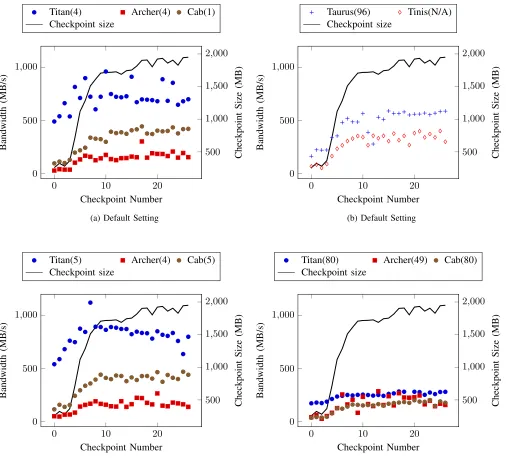
2) Simulation B and C: The changing I/O behavior of
Simulations B and C present more varied patterns with re-gards to the data transfered and the performance footprint observed. In Figure 7 the file bandwidth of each checkpoint is shown, along with the corresponding size of each checkpoint dataset. In each of the plots shown, it can be seen that the achieved file bandwidth is low initially, showing some degree of increase as the volume of data increases. The performance of each system under their default configurations is shown in Figure 7(a) and Figure 7(b), with each of the five machines demonstrating a lower checkpoint bandwidth at the beginning of the simulation than seen in Simulation A. As the simulation progresses and the size of the dataset grows, file bandwidth improves similarly for each platform, however this trend displays different profiles across platforms. Archer and Tinis achieve the slowest I/O performance, and yet
observe the largest increase in performance as the checkpoint size grows (by approximately 7.5×), suggesting that they are more sensitive to non-optimal performance from being unable to saturate file system components with smaller operations. Equally, Titan demonstrates a much smaller increasing trend on average, with a much greater fluctuation in performance making the expected bandwidth for this simulation less clear to predict.
For the three machines that allow changes to the Lustre tuning parameters1, we have made adjustments to the stripe
count used in the replication. Figure 7(c) shows the effect of aligning the node count on Titan giving more consistent I/O performance during the simulation and highlights a bandwidth peak around the time of the tenth checkpoint corresponding to 1.6 GB of output data. After this point, an increase in data volume corresponds to a degradation in performance. This would suggest that after reaching this bandwidth peak, we encounter a bottleneck with data access to the file system. This narrows down the point at which lower level characteristics of the application’s I/O should be investigated for optimizing the access on Titan to prevent the decrease in performance seen.
There is no notable difference to the performance shown when increasing the stripe number on Cab to match the nodes in the simulation. This suggests the write bandwidth to a single OST is not being saturated and hence not the limiting factor. Additionally, the stripe number on Archer matches the number of nodes so rerunning the experiment has identical performance.
The distribution of I/O access across the file system was increased by raising the stripe count to match the number of processors used in the simulation, or in the case of Archer the maximum number of storage targets. Striping across a larger number of storage targets is often recommended as a technique to prevent performance bottlenecks in Lustre when writing large volumes of data to a single shared file. In our experiments, shown in Figure 7(d), increasing this number has a negative impact on the bandwidth achievable for both Titan and Cab but does not for Archer. Increasing the striping across a much greater number of disks appears to introduce a bottleneck for the larger file system machines that could be explained by an increased load on the metadata server or with the extra communication required for transferring data to a larger pool of storage targets.
It is clear that in the two different configurations in which the Lustre file system in Archer is used that there is no notable performance difference. Distributing the data stripes across all of the available disks does not improve performance, and so we are not seeing a bottleneck due to contention for access to storage targets. The cause of this poor throughput is not entirely clear in the scope of this work, but we hope to leverage our replication tool to explore this as future work.
These results focus primarily on checkpoint bandwidths; Simulation C displays the same behavior as Simulation B,
1The default Lustre parameters on Taurus cannot be overridden by users.
500 1,000 1,500 2,000
Checkpoint
Size
(MB)
0 10 20
0 500 1,000
Checkpoint Number
Bandwidth
(MB/s)
Titan(4) Archer(4) Cab(1)
Checkpoint size
(a) Default Setting
500 1,000 1,500 2,000
Checkpoint
Size
(MB)
0 10 20
0 500 1,000
Checkpoint Number
Bandwidth
(MB/s)
Taurus(96) Tinis(N/A) Checkpoint size
(b) Default Setting
500 1,000 1,500 2,000
Checkpoint
Size
(MB)
0 10 20
0 500 1,000
Checkpoint Number
Bandwidth
(MB/s)
Titan(5) Archer(4) Cab(5)
Checkpoint size
(c) Node Count Striping
500 1,000 1,500 2,000
Checkpoint
Size
(MB)
0 10 20
0 500 1,000
Checkpoint Number
Bandwidth
(MB/s)
Titan(80) Archer(49) Cab(80)
Checkpoint size
[image:12.612.53.559.50.512.2](d) Processor Count Striping
Fig. 7: Simulation B file bandwidth (stripe count is shown in brackets)
and is therefore not presented here.
3) Simulation D and E: The most irregular I/O pattern
and largest volume checkpoints are generated by the final two classes of simulation and replicating these demonstrates further interesting characteristics. In Figure 8 we again show the bandwidth achieved for repeated runs of inputs D and E under varying striping configurations. The I/O performance for these runs is consistently higher than that seen in each of the previous workloads, achieving greater average file bandwidths on all machines and configurations.
The performance profile shows similarity to Simulation A, with the differences between configurations amplified here by the much larger checkpoint sizes. The effect of this increased
problem scale can be seen in the difference between the bandwidth achieved on Cab with striping by node count or processor count. By increasing the default striping, a 1.5× improvement is seen; however upon further increasing this striping to match processor count, only 0.7×of this bandwidth is achieved. We can identify here a similar bottleneck to that seen in Simulation B, where the distribution of the shared file over a larger portion of the file system means we are unable to saturate the storage target peak write capability.
Tinis Titan Archer Cab Taurus
0 200 400 600 800 1,000 1,200
Machine
Bandwidth
(MB/s)
Default Setting Node-count Striping Proc-count Striping
(a) Simulation D
Tinis Titan Archer Cab Taurus
0 200 400 600 800 1,000 1,200
Machine
Bandwidth
(MB/s)
[image:13.612.56.530.54.286.2](b) Simulation E
Fig. 8: File bandwidth achieved for under varied file striping conditions
application workload that might be seen on a system, it would be possible to use a predicted footprint to identify the most economical configuration for the file system. A prediction like this is something that could be of use in the procurement of a new system and provide guidance as to where effort can be directed in optimizing limiting factors for application I/O.
The performance characteristics of these workloads differ to those seen in B and C in that the greatest achievable bandwidth for each machine requires a different striping style. As stated, the performance on Cab is best when we use a number of storage targets matching the node count, however the default configuration and processor count striping achieve greater average file bandwidth for Titan and Archer respectively. It is worth noting that for Archer’s case, the number of storage targets used is in fact less that the processor count as this is the maximum available. There is however a small amount of improvement to performance under this configuration when accounting for the calculated standard error of our measure-ments. This would suggest that with the stripe count having minimal effect on this file system, the limiting factor on I/O throughput in our application is not a result of contention at the point of the storage servers or storage targets. If we were using the results of these tests to advise our possible future file system configuration, we would need to gain more detailed tracing of the I/O operations to determine the cause of the performance limitation.
In the case of Titan, increasing the striping of the file across more storage targets degrades the performance slightly. For this system, we have evidently not adequately saturated the available bandwidth to the storage targets in the original setup, meaning further striping offers no benefit. Due to the size of Titan, we can judge that I/O is not likely to be a limiting factor at this scale, however attempting to scale the simulation has
the potential to alter the I/O footprint somewhat.
A characteristic that was observed to a small extent in the first simulation but is more prevalent here is the variance in the measured performance for runs on Archer. Observing the error bars for the bandwidth measurements for Simulations D and E, it is clear that the standard error in our experiments is larger on this system than any other. We believe the cause of the increased performance unpredictability identifies a greater deal of interference from the machine being under heavy load than seen on the other platforms.
Comparing the results across the five different machines, these two workloads display more comparable performance between all systems than any of those discussed previously. In particular, there is only a small performance variation between Titan, Cab and Tinis at their respective optimal setups. This illustrates the difficulty in assessing I/O performance across systems, as different classes of system can be seen to perform similarly despite largely different peak file system bandwidths.
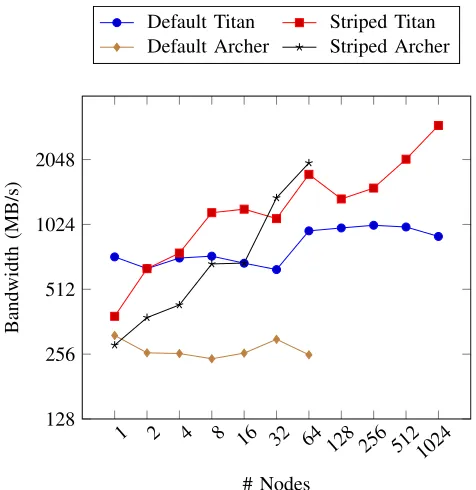
E. Workload Weak Scaling Behavior
Using our replications, we have been able to look at how the current volume and distribution in the dataset performs on each of the target platforms. So far, the scale at which these simulations are run is relatively small in accordance with the original M-Phys application. To understand how the I/O performance would be affected by scaling these simulations further, we have performed a simple scaling test using the workload parameters based on Simulation E. The volume of data per process is kept consistent and the number of nodes used is increased by a factor of two up to 1024 nodes on Titan and 64 nodes on Archer.
1 2 4 8 16 32 64 128 256 512 1024 128
256 512 1024 2048
# Nodes
Bandwidth
(MB/s)
[image:14.612.50.288.51.296.2]Default Titan Striped Titan Default Archer Striped Archer
Fig. 9: Weak Scaling for Simulation E on Titan and Archer
increasing stripe count as node count increases. Importantly, the performance we get on Archer exceeds that of Titan by the 32 node point. In our simulation workload tests on Archer up to this point, we have identified a lack of throughput in our application I/O; a greater bandwidth is achievable however with the same composition but a larger scale dataset. Therefore we suggest that these workloads are not of an optimal size to achieve good performance on Archer’s file system.
Increasing the node count and corresponding dataset size, while keeping the stripe count at the default of 4, prevents a greater file bandwidth from being achieved on both Archer and Titan. The performance observed does not decrease however, and so it is expected that the increased data volume is not yet introducing contention on the storage targets to the point that these resources have become saturated.
VI. CONCLUSION
In this paper, we have used profiling in conjunction with a configurable proxy application to replicate a range of I/O patterns in a large multi-physics application. We identify important characteristics of a workload from a limited set of Darshan log data; translating these characteristics allows us to represent the workload in a collection of parameters that protect the commercial sensitivity of the original application. The abstraction from the target application and the flexibility of the proxy application makes investigation of the I/O work-load pattern portable across different systems and file systems. To arrive at these parameters, we have used expressions for mapping the known quantities of dataset size and variation over time to a set of inputs that match the simple data model in the MACSio application. Furthermore, we have adapted a configurable proxy application to allow for more representative
I/O behavior replication of these real workloads. This adap-tation factors in the varied access patterns and data volumes exhibited by different types of output files that are used in the same simulation. In particular, we restructured the main execution body of MACSio to better mimic timestep loops and schedule interspersed checkpointing and visualization dumps in the same pattern seen in the original application.
We demonstrate that the checkpoint dataset written for each of our replications deviates from the original by on average no more than 3.05%. Additionally, we highlight the points in the simulation where inaccuracy can be introduced to the proxy dataset but confirm this does not cause a large margin of error for the overall I/O pattern.
We have also presented analysis of the performance achieved by our proxy workloads on five systems ranging from a 200 node university cluster to a leadership scale supercom-puter. The results of the analysis carried out show that the performance characteristics of each of the test platforms vary in different ways across the classes of workload we replicate. An example of this is seen in the lack of performance achieved by some of our workloads on Archer, but how this under-performance becomes less prominent when scaling up the data volumes.
In the future, we plan to perform a more detailed analysis of how the replicated workload is performing on a system with more detailed I/O data collection, recognizing the lack of scalability associated with detailed tracing. In addition, we also plan to further develop the complexity of MACSio to allow a greater deal of control on the datasets generated and investigate the I/O operations of the target application at a lower level. Finally, we intend to use the replicated workloads shown here in the testing phase for a new system installation. Ultimately, the goal of this process is to be integrated into a future procurement exercise for the next generation of system.
ACKNOWLEDGMENTS
This work was supported by the UK Atomic Weapons Es-tablishment under grant CDK0724 (AWE Technical Outreach Programme). Furthermore, Professor Stephen Jarvis is an AWE William Penney Fellow.
We would like to express our thanks to the following institutions for access to the systems featured in this work: UK Engineering and Physical Sciences Research Council (Archer), Oak Ridge National Laboratory (Titan), Lawrence Livermore National Laboratory (Cab), Technische Universitt Dresden (Taurus) and the University of Warwick Centre for Scientific Computing (Tinis).
This work would not have been possible without the as-sistance of a number of members of the Applied Computer Science group at AWE, to whom we would also like to express our gratitude.
REFERENCES
[1] S. Lang, P. Carns, R. Latham, R. Ross, K. Harms, and W. Allcock, “I/O Performance Challenges at Leadership Scale,” inProceedings of the Conference on High Performance Computing Networking, Storage
and Analysis. ACM, 2009, p. 40.
[2] S. Snyder, P. Carns, R. Latham, M. Mubarak, R. Ross, C. Carothers, B. Behzad, H. V. T. Luu, S. Byna et al., “Techniques for
Mod-eling Large-scale HPC I/O Workloads,” in Proceedings of the 6th International Workshop on Performance Modeling, Benchmarking, and
Simulation of High Performance Computing Systems. ACM, 2015, p. 5.
[3] H. Luu, B. Behzad, R. Aydt, and M. Winslett, “A Multi-level Approach for Understanding I/O Activity in HPC Applications,” in 2013 IEEE
International Conference on Cluster Computing (CLUSTER). IEEE,
2013, pp. 1–5.
[4] S. A. Wright, S. D. Hammond, S. J. Pennycook, R. F. Bird, J. Herdman, I. Miller, A. Vadgama, A. Bhalerao, and S. A. Jarvis, “Parallel File System Analysis Through Application I/O Tracing,” The Computer
Journal, p. bxs044, 2012.
[5] K. Vijayakumar, F. Mueller, X. Ma, and P. C. Roth, “Scalable I/O Tracing and Analysis,” inProceedings of the 4th Annual Workshop on
Petascale Data Storage. ACM, 2009, pp. 26–31.
[6] B. Behzad, H.-V. Dang, F. Hariri, W. Zhang, and M. Snir, “Automatic Generation of I/O Kernels for HPC Applications,” inProceedings of the
9th Parallel Data Storage Workshop. IEEE Press, 2014, pp. 31–36.
[7] N. Liu, C. Carothers, J. Cope, P. Carns, R. Ross, A. Crume, and C. Maltzahn, “Modeling a Leadership-scale Storage System,” in
Inter-national Conference on Parallel Processing and Applied Mathematics.
Springer, 2011, pp. 10–19.
[8] N. Liu, J. Cope, P. Carns, C. Carothers, R. Ross, G. Grider, A. Crume, and C. Maltzahn, “On the Role of Burst Buffers in Leadership-class Storage Systems,” in 012 IEEE 28th Symposium on Mass Storage
Systems and Technologies (MSST). IEEE, 2012, pp. 1–11.
[9] P. Carns, R. Latham, R. Ross, K. Iskra, S. Lang, and K. Riley, “24/7 Characterization of Petascale I/O Workloads,” in 2009 IEEE
International Conference on Cluster Computing and Workshops. IEEE,
2009, pp. 1–10.
[10] H. Luu, M. Winslett, W. Gropp, R. Ross, P. Carns, K. Harms, M. Prabhat, S. Byna, and Y. Yao, “A Multiplatform Study of I/O Behavior on Petascale Supercomputers,” in Proceedings of the 24th International
Symposium on High-Performance Parallel and Distributed Computing.
ACM, 2015, pp. 33–44.
[11] R. Latham, C. Daley, W.-k. Liao, K. Gao, R. Ross, A. Dubey, and A. Choudhary, “A case study for scientific I/O: Improving the flash astrophysics sode,”Computational Science & Discovery, vol. 5, no. 1,
p. 015001, 2012.
[12] J. Borrill, L. Oliker, J. Shalf, and H. Shan, “Investigation of Leading HPC I/O Performance using a Scientific-application Derived Bench-mark,” in Proceedings of the 2007 ACM/IEEE conference on
Super-computing. ACM, 2007, p. 10.
[13] “Chombo I/O benchmark,” http://www.nersc.gov/ ndk/ChomboBenchmarks/chomboIOBenchmark.html.
[14] J. H. Chen, A. Choudhary, B. De Supinski, M. DeVries, E. R. Hawkes, S. Klasky, W.-K. Liao, K.-L. Ma, J. Mellor-Crummey, N. Podhorszki
et al., “Terascale Direct Numerical Simulations of Turbulent Combustion
using S3D,” Computational Science & Discovery, vol. 2, no. 1, p.
015001, 2009.
[15] H. Shan, K. Antypas, and J. Shalf, “Characterizing and Predicting the I/O Performance of HPC Applications using a Parameterized Synthetic Benchmark,” in Proceedings of the 2008 ACM/IEEE conference on
Supercomputing. IEEE Press, 2008, p. 42.
[16] J. Logan, S. Klasky, H. Abbasi, Q. Liu, G. Ostrouchov, M. Parashar, N. Podhorszki, Y. Tian, and M. Wolf, “Understanding I/O Performance Using I/O Skeletal Applications,” inEuropean Conference on Parallel
Processing. Springer, 2012, pp. 77–88.
[17] J. Logan, S. Klasky, J. Lofstead, H. Abbasi, S. Ethier, R. Grout, S.-H. Ku, Q. Liu, X. Ma, M. Parasharet al., “Skel: Generative Software for
Pro-ducing Skeletal I/O Applications,” ine-Science Workshops (eScienceW),
2011 IEEE Seventh International Conference on. IEEE, 2011, pp. 191–
198.
[18] Y. Jin, X. Ma, M. Liu, Q. Liu, J. Logan, N. Podhorszki, J. Y. Choi, and S. Klasky, “Combining Phase Identification and Statistic Modeling for Automated Parallel Benchmark Generation,” ACM SIGMETRICS
Performance Evaluation Review, vol. 43, no. 1, pp. 309–320, 2015.
[19] J. F. Lofstead, S. Klasky, K. Schwan, N. Podhorszki, and C. Jin, “Flexible IO and integration for scientific codes through the adaptable IO system (ADIOS),” inProceedings of the 6th international workshop
on Challenges of large applications in distributed environments. ACM,
2008, pp. 15–24.
[20] J. Dickson, S. Wright, S. Maheswaran, A. Herdmant, M. C. Miller, and S. Jarvis, “Replicating HPC I/O Workloads with Proxy Applications,”
inProceedings of the 1st Joint International Workshop on Parallel Data
Storage & Data Intensive Scalable Computing Systems. IEEE Press,
2016, pp. 13–18.
[21] P. J. Braam and R. Zahir, “Lustre: A scalable, high performance file system,”Cluster File Systems, Inc, 2002.
[22] F. B. Schmuck and R. L. Haskin, “GPFS: A Shared-Disk File System for Large Computing Clusters,” inFAST, vol. 2, no. 19, 2002.
[23] M. Folk, G. Heber, Q. Koziol, E. Pourmal, and D. Robinson, “An Overview of the HDF5 Technology Suite and its Applications,” in
Proceedings of the EDBT/ICDT 2011 Workshop on Array Databases.
ACM, 2011, pp. 36–47.
[24] UK Mini App Consortium, “TyphonIO,” https://github.com/UK-MAC/ typhonio, Last Accessed 2017-03-13.