warwick.ac.uk/lib-publications
Original citation:
Jansen, Heiko T. , Leise, Tanya, Stenhouse, Gordon, Pigeon, Karine, Kasworm, Wayne,
Teisberg, Justin, Radandt, Thomas, Dallmann, Robert, Brown, Steven and Robbins, Charles
T.. (2016) The bear circadian clock doesn’t ‘sleep’ during winter dormancy. Frontiers in
Zoology, 13 (42).
Permanent WRAP URL:
http://wrap.warwick.ac.uk/81698
Copyright and reuse:
The Warwick Research Archive Portal (WRAP) makes this work of researchers of the
University of Warwick available open access under the following conditions.
This article is made available under the Creative Commons Attribution 4.0 International
license (CC BY 4.0) and may be reused according to the conditions of the license. For more
details see: http://creativecommons.org/licenses/by/4.0/
A note on versions:
The version presented in WRAP is the published version, or, version of record, and may be
cited as it appears here.
winter dormancy
Jansen
et al.
Jansenet al. Frontiers in Zoology (2016) 13:42
R E S E A R C H
Open Access
The bear circadian clock doesn
’
t
‘
sleep
’
during winter dormancy
Heiko T. Jansen
1*, Tanya Leise
2, Gordon Stenhouse
3, Karine Pigeon
3, Wayne Kasworm
4, Justin Teisberg
4,
Thomas Radandt
4, Robert Dallmann
5,7, Steven Brown
5and Charles T. Robbins
6Abstract
Background:Most biological functions are synchronized to the environmental light:dark cycle via a circadian timekeeping system. Bears exhibit shallow torpor combined with metabolic suppression during winter dormancy. We sought to confirm that free-running circadian rhythms of body temperature (Tb) and activity were expressed in torpid grizzly (brown) bears and that they were functionally responsive to environmental light. We also measured activity and ambient light exposures in denning wild bears to determine if rhythms were evident and what the photic conditions of their natural dens were. Lastly, we used cultured skin fibroblasts obtained from captive torpid bears to assess molecular clock operation in peripheral tissues. Circadian parameters were estimated using robust wavelet transforms and maximum entropy spectral analyses.
Results:Captive grizzly bears housed in constant darkness during winter dormancy expressed circadian rhythms of activity and Tb. The rhythm period of juvenile bears was significantly shorter than that of adult bears. However, the period of activity rhythms in adult captive bears was virtually identical to that of adult wild denning bears as was the strength of the activity rhythms. Similar to what has been found in other mammals, a single light exposure during the bear’s active period delayed subsequent activity onsets whereas these were advanced when light was applied during the bear’s inactive period. Lastly, in vitro studies confirmed the expression of molecular circadian rhythms with a period comparable to the bear’s own behavioral rhythms.
Conclusions:Based on these findings we conclude that the circadian system is functional in torpid bears and their peripheral tissues even when housed in constant darkness, is responsive to phase-shifting effects of light, and therefore, is a normal facet of torpid bear physiology.
Background
In the face of predictable periods of food scarcity animals have adopted a variety of survival strategies [1–3]. Two of these: hibernation and torpor, conserve energy through metabolic suppression and lowering of Tb to varying ex-tents [4–7]. Biological rhythms (e.g. circadian, circannual) of Tb and body mass are important to hibernation [8–17]. The temperature dependence of torpor/arousal cycles has also been confirmed in several species [18]. Despite these observations, a substantial body of evidence indicates that circadian rhythmicity is lost during hibernation. For example, studies in European hamsters (Cricetus cricetus)
demonstrated that the molecular clock “stops ticking” during hibernation [19]. Denning American black bears (Ursus americanus), which express only shallow torpor (3–5 °C lower Tb [3, 20]), may also have suppressed the ability to express circadian rhythms, [5, 20] and instead replaced these with multi-day cycles [21].
Because the brain contains the master circadian pace-maker in the suprachiasmatic nucleus (SCN), its role in hibernation has received considerable attention [15, 17, 22]. Those studies revealed that ablation of the SCN did not prevent the expression of activity and Tb rhythms during deep torpor in all animals, despite the animals being arrhythmic during euthermia. Other work also demonstrated that these rhythms, along with neural action potentials, are absent at Tbs between 0 and 16 °C [23, 24]. Yet, data indicating that the SCN of hibernators continues
* Correspondence:heiko@vetmed.wsu.edu
1Department of Integrative Physiology and Neuroscience, College of
Veterinary Medicine, Washington State University, Mailstop 7620 Veterinary and Biomedical Research Bldg., Room 205, Pullman, WA 99164-7620, USA Full list of author information is available at the end of the article
to be metabolically and physiologically active at even rela-tively low temperatures [22, 25–27], suggests the possibility that the SCN is capable of providing functional oversight or, alternatively, has other non-circadian roles during hiber-nation [10].
For circadian rhythms to be adequately characterized requires that subjects be held in constant environmental conditions of light and temperature thereby eliminating the major entrainment cues (Zeitgeber), especially light [28, 29]. Light resets the clock each day and keeps the animal’s physiology synchronized to local time thus match-ing that of the earth’s rotation (i.e., 24 h) [30, 31]. Constant environmental conditions have been used in some, but not all, hibernation/torpor studies (reviewed in [10]).
We recently reported that captive grizzly bears (Ursus arctos horribilis) housed in constant light (LL) and ambi-ent temperature (Ta) conditions expressed free-running circadian rhythms of activity during winter dormancy [32]. That the period of these rhythms reverted to pre-cisely 24 h (i.e., matched the natural environmental light:dark cycle period) when bears were exposed to Ta and lighting conditions or to fixed photoperiods was inter-preted as evidence that the circadian clock was responsive to light cues even during this time [32]. Yet, how light and the circadian system interact during the long winter dor-mancy experienced by denning bears has not been fully elucidated. Moreover, the benefit (if any) of maintaining rhythmicity and possibly light entrainment during winter dormancy remains to be determined.
It has become abundantly clear that loss of synchro-nization (entrainment) to environmental light:dark cycles such as occurs during jet-lag or with shift work results in increased incidence of metabolic disturbances [33–36]; this suggests that rhythmicity and entrainment are both beneficial to overall energy homeostasis [37]. Indeed, energy balance is maintained within rather narrow limits due the coordinated actions of central and peripheral clocks (see [34] for Review) leading to the current hypo-thesis that rhythmicity facilitates metabolic efficiency [38]. Further support for this comes from studies demonstra-ting that disruption of peripheral clocks in the liver and pancreas are sufficient to disrupt whole-body glucose homeostasis [39, 40]. Thus, peripheral clocks serve as an independent yet important node in the metabolic machi-nery; but whether this node is functioning in all hypome-tabolic states is less clear.
Given the variable outcomes of studies examining the circadian system in hypometabolic states we sought to clarify this issue in torpid bears. To this end, we extended our previous work to explore several other features of the circadian system, including: 1) its free-running period in constant darkness (DD) in an effort to more closely mimic photic conditions presumably experienced in a natural bear den, 2), the ability of light to phase-shift rhythms - a
basic property of the circadian clock, and 3) the integrity of the molecular clock in peripheral tissues. We also used data collected from wild bears to corroborate certain aspects of our captive bear studies.
Results
Confirmation of winter dormancy
Bears were confirmed to have entered winter dormancy based on low Tb (Fig. 1) and dramatic reduction in ac-tivity levels (>90%; Fig 2a, d; see also [32, 41]; Table 1 and 2). To further confirm the torpid state of our bears we measured Tb in 6 of the 9 bears used in the current study (4 adults, 2 juveniles) during the active (May-Oc-tober) and dormant periods (January). A significant reduc-tion in average (±SD) Tb from 37.0 °C (0.5) to 34.4 °C (0.9),p< 0.001 (Welch’sttest) was observed. The temper-atures obtained during hibernation between the two groups were virtually identical. The relationship between Tb and Ta (outdoor and indoor) over a 7-day period in late January, 2013 is shown in Fig. 1. In contrast to the large fluctuations in outdoor temperature, indoor tempe-ratures remained tightly regulated around the 7 °C set point. Tb of all the indoor bears fluctuated in a daily man-ner that was distinct from the daily Ta fluctuations while that of the single bear housed under natural conditions appeared to cycle somewhat with outdoor temperatures (Fig. 1). Additionally, while the maximum Tb in bears housed indoors was virtually identical to that of the single bear (A2o, Fig. 1) housed under natural daylight and temperature conditions, the minimum temperature in this bear was always 1–1.5 °C lower as was his average mean Tb during winter dormancy (Table 2). Body weights of all
[image:4.595.306.540.490.633.2]bears immediately prior to entering winter dormancy are listed in Additional file 1: Table S1.
Circadian rhythms
Circadian rhythms of activity and Tb were detected in all groups of bears based on wavelet transforms and max-imum entropy spectral analysis (MESA) (Figs. 2 and 3; Table 1). Specific features of these rhythms differed de-pending on group (age, wild vs. captive), but no feature was deemed arrhythmic in any analysis, with one possible exception (see Discussion, Additional file 2: Figure S4). We observed a significant main effect of group on rhythm period (i.e., length) (F (3,34) = 12.31, p< 0.0001). Activity rhythms began their free-run in constant darkness (DD) in phase with their rhythms under natural conditions (Figs. 2 and 3a,d–left panels). This was characterized by activity bouts beginning slightly earlier each day (for a period <24 h) or later each day (for a period >24) (Figs. 2 and 5a,b; Table 1). Because temperature loggers were only implanted when the bears entered winter dormancy it was not possible to assess the phase at which their free-run began. Nevertheless, the close phase relationship between Tb and activity rhythms suggests a similar onset. Analysis
of activity data revealed that the free-running period (FRP) of captive bears in DD did not differ from wild den-ning bears (Table 1). The average period of circadian activ-ity rhythms in captive torpid bears housed in DD also did not differ significantly from that of captive bears exposed to Ta and photoperiod (Table 1). Interestingly, the period of juvenile activity rhythms (≤4 years. old) was significantly shorter than that of adults in DD (Table 1, Holm-Sidak post-hoc test, p< 0.0001). The FRP of juvenile bears was also significantly shorter than 24 h (1 samplet-test, t (9) = 3.632,p= 0.0055) whereas that of the of adults was signifi-cantly longer than 24 h (1 samplet-test, t (6) = 2.530,p= 0.0447). The period of Tb rhythms in DD was similar to that of activity rhythms (mean = 23.91 ± 0.11 h; juvenile = 23.81 ± 0.22 h, adult = 24.0 ± 0.14 h, Fig. 2). However, unlike activity rhythms, the period of the Tb rhythms did not dif-fer between juvenile and adult bears (t (7) = 1.515,p= 0.16). The period of Tb rhythms also did not differ significantly from 24 h. Tb was not measured in wild bears.
The overall timing of daily activity and Tb rhythm ma-xima (acrophase) was similar (circadian time (CT) 14.9 ± 1.6 h vs. 13.8 ± 1.1 h, respectively; t (23) = 0.535, p= 0.598). However, the peaks occurred later in DD than under ambient conditions for adult bears (17.3 ± 1.8 h for DD adults vs. 11 h for a single adult bear exposed to ambi-ent conditions receiving a temperature logger; 1 sample t-test, t (5) =3.470, p = 0.0178). The acrophases of Tb and activity rhythms were similar under ambient con-ditions (12.8 ± 1.2 h vs. 12.6 h; N = 1 for ambient Tb).
[image:5.595.56.545.100.210.2]Rhythm strength varied among bear groups and with parameter measured. Thus, for all torpid bears isolated from direct human disturbance (DD and Wild denning) significantly weaker rhythms (by 50–65 %, DWT calcula-tion vs. active season (Fig. 2) were expressed compared to captive bears housed under ambient conditions and exposed to normal human disturbance occurring at the WSU Bear Center (main effect of group (F (3,33) = 6.738,p= 0.0011; Table 1). In addition, Tb rhythms were always significantly stronger than activity rhythms (66 % vs. 9 %, respectively, (t (9) = 9.895,p< 0.0001) but these
Table 1Characteristics of activity rhythms in bears during winter dormancy
CAPTIVE
DD All [12] DD Juvenile [5] DD Adult [7] Ambient [6] Wild [10] Average Activity (Counts/min) 196 ± 5 293 ± 73a 90 ± 20b 34 ± 19b 74 ± 3b
Period (h) 23.97 ± 0.11 23.75 ± 0.10a,† 24.19 ± 0.08b,† 23.99 ± 0.07c 24.03 ± 0.02b,c
Acrophase (h) 15.74 ± 1.39 14.58 ± 2.02 17.29 ± 1.81 12.53 ± 0.74 13.71 ± 0.41 Strength (%) 9 ± 1 10 ± 2a 7 ± 1a,c 17 ± 3a,b 6 ± 1a,c
Variability (h) 1.07 ± 0.1 1.06 ± 0.13a 1.09 ± 0.16a,b 1.2 ± 0.09a,b,c 1.79 ± 0.12d
Amplitude (Counts/min) 272 ± 104 425 ± 13a 94 ± 13b 45 ± 9b 78 ± 5b
a,b,c,d
Different letters within a row are significantly different from each other,p≤0.05
†Significantly different from 24 h (one samplet-test,p< 0.05)
[image:5.595.57.291.567.707.2]Numbers of animals are indicated in brackets Values are means ± SEM
Table 2Characteristics of body temperature (Tb) rhythms in
captive bears during winter dormancy
CAPTIVE
DD All [9] DD Juvenile [5] DD Adult [4] Ambient [1] Average Tb (°C) 34.4 ± 0.1 34.4 ± 0.1 34.3 ± 0.1 33.7 Min (°C) 31.7 ± 0.5 31.9 ± 0.9 31.5 ± 0.3 30.1 Max (°C) 36.3 ± 0.2 36.1 ± 0.3 36.5 ± 0.4 35.7 Period (h) 23.9 ± 0.09 23.8 ± 0.07a 24 ± 0.07 24
Acrophase (h) 17.8 ± 0.96 19.4 ± 1.8 15.3 ± 1.47 12.6 Strength (%) 66 ± 6 64 ± 10 68 ± 5 53 Variability (h) 1.3 ± 0.07 1.2 ± 0.08 1.5 ± 0.02 1.4 Amplitude (°C) 0.37 ± 0.03 0.4 ± 0 .03 0.4 ± .05 0.4
a
did not differ between age groups (t (8) = 0.3148, p= 0.761; Table 2). Analytical waveform transform (AWT) analysis allowed us to examine the instantaneous period of activity and Tb rhythms to estimate their stability over time. The results revealed that circadian rhythm stability decreased significantly ((F 3,34) = 8.781,p= 0.0002) for all torpid bears when compared to the 30 days preceding on-set of torpor (variability = 0.55 ± 0.051 h, p≤0.01 vs. cap-tive bears). The period of circadian rhythms occasionally changed from slightly less than 24 h to slightly greater than 24 h spontaneously in DD within a season - an ex-treme example is shown in Fig. 2d from an adult female bear (the change in rhythm period occurs around day 98). Minor changes appearing as ‘scalloping’similar to those previously reported for grizzly bears [32] were more typic-ally observed. Actograms of wild Candadian and U.S. grizzly bears also revealed slight scalloping in some, but not all, cases (Figs. 3 and 4).
The amplitude of activity rhythms varied significantly among groups (F(3,20) = 4.867,p= 0.0106). Juveniles had
greater amplitudes than adults (Holm-Sidak post-hoc test, p= 0.0479) and bears exposed to ambient conditions (Holm-Sidak post-hoc test,p= 0.0208; Table 1). However, the amplitude of activity cycles of torpid adult bears in DD was similar to that of wild denning bears (Table 1). Amplitudes of Tb rhythms were only determined in cap-tive bears and these did not differ between juvenile and adult bears (t (9) = 0.02402,p= 0.4464)). Activity rhythms and Tb rhythms always maintained a close temporal rela-tionship (average coherence = 0.93 ± 0.01). This relation-ship did not differ between age classes (both = 0.93; Fig. 2). As expected, Tb rhythms lagged behind activity yielding a phase difference of -5.81 ± 0.84 h; this lag time also did not differ among age classes (juvenile = -6.42 ± 0.89 h vs. adults = -4.84 ± 0.67 h, t (9) = 1.365,p= 0.2055). Mean (±SD) Ta in the isolation building were similar be-tween different years of study (winter of 2013–2014: 7.2 ± 1.1 °C; winter of 2014–2015: 7.7 ± 1 °C) based on iButton measurements collected at 30 min intervals. In the first winter of the studies (2012–2013) room temperature
a
d
e
f
b
c
[image:6.595.57.540.89.373.2]averaged 7.5 ± 1 °C based on weekly temperature measure-ments made using a calibrated digital thermometer. The average daily variation in room temperature was 0.8 °C in 2013–2014 and 0.9 °C in 2014–2015 seasons.
Light responses
We exposed torpid bears to light in several ways to probe the sensitivity of the circadian system to this potent entrainment (synchronizing) agent. Light applied symme-trically as two one-hour pulses each 12 h apart (i.e., 1:11:1:11 photoperiod) resulted in the consolidation of activity after free-runs for both juvenile and adult bears (Fig. 5). The period of activity rhythms (23.91 h) under these photic conditions did not differ significantly from the 24 h experimental photic treatment (1 sample t-test p> 0.05); however, it did differ significantly from a 12 h cycle period (1 sample t-test p< 0.01), indicating entrainment had occurred, but to only one of the cycle frequencies. Specifically, adult bears exhibited a shortening of their prior free-running period (from 24.19 h to 23.87 h; t (4) = 4.950, p= 0.0078, N= 3)) whereas in juvenile bears (N= 2) the period lengthened from 23.75 h to. 23.95 h.
In contrast to the ‘skeleton’ photoperiod used above, application of only a single daily light pulse caused activity and temperature rhythms to shift in different ways
depending on the time of circadian day that light was ap-plied. The results are summarized as a phase-response curve in Fig. 6a. Thus, activity onsets were delayed when light was applied during the bear’s active period (circadian time (CT) 0-12) whereas activity onsets were advanced when light was applied during the inactive period (CT 12-24). Another way to depict the effect of light pulses on ac-tivity is shown in Fig. 6b where acac-tivity onset during the
‘old’ phase (determined on the day of the light pulse) is compared to activity onset during the‘new’phase (after the light). This so-called ‘phase transition’ plot revealed that when light is applied at virtually any time during the bear’s inactive period (CT12-24) the clock was always strongly reset to approximately the same time (CT22) cor-responding to early morning (Fig. 6b). In contrast, light ex-posure during the active period produced a relatively proportional delay when compared to the original phase (Fig. 6b). The differences were not associated with longer light pulses because large advances were observed with 1 h light exposure (see Fig. 2c,f). Rhythm period was not always stable following a light exposure. This was observed in both captive bears in DD and in wild bears (Figs. 2 and 3); how-ever, in the case of wild bears this was only visible on sca-lograms as small deviations (Fig. 3a-c); these events were not further analyzed due to methodological limitations.
a
b
c
d
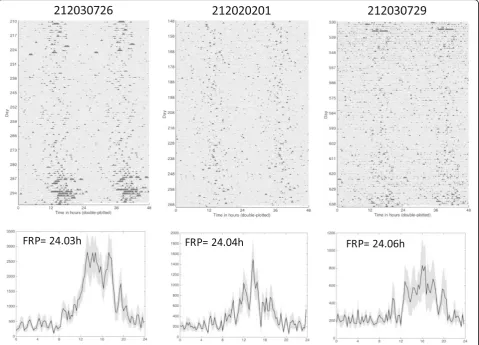
[image:7.595.56.540.90.382.2]We discovered that natural bear dens were periodically exposed to light during winter dormancy (Fig. 3a-c light plots) based on light sensors applied to collars on three wild bears (2 grizzly, 1 black) located in different ecosys-tems with different latitudinal gradients (Fig. 3d). The average (±SD) daily light exposures during the first 70 days of hibernation for which reliable activity and light data could be obtained due to battery life limitations were: Bear G111 = 4.32 (63.98) lux; Bear G275 = 0.67 (6.21) lux, Bear BB401 = 0.23 (1.08) lux). Light intensity (Additional file 3: Figure S1A) and duration (Additional file 4: Figure S2) were also found to vary dramatically among dens (range 5–85 min in Canadian brown bears and 15–800 min in the Idaho black bear). Light exposures were often inter-spersed by days to weeks of very low light (<5lux). We observed a noticeable effect of light in the natural den on the amplitude of activity rhythms when examining sca-lograms (Fig. 3a-c). Here, light exposure nearly always resulted in a dramatic increase in rhythm amplitude (e.g., Bear G111, Fig. 3a). The highest activity counts were also often associated with the most intense light exposure, although increased activity sometimes was observed
without intense light, especially in the two bears that gave birth in the den (G275, BB401) (Additional file 3: Figure S1A). Light exposure seemed to occur most frequently around noon and was often associated with the largest activity bouts (Additional file 3: Figure S1B). Interestingly, activity rhythms disappeared entirely after parturition for the two females who gave birth in their dens at night (Fig. 3b,c arrows); rhythms then either remained absent (BB401) or disappeared after brief reappearance (G275) (Additional file 5: Figure S3A,B), respectively.
In vitro rhythms
[image:8.595.59.539.89.434.2]rhythms during winter dormancy (p > 0.05 for both; Ta-bles 1 and 2). Bear serum also resulted in a significant increase in the amplitude of the Bmal1 rhythm by ap-proximately 3-fold, irrespective of season (Fig. 7a,c; Table 3).
Discussion
Using a variety of experimental approaches in captive bears and observations of naturally denning bears, we now pro-vide the most compelling epro-vidence to support the operation of a circadian clock during winter dormancy in brown and
black bears. This was confirmed first by demonstrating that activity and Tb rhythms free-ran in constant conditions, a feature that also reveals their endogenous nature. Second, the biological clock was reset or shifted when exposed to single pulses of light applied at discrete times of the circa-dian cycle. Third, daily symmetrical light exposure caused activity bouts to coalesce and assume a 24 h periodicity. Fourth, fibroblasts obtained from dormant bears expressed robust clock-gene rhythms. Moreover, the period of this molecular rhythm closely matched that of the bear’s own activity and Tb rhythms but only under conditions where
A
B
[image:9.595.58.539.88.521.2]bear serum was used. Importantly, our findings of activity rhythms in captive bears were corroborated in wild bears. The present results are therefore entirely consistent with our earlier report of circadian rhythmicity in captive dor-mant bears [32] and together reveal that rhythmicity is a normal facet of torpid bear physiology.
Compared to the daily rhythms expressed in captive bears during the active (feeding) season, the activity rhythms of torpid bears were much weaker. They were however virtu-ally identical in strength to their denning counterparts in the wild, indicating that the general conditions we used in our isolation experiments were comparable to those experi-enced by wild bears. Yet, based on the consistency of our findings it is surprising that others have not observed similar rhythms in hibernating bears, especially since those studies
used bears exposed to environmental light and temperature fluctuations [20, 21] as some of our captive (ambient) and wild bears were. Aside from a species difference (black vs. grizzly), which seems unlikely given that we saw rhythms in a hibernating wild black bear, at least three possible expla-nations for this difference can be envisioned, although they are not necessarily mutually exclusive. The first relates to the low amplitude/strength of the activity rhythms in our captive bears (5–10 %), which if present in earlier studies may have been associated with correspondingly low
B
A
Fig. 6Phase-Response (a) and Phase-Transition (b) plots for all captive bears exposed to light pulses (1–4 h) in two consecutive years. The phase-response plot illustrates the relationship between the timing of the light pulse and shift in activity observed for several days after the light pulse was applied. The phase-transition plot illustrates the relationship between the‘old’phase (when light was applied) versus the‘new’phase (following the light exposure)
A
B
C
Fig. 7aLuminescence tracings of individual bear fibroblast cultured under different serum conditions. Fibroblasts were infected with a lentivirus construct containing the mouse Bmal1 promoter linked to the luciferase gene (see Methods for more details). Cultures are rhythmic but peaks occur at different times depending on the serum condition used. Inset represents the mean traces under each serum condition.
[image:10.595.312.539.86.509.2] [image:10.595.57.295.88.464.2]temperature rhythms and thereby escaped detection due to methodological differences. Arguing against this is the fact that our temperature rhythms were actually more robust than the activity rhythms and were easily detected even when we used identical analytical methods as the earl-ier studies (e.g., Lomb-Scargle periodogram; data not shown) [21, 32]. Second, subcutaneous Tb rhythms could reflect a fundamentally different output of the circadian clock than core Tb measured using intraperitoneal im-plants. We also view this as unlikely since activity, a faithful reflection of master clock integrity, remained rhythmic and was phase-locked to temperature, even under different photic conditions. The third possibility relates to differences in den temperatures between studies. In the case of the Alaska and Wyoming black bears, outside temperatures and corresponding den temperatures frequently dropped below 0 °C for extended periods [20, 21] causing bears to shiver [21]. Thus, shivering may have masked an underlying circadian Tb rhythm as a result of the bear’s need to thermo-regulate. Since our bears were held at a constant 7 °C and had relatively large body masses (>125 kg) when entering winter dormancy, this presumably placed them above a Tb that eliminated the need for shivering [21], allowing rhythms to be unmasked. This hypothesis however, remains to be tested. A final possibility, related to the third, is that poor body condition upon entering the den could have masked or suppressed Tb rhythms in an effort to conserve energy. This is based on observations from a single juvenile wild female brown bear (213052006) who had only an estimated 8.4 % body fat in August at the time of capture. This bear entered the den in November (adiposity unknown) and promptly ceased to exhibit any clear rhythmicity (Additional file 2: Figure S4). Then, in March, rhythmicity reappeared coinci-dent with dramatic re-entrainment to the daily light: dark cycle visible as daily delays in activity onset until activity bouts were fully synchronized to dawn and dusk around the end of April. Although not conclusive, the data from this single case are indicative of a somewhat earlier than normal den exit perhaps due to the depletion of fat reserves and the need to obtain food.
[image:11.595.57.538.111.207.2]We were also able to confirm in bears another feature of the circadian clock found in many other species [42–44], namely, a longer circadian period in older animals com-pared to younger ones. Previous studies had shown that dramatic changes in circadian period occurred around the time of puberty whereupon the clock“slows”leading to an adult circadian period that is generally longer than that of juveniles [44], consistent with our results. Because our younger bears had just entered their fourth year and there-fore had not reached full sexual maturity [45] our compa-risons are between different aged bears; thus, we cannot ascribe the change specifically to sexual maturation or to a particular hormone. However, future studies could address this by measuring reproductive hormones in blood in com-bination with estimating circadian period under constant conditions in a captive setting. The differences in rhythm period among life stages of bears could have interesting consequences during winter dormancy. For example, female grizzly bears den with cubs from birth and for several winters afterwards [45–48]. It is conceivable there-fore that a female and cubs in a family group denning together in constant conditions would drift out of phase with one another by about 10–15 min per day (based on our current circadian estimates) and in opposite directions. Over time, the net effect of this drift would be overall acti-vity in the den appearing virtually continuous and possibly arrhythmic, eventually returning to a rhythmic condition, and so on. Whether the cubs then influence the mother’s activity rhythm or the cubs are masking the mother’s rhythm is unclear; however, examination of the pre- and post-parturition activity patterns of the two pregnant wild bears in our study (Additional file 4: Figure S2) clearly reveals a reduction in amplitude and virtual arrhythmicity of the mother bear (Fig. 3b,c). This apparent loss of rhyth-micity due to reductions in activity corroborates previous findings made in pregnant bears [49]. Additional analysis of hibernating family groups consisting of older cubs would be required to determine whether this phenomenon is lim-ited to cubs-of-the year or is a general feature of denning female bears with offspring.
Table 3Circadian characteristics ofBmal1:lucrhythms in bear fibroblasts obtained from winter dormant bears and exposed to fetal
bovine serum (FBS) or bear serum from different seasons
Bear ID Period (h) Amplitude (cnts/s)
FBS Dormant Serum Active Serum FBS Dormant Serum Active Serum Juv#1 [23.8]† 24.7 ± 0.14 23.75 ± 0.07 23.3 ± 0 240 ± 4.21 712 ± 36 571 ± 164 Juv#2 [24] 23.9 ± 0.28 23.05 ± 0.07 23.7 ± 0 273 ± 54.9 1124 ± 58 1008 ± 223 Juv#3 [23.7] 24.5 ± 0.28 23.3 ± 0 23.15 ± 0.07 168 ± 17.9 471 ± 28 514 ± 63 Juv#4 [23.7] 24.5 ± 0.21 23.45 ± 0.07 23.05 ± 0.21 167 ± 18.07 445 ± 29 528 ± 83 Average 24.39 ± 0.13a 23.44 ± 0.12b 22.94 ± 0.11c 234 ± 24a 781 111b 749 ± 101b
†Values in brackets represent the period (h) of the same bear’s winter dormant activity rhythm in DD for comparison
a,b
Responsiveness to an environmental synchronizing cue, such as light, is a hallmark of circadian systems. This was confirmed during winter dormancy in the current study by robust light-induced phase shifts in captive bears as well as light-associated activity changes in denning wild bears. Together, these observations expand our understanding of the behavioral ecology of bears to now include a dynamic responsiveness to a relevant environmental cue, even while dormant. The general pattern of responses to light, i.e., activity onsets delayed when exposed during the inactive period and advanced in the active period, generally mimic those seen in other mammals [50]. However, the marked effect of light to reset the clock to early morning irrespec-tive of when it was applied during the inacirrespec-tive period was unexpected [50] for two reasons. First, the light intensity was low (~200lux). Second, the light duration that caused the largest phase shifts was often the shortest (1 h vs. 4 h). Collectively, these results suggest that bears are exquisitely sensitive to light during hibernation, itself rather surprising since during the active season bears use food to more effectively organize their behavior than light [32]. This apparent shift however could explain their temporal flexi-bility [51]. Indeed, only short daily (1 h) pairs of light pulses were sufficient to accomplish entrainment, which is con-sistent with extensive work done in other species [52]. Our findings in wild bears also appear to support these conclusions. However, a remaining question pertinent to denning wild bears is whether they shift their body position towards/away from a light source as a behavioral adaptation or if light exposure occurred incidentally. Given that our wild bears had light sensors affixed to collars on the neck, it is possible that the eyes were facing away from the light source when exposure occurred.
The maintenance of circadian rhythmicity and light entrainment by bears during winter dormancy may be important to optimize metabolic function. For example, metabolic rate could be directly proportional to circadian strength and could explain why rhythms disappeared (or were masked) in bears from earlier studies, i.e., their meta-bolic threshold was reached. In fact, the reduction in rhythm strength we observed in torpid bears(~50 %) is similar, but not as low as the metabolic suppression (60– 75 %) previously reported for bears [5, 53, 54] suggesting that the putative threshold may not have been reached in our bears. Alternatively, even a weak (low amplitude) cir-cadian rhythm may be necessary to maintain lower meta-bolic rate until challenged with extreme thermal or other demands. This would not be entirely surprising given the mounting evidence indicating that loss of rhythmicity and desyncrhony are associated with adverse metabolic outcomes [34, 37, 55]. Indeed, recent evidence suggests that rhythmicity in biological gene expression networks of eukaryotes as diverse as yeast, fruit flies, and mice serve to optimize metabolic costs, in part by modulating rhythm
amplitude [38]. Thus, it is likely that a threshold of circa-dian amplitude exists beyond which the presumed cost/ benefit relationship is lost. For example, it’s possible that a torpid, anorectic, denning female bear loses rhythmicity when faced with the additional metabolic demands of lac-tation. Similarly, a bear entering the den in poor body condition (low adiposity and unable to produce cubs if fe-male [56]) might dispense with circadian rhythmicity altogether to maximize survival. Irrespective of these pos-sibilities, the reduction in rhythm amplitude we observed, rather than a complete loss of rhythmicity could be viewed as evidence to support a metabolic optimization strategy. Nevertheless, precisely how rhythmicity, Tb and metabolic costs in shallow heterotherms are related remains to be determined.
Using data obtained from a small number of wild den-ning bears fitted with light sensors we were able to deter-mine that those bear dens received periodic light exposure despite significant snow cover (based on environmental monitoring station, camera data at den sites and site visits to the U.S. black bear den). We now can confirm that wild hibernating bears are exposed to the same stimulus–light (albeit of different intensities), that was used in our captive studies to shape activity and Tb patterns. Thus, winter dor-mancy in bears provides a valid, physiologically relevant, condition in which to further explore the influence of light on the circadian clock independently of the confounding influence of food entrainment [32] and over many months. This ability to explore clock function without the conta-minating influence of food anticipatory activity [57] holds great promise for our basic understanding of how central and peripheral clocks are organized.
Overall, our behavioral and physiologic results provide strong support for the existence of a functional circadian clock in torpid bears during winter dormancy. Although the Tb rhythms differ significantly from daily torpor bouts seen in some birds [58], they do suggest a lower Tb set point in torpid bears and one that is defended. Indeed, earlier findings in black bears by Tøien [5] were interpreted to indicate that Tb cycles were the result of a“regulated” process, distinct from a passive hypothermic response [59]. The similar maximum daily Tb of our bears housed in constant temperature versus the bear exposed to natural temperature changes would support this conclusion. Thus, these earlier findings combined with our current ones would suggest that bears are capable of maintaining a tightly regulated torpor around a lower Tb set point and over multiple timescales. Together, these features appear to place winter dormant bears somewhere between“true” hibernators and shallow heterotherms [59].
necessary to confirm clock operation in other ways, such as by examining the molecular clock directly. Circadian clocks are distributed in tissues throughout the body [60] and these provide a readily available means to assess clock operation [61]. We therefore collected skin fibroblasts from winter dormant bears and infected these cells with a len-tiviral clock gene (Bmal1) construct linked to luciferase enabling a real-time luminescent readout in vitro [61]. Our findings of robust rhythms in fibroblasts obtained from the same animals whose activity and Tb rhythms were con-firmed during winter dormancy now provides direct proof that a functioning biological clock is an inherent feature of dormant grizzly bear physiology. Our findings stand in stark contrast to those in European hamsters (Cricetus cricetus) whose clock“stops” during hibernation [19] and to arctic reindeer (Rangifer tarandus), who don’t hibernate, but lose their behavioral and molecular rhythms in winter when measured using similar techniques to ours [62]. Somewhat to our surprise, the period of bear fibroblast rhythms required the bear’s own serum to match that observed in vivo. These results suggest that humoral factors may play additional roles in maintaining circadian integrity of the entire metabolic engine of these animals. Because we performed our culture experiments at 37 °C and since lower culture temperatures also appear to influence fibro-blast circadian period in a homeotherm [63] it remains to be determined what influence different culture tempera-tures and serum combinations have on these bear rhythms.
Conclusion
In conclusion, we provide both in vivo and in vitro evidence supporting the expression of circadian rhythms in bears during winter dormancy. These findings, along with earlier work in grizzly bears [64] and polar bears add to the mounting evidence that these closely related species may exhibit an evolutionarily advanced form of torpid biology [65, 66].
Methods
Animals
Captive grizzly bears were housed at the Washington State University (WSU) Bear Research, Education and Conser-vation center as described previously [32]. Bears of both sexes were used and ranged in age from 2 to 12 years and weighed between 127 and 331.3 kg (Additional file 1: Table S1) at the time of winter dormancy. Bears younger than 5 years old were considered juveniles. Environmental light and activity data were also obtained from two wild grizzly bears in Alberta, Canada (2013), one black bear in Idaho in 2011 and seven wild grizzly bears (2011–2013) in Montana, USA.
Captive bears entered winter dormancy following the naturally declining appetite and withdrawal of all food in late October. This is typically followed by a >90 % decrease
in activity (standing) in early-mid December [41]. In six of the same captive bears used in the current study Tb was also measured during both the active and dormant seasons (see Results) using a digital rectal thermometer. Once dormant, the captive bears were moved to an isolation building where constant conditions of temperature and light could be maintained [32]. Bears in isolation were housed individually in culvert type enclosures [32] from November to March in each of three consecutive winter dormancy seasons (2012–2013, 2013–2014, and 2014– 2015). The internal dimensions of the enclosures (LxWxH) measured 2.4 x 1.2 x 1.2 M. Enclosures were provided with elevated grating and drainage and all bears were provided waterad libitium. No food was provided. All isolation stud-ies began with constant darkness (DD) followed by one or more light applications (detailed below). When not housed in isolation, bears were housed in larger enclosures and exposed to ambient light and temperature fluctuations (for details see [32]). Wild bears were captured, fitted with collars containing GPS transmitters and accelerometers according to accepted standards. Wild grizzly bears in Alberta were fitted with Followit® GPS iridium satellite collars. These collars were programmed to record locations every hour during the non-denning period and once in the den locations were attempted daily until den emergence. In Montana and Idaho, wild bears were fitted with Telonics GPS collars (Models 4500 and 4590 Telonics, Mesa, AZ). The collars were programmed to record locations every two hours during the non-denning period. Wild bears were allowed to enter winter dormancy naturally and were left undisturbed by the researchers. Body weights of wild bears at the time of den entry were not determined.
Activity and Tb monitoring
year-round. We collected Actiwatch activity and light data at 5 min intervals to extend battery life and enabling data to be collected for most of the winter dormancy period. The activity data from accelerometers housed within the U.S. GPS collars were also collected at 5 min intervals and in one case were collected over multiple years. Accelero-meter data for all devices are interpolated in real-time to yield a single integrated value (counts) per sampling interval.
Tb data were collected in captive bears using data log-gers (iButton, DS1922L; Maxim Integrated, Inc., San Jose, CA) implanted subcutaneously in the axial region. Prior to implanting the iButtons were warmed to 50 °C, dipped in M-coat W1 wax (Vishay Precision Group, Malvern, PA) and allowed to dry. The dipping process was repeated 5 times followed by cold (gas) sterilization. Bears were anesthetized and the implant site prepared as described below for biopsy sampling. Bears tolerated the coated loggers well as indicated by minimal scar tissue forming at the implant site, absence of adhesions, and no evidence of irritation. Once the studies were completed, bears were re-anesthetized, the loggers were removed, and the skin re-sutured. Tb was also measured during the active season and winter dormancy in six anesthetized captive bears that had not been implanted with loggers at the time. For this, a digital rectal thermometer was used while the bears were undergoing unrelated procedures. Three Tb measurements were taken over approximately a one-hour time period and the average temperature determined. Temperature logger data were collected from each bear at 30 min intervals. One bear housed under ambient conditions also received a temperature logger. Identically prepared iButtons were also placed in the isolation building housing the bears to record Ta and at the same frequency. Temperature loggers and digital rectal thermometer were calibrated against a mercury thermometer using a water bath. Sensitivity of the temperature loggers was programmed for 0.0625 °C. The resultant accuracy of both devices was determined to be ±0.1 °C.
Lighting and photocycles
Full spectrum fluorescent bulbs (GE; 32 W, 6500 K, model F32T8 SP65 ECO) 2 bulbs/isolation chamber) were used to provide approximately 200 lux of light at the bear’s eye level, roughly 2 meters from the light source. Light inten-sity naturally varied depending on the bear’s position with the chamber. To generate phase-response curves, light was applied in pulses ranging from 1–4 h in duration depending on the year of the study. In the first year, a light regimen consisting of 1 h light (L) interspersed with 11 h of darkness (D) was applied to explore entrainment (i.e. synchronization to a daily photocycle (1 L:11D:1 L:11D). This photocycle was maintained for 40 days. In year two, a single light pulse of 4 h duration was applied. This was
followed by two 1 h pulses each 30 days apart and at fixed times of the day for all bears although the exact circadian time varied depending on when the light was applied and the bear’s own free-running period (see below). In year three, only a single 4 h pulse was used and this was applied at the same time of day for all bears. These photo-cycles are similar to those used in many previous studies in other species to probe circadian and entrainment pro-perties [52].
Data analysis
Activity and temperature data were analyzed using custom MATLAB scripts written to run the computations, and making use of two freely available toolboxes: JLAB [67] and WMTSA [68]. JLAB was employed to compute the analytic wavelet transform (AWT) scalogram and ridges using the Morse wavelet function with β= 10 and γ= 3; see Lilly & Olhede [69] for further details. WMTSA, companion software to the book [70], was used to com-pute the translation-invariant discrete wavelet transform (DWT) with the Daubechies least-asymmetric filter of length 12. All calculations were run in MATLAB R2015a (The MathWorks, Natick, MA). MATLAB scripts to run the computations are available on request. See [71, 72] for details on wavelet analyses.
Because we applied light pulses at fixed times with no knowledge of the bear's circadian phase at which they were applied until the experiment ended, we needed a method to accurately determine circadian time (CT). To this end, CT6 was defined as activity peak (CT0 = onset of activity, assuming ~ 12 h period of activity) and then map-ping this phase onto at least 10 consecutive days of ac-tivity prior to applying a light pulse. The number of days (range = 10–20) varied depending on the stability of the rhythm expressed in DD. Light-induced phase shifts were then identified by mapping the same phase (CT6) onto 2–4 days of data following light application at which point the time-difference between the pre- and post-light phases was calculated. By convention, negative values re-flect phase delays whereas positive values rere-flect phase ad-vances [52]. Phase shifts were only determined for activity due to the discrete nature of the data.
assess the rhythm’s amplitude. Circadian strength equals the proportion of variance in the 12–64 h period band and was determined from the DWT circadian component of the time series. Acrophase was computed from the peaks of the DWT circadian component of the time series. The tempo-gram display of the temperature record shows the positive portion of the summed circadian details covering the 0.5– 32 h frequency band.
The comparative analysis of activity and Tb also involved multiple methods. The phase difference between the rhythms was assessed in three ways: (1) using the sine-fit period and phase of the DWT circadian components (12– 64 h period band), (2) the lag corresponding to the first peak of the cross-correlation of the DWT circadian com-ponents (4–64 h period band), and (3) the phase of the peak spectral coherence of the mean-subtracted time series. The spectral coherence is defined as the magnitude-squared coherence function (square of the Fourier transform of the cross-correlation divided by the product of the Fourier transforms of the autocorrelations of the two time series) using Welch's overlapped averaged periodogram method and was computed using MATLAB’s mscohereandcpsdwith a Hamming window of 2 weeks.
Cell culture
Four juvenile bears were anesthetized during winter dor-mancy as previously described [32]. An area of the rump was shaved and surgically prepared. A small skin sample was collected using a 6 mm biopsy punch and immediately placed in Dulbecco’s Modified Eagle’s Medium (DMEM) supplemented with 4500 mg/l glucose, 50 % Fetal Bovine Serum (FBS) and 1 % pennicillin/streptomycin solution at 4 °C until processed as follows. Each tissue sample was disrupted mechanically by trituration and the dispersed cells incubated in warm DMEM supplemented with 20 % FCS, 1/100 amphotericin B (Sigma A2942) and 0.2 ml Liberase Blendzyme 3 at 37 °C and 5 % CO2for about 6 h.
The digested tissue was then washed in phosphate buffered saline (PBS) and re-suspended in DMEM with 20 % FCS and amphotericin B, and placed under a Millipore Millicell CM membrane disc and left overnight at 37 °C. On the following day, the membrane was removed, the cells were washed with PBS, and incubated in DMEM supplemented with either 10 % FCS, 10 % bear dormant serum or 10 % bear active season serum, all containing 1 % Penicillin/ Streptomycin, and L-glutamine and cultured overnight. The cells were then infected with a mouseBmal1-luciferase encoding lentivirus, synchronized with dexamethasone and the luminescence measured for 5 days at 37 °C using a luminometer as described previously [61].
Statistical analysis
Group-wise comparisons were made by one-way Analysis of Variance or Kruskal-Wallis test where appropriate.
Post-hoc comparisons were made following Holm-Sidak correc-tion. Statistical analyses were performed using Prism 6.0 (Graphpad Software, Inc., La Jolla, CA). P values≤0.05 were considered statistically significant.
Additional files
Additional file 1:Table S1.Body weights (kg) of captive bears just prior to entering winter dormancy. (PDF 630 kb)
Additional file 2:Figure S4.Actograms (A) and scalograms (B,C) of a wild female grizzly bear during early denning (winter 2012-B) and mid-winter dormancy to den exit (2013-C) illustrating the lack of rhythmicity and subsequent re-appearance of locomotor rhythmicity prior to and at the time of den emergence (arrow). Day 71 corresponds to Nov. 8, 2012 in panel B. Day 1 corresponds to Jan. 1, 2013 in panel C. * - first day of noticeable entrainment (2012); Arrow–date of den exit based on GPS location fix. (PDF 630 kb)
Additional file 3:Figure S1.A. Relationship between activity counts and light intensity for three denning wild bears. B. Relationship between time of light exposure and time of the largest activity bout in the same three bears shown in A. All times local. (PDF 109 kb)
Additional file 4:Figure S2.Frequency distribution of light exposures (minutes at >5lux) for three wild bears fitted with activity and light sensors. Data are grouped into 10 min bins. (PDF 631 kb)
Additional file 5:Figure S3.Daily (24 h) activity profiles and scalograms of activity data from two denning pregnant wild bears (A–black bear; B–grizzly bear) before and after birth. Note the general reduction (and eventually loss) of rhythms after parturition. Activity in Panel B post-birth is artificially elevated due a voltage offset being introduced as the battery power was declining in this Actiwatch. (PDF 627 kb)
Acknowledgments
The authors greatly acknowledge the assistance of the many WSU bear center student volunteers. We also acknowledge Jamie Gehring, Kimberly Rigano, Joy Erlenbach, Terry Larsen, Karen Graham, and Alex Welander for their help with these studies.
Funding
This work was supported by the Interagency Grizzly Bear Committee, Raili Korkka Brown Bear Endowment, Bear Research and Conservation Endowment (HTJ, CTR), and the funding partners of the Foothills Research Institute Program (GS, KP). SB and RD were supported in part by funding from the Swiss National Science Foundation. WK, TR and JT are supported by the U.S. Fish and Wildlife Service. Montana and Idaho collared wild bear data were provided by the Cabinet-Yaak and Selkirk Mountains research and monitoring programs of the U.S. Fish and Wildlife Service and their funding partners.
Authors’contributions
HTJ, CTR, GS, SB, and WK conceived of and designed the study. HTJ, GS, KP, WK, JT, TR, RD and SB collected the data. HTJ and TL performed statistical analysis of the data. TL generated the Matlab scripts for circadian analysis. All authors helped draft the manuscript and approved the final version.
Competing interests
The authors declare that they have no competing interests.
Ethics approval and consent to participate
t.leise@amherst.edu). Data available from the Dryad Digital Repository: http:// dx.doi.org/10.5061/dryad.mg430.
Author details
1Department of Integrative Physiology and Neuroscience, College of
Veterinary Medicine, Washington State University, Mailstop 7620 Veterinary and Biomedical Research Bldg., Room 205, Pullman, WA 99164-7620, USA.
2
Department of Mathematics and Statistics, Amherst College, Amherst, MA 01002, USA.3Foothills Research Institute, Hinton, AB T7V 1X6, Canada.4U.S.
Fish and Wildlife Service, Libby, MT 59923, USA.5Institute for Pharmacology
and Toxicology, University of Zürich, Zürich 8057, Switzerland.6School of the
Environment, Washington State University, Pullman, WA 99164, USA.7Present address: Warwick Medical School and Warwick Systems Biology Centre, University of Warwick, Gibbet Hill Road, Coventry CV4 7AL, UK.
Received: 6 April 2016 Accepted: 22 August 2016
References
1. Mrosovsky N. Hibernation and the hypothalamus. New York: Appleton; 1971. 2. Vuarin P, Henry PY. Field evidence for a proximate role of food shortage in
the regulation of hibernation and daily torpor: a review. J Comp Physiol B. 2014;184:683–97.
3. Hellgren EC. Physiology of hibernation in bears. Ursus. 1998;10:4670–477. 4. Klug BJ, Brigham RM. Changes to metabolism and cell physiology that
enable mammalian hibernation. Springer Sci Reviews. 2015;3:39–56. 5. Tøien Ø, Blake J, Edgar DM, Grahn DA, Heller HC, Barnes BM. Hibernation in
black bears: independence of metabolic suppression from body temperature. Science. 2011;331:906–9.
6. Geiser F. Metabolic rate and body temperature reduction during hibernation and daily torpor. Ann Review Physiol. 2004;66:239–74. 7. Carey HV, Andrews MT, Martin SL. Mammalian hibernation: cellular and
molecular responses to depressed metabolism and Low temperature. Physiol Rev. 2003;83:1153–81.
8. Kortner G, Geiser F. The temporal organization of daily torpor and hibernation: circadian and circannual rhythms. Chronobiol Int. 2000;17:103–28.
9. Mrosovsky N. Mechanisms of hibernation cycles in ground squirrels: circannian rhythm or sequence of stages? Penn Acad Sci. 1970;44:172–5. 10. Ruby NF. Hibernation: when good clocks go cold. J Biol Rhythms.
2003;18:275–86.
11. Daan S. Periodicity of heterothermy in the garden dormouse,Eliomys Quercinus(L.). Neth J Zool. 1973;23:237–65.
12. Menaker M. The free running period of the Bat clock; seasonal variations at Low body temperature. J Cell Comp Physiol. 1961;57:81–6.
13. Pohl H. Temperaturregulation und tagesperiodik des stoffwechsels bei winterschläfern. Z Vgl Physiol. 1961;45:109–53.
14. Pohl H. Circadian pacemaker does not arrest in deep hibernation - evidence for desynchronization from the light cycle. Experientia. 1987;43:293–4. 15. Ruby NF, Dark J, Heller HC, Zucker I. Suprachiasmatic nucleus: role in
circannual body mass and hibernation rhythms of ground squirrels. Brain Res. 1998;782:63–72.
16. Ruby NF, Ibuka N, Barnes BM, Zucker I. Suprachiasmatic nuclei influence torpor and circadian temperature rhythms in hamsters. Am J Physiol. 1989;257:R210–5.
17. Zucker I, Boshes M, Dark J. Suprachiasmatic nuclei influence circannual and circadian-rhythms of ground-squirrels. Am J Physiol. 1983;244:R472–80. 18. Malan A. Is the torpor-arousal cycle of hibernation controlled by a
Non-temperature-compensated circadian clock? J Biol Rhythms. 2010;25:166–75. 19. Revel FG, Herwig A, Garidou ML, Dardente H, Menet JS, Masson-Pevet M,
Simonneaux V, Saboureau M, Pevet P. The circadian clock stops ticking during deep hibernation in the European hamster. Proc Natl Acad Sci U S A. 2007;104:13816–20.
20. Harlow HJ, Lohuis T, Anderson-Sprecher RC, Beck TDI. Body surface temperature of hibernating black bears May Be related to periodic muscle activity. J Mammal. 2004;85:414–9.
21. Toien O, Blake J, Barnes BM. Thermoregulation and energetics in hibernating black bears: metabolic rate and the mystery of multi-day body temperature cycles. J Comp Physiol B. 2015;185:447–61.
22. Ruby NF, Dark J, Heller HC, Zucker I. Ablation of suprachiasmatic nucleus alters timing of hibernation in ground squirrels. Proc National Acad Sci U S A. 1996;93:9864–8.
23. Williams CT, Barnes BM, Richter M, Buck CL. Hibernation and circadian rhythms of body temperature in free-living arctic ground squirrels. Physiol Biochem Zool. 2012;85:397–404.
24. Miller JD, Cao VH, Heller HC. Thermal effects on neuronal-activity in suprachiasmatic nuclei of hibernators and nonhibernators. Am J Physiol. 1994;266:R1259–66.
25. Ruby NF, Burns DE, Heller HC. Circadian rhythms in the suprachiasmatic nucleus Are temperature-compensated and phase-shifted by heat pulses in vitro. J Neurosci. 1999;19:8630–6.
26. Kilduff TS, Miller JD, Radeke CM, Sharp FR, Heller HC. 14c-2-Deoxyglucose uptake in the ground squirrel brain during entrance to and arousal from hibernation. J Neurosci. 1990;10:2463–75.
27. O'Hara BF, Watson FL, Srere HK, Kumar H, Wiler SW, Welch SK, Bitting L, Heller HC, Kilduff TS: Gene expression in the brain across the hibernation cycle. J Neurosci. 1999;19:3781–90.
28. Aschoff J. Exogenous and endogenous components in circadian rhythms. In: Cold spring harbor symposia on quantitative biology, vol. 25. Cold Spring Harbor, Long Island: Cold Spring Harbor Press; 1960. p. 11–26. 29. Pittendrigh CS. Circadian rhythms and circadian organization of living
systems. In: Cold spring harbor symposium on quantitative biology, vol. 25. Cold Spring Harbor, Long Island: Cold Spring Harbor Press; 1960. p. 159–82.
30. Johnson CH, Elliott JA, Foster R. Entrainment of circadian programs. Chronobiol Int. 2003;20:741–74.
31. Golombek DA, Rosenstein RE. Physiology of circadian entrainment. Physiol Rev. 2010;90:1063–102.
32. Ware JV, Nelson OL, Robbins CT, Jansen HT. Temporal organization of activity in the brown bear (Ursus Arctos): roles of circadian rhythms, light, and food entrainment. Am J Physiol Regul Integr Comp Physiol. 2012;303:R890–902. 33. Eckel-Mahan K, Sassone-Corsi P. Metabolism and the circadian clock
converge. Physiol Rev. 2013;93:107–35.
34. Green CB, Takahashi JS, Bass J. The meter of metabolism. Cell. 2008;134:728. 35. Maury E, Ramsey KM, Bass J. Circadian rhythms and metabolic syndrome:
from experimental genetics to human disease. Circ Res. 2010;106:447–62. 36. Shi SQ, Ansari TS, Mcguinness OP, Wasserman DH, Johnson CH. Circadian disruption leads to insulin resistance and obesity. Curr Biol. 2013;23:372–81. 37. Gerhart-Hines Z, Lazar MA. Circadian metabolism in the light of evolution.
Endocr Rev. 2015;36:289–304.
38. Wang GZ, Hickey SL, Shi L, Huang HC, Nakashe P, Koike N, Tu BP, Takahashi JS, Konopka G. Cycling transcriptional networks optimize energy utilization on a genome scale. Cell Rep. 2015;13:1868–80.
39. Sadacca LA, Lamia KA, Delemos AS, Blum B, Weitz CJ. An intrinsic circadian clock of the pancreas is required for normal insulin release and glucose homeostasis in mice. Diabetologia. 2011;54:120–4.
40. Lamia KA, Storch KF, Weitz CJ. Physiological significance of a peripheral tissue circadian clock. Proc Natl Acad Sci U S A. 2008;105:15172–7. 41. Robbins CT, Lopez-Alfaro C, Rode KD, Toien O, Nelson OL. Hibernation and
seasonal fasting in bears: the energetic costs and consequences for polar bears. J Mammal. 2012;93:1493–503.
42. Hagenauer MH, King AF, Possidente B, Mcginnis MY, Lumia AR, Peckham EM, Lee TM. Changes in circadian rhythms during puberty inrattus norvegicus: developmental time course and gonadal dependency. Horm Behav. 2011;60:46–57.
43. Lee TM, Hummer DL, Jechura TJ, Mahoney MM: Pubertal development of sex differences in circadian function: an animal model. Ann N Y Acad Sci. 2004;1021:262–5.
44. Hagenauer MH, Perryman JI, Lee TM, Carskadon MA. Adolescent changes in the homeostatic and circadian regulation of sleep. Dev Neurosci. 2009;31:276–84.
45. Schwartz CC, Miller SD, Haroldson MA. Grizzly bearUrsus Arctos. In: Feldhamer GA, Thompson BC, Chapman JA, editors. Wild animals of North America: biology, management, and conservation. 2nd ed. Baltimore: The Johns Hopkins University Press; 2003. p. 556–86.
46. Nelson RA, Folk GE, Pfeiffer EW, Craighead JJ, Jonkel CJ, Steiger DL: behavior, biochemistry, and hibernation in black, grizzly and polar bears. In Int Conf Bear Res And Manage; Madison, Wisconsin. 1983: 284–290. 47. Craighead JJS, J.S.; Mitchell, J.A. : the grizzly bears of Yellowstone: their ecology in the Yellowstone ecosystem, 1959–1992 Washington D.C.: Island Press; 1995.
49. Friebe A, Evans AL, Arnemo JM, Blanc S, Brunberg S, Fleissner G, Swenson JE, Zedrosser A: Factors affecting date of implantation, parturition, and den entry estimated from activity and body temperature in free-ranging brown bears. Plos One. 2014;9(7):e101410.
50. Dunlap JC, Loros JJ, Decoursey PJ, editors. Chronobiology: biological timekeeping. Sunderland: Sinauer Associates, Inc; 2004.
51. Fortin JK, Ware JV, Jansen HT, Schwartz CC, Robbins CT. Temporal niche switching by grizzly bears but not American black bears in Yellowstone National Park. J Mammal. 2013;94:833–44.
52. Refinetti R. Circadian physiology. 2nd ed. New York: Crc Press; 2006. 53. Watts PD, Cuyler C. Metabolism of the black bear under simulated Denning
conditions. Acta Physiol Scand. 1988;134:149–52.
54. Watts PD, Oritsland NA, Hurst RJ. Standard metabolic rate of polar bears under simulated Denning conditions. Physiol Zool. 1987;60:687–91. 55. Peek CB, Ramsey KM, Marcheva B, Bass J. Nutrient sensing and the circadian
clock. Trends Endocrinol Metab. 2012;23:312–8.
56. Lopez-Alfaro C, Robbins CT, Zedrosser A, Nielsen SE. Energetics of hibernation and reproductive trade-offs in brown bears. Ecol Model. 2013;270:1–10.
57. Mistlberger RE. Circadian food-anticipatory activity: formal models and physiological mechanisms. Neurosci Biobehav Rev. 1994;18:171. 58. Ruf T, Geiser F. Daily torpor and hibernation in birds and mammals.
Biol Rev. 2015;90:891–926.
59. Geiser F, Currie SE, O'shea KA, Hiebert SM. Torpor and hypothermia: reversed hysteresis of metabolic rate and body temperature. Am J Physiol-Regul Integr Comp Physiol. 2014;307:R1324–9.
60. Mohawk JA, Green CB, Takahashi JS. Central and peripheral circadian clocks in mammals. Annu Rev Neurosci. 2012;35:445–62.
61. Brown SA, Fleury-Olela F, Nagoshi E, Hauser C, Juge C, Meier CA, Chicheportiche R, Dayer JM, Albrecht U, Schibler U. The period length of fibroblast circadian gene expression varies widely among human individuals. Plos Biol. 2005;3, E338.
62. Lu W, Meng QJ, Tyler NJ, Stokkan KA, Loudon AS. A circadian clock is Not required in an arctic mammal. Curr Biol. 2010;20:533–7.
63. Izumo M, Johnson CH, Yamazaki S. Circadian gene expression in mammalian fibroblasts revealed by real-time luminescence reporting: temperature compensation and damping. Proc Natl Acad Sci U S A. 2003;100:16089–94.
64. Hershey JD, Robbins CT, Nelson OL, Lin DC. Minimal seasonal alterations in the skeletal muscle of captive brown bears. Physiol Biochem Zool. 2008;81:138–47.
65. Nelson RA. Black bears and polar bears - still metabolic marvels. Mayo Clin Proc. 1987;62:850–3.
66. Lennox AR, Goodship AE. Polar bears (Ursus Maritimus), the most evolutionary advanced hibernators, avoid significant bone loss during hibernation. Comp Biochem Physiol-Mole Integr Physiol. 2008;149:203–8. 67. Lilly JM, jLab. A data analysis package for Matlab, v. 1.6.2. 2016. http://www.
jmlilly.net/jmlsoft.html.
68. Cornish C. Wmtsa Wavelet Toolkit For Matlab, Release_0-2-6_20060823. http://www.atmos.washington.edu/~wmtsa/; 2006.
69. Lilly JM, Olhede SC. On the analytic wavelet transform. Ieee Trans Information Theory. 2010;57:4135–56.
70. Percival DB, Walden AT. Wavelet methods for time series analysis. New York: Cambridge University Press; 2000.
71. Leise TL. Wavelet analysis of circadian and ultradian behavioral rhythms. J Circadian Rhythms. 2013;11:5.
72. Leise TL, Harrington ME. Wavelet-based time series analysis of circadian rhythms. J Biol Rhythms. 2011;26:454–63.
73. Dowse HB. Analyses for physiological and behavioral rhythmicity. In: Johnson ML, Brand L, editors. Methods in enzymology, vol. 454. Burlington: Academic; 2009. p. 141–74.
• We accept pre-submission inquiries
• Our selector tool helps you to find the most relevant journal
• We provide round the clock customer support
• Convenient online submission
• Thorough peer review
• Inclusion in PubMed and all major indexing services
• Maximum visibility for your research
Submit your manuscript at www.biomedcentral.com/submit