Original citation:
Xu, Yuanwei and Rodger, P. Mark. (2015) Improved estimation of density of states for Monte Carlo sampling via MBAR. Journal of Chemical Theory and Computation.
http://dx.doi.org/10.1021/acs.jctc.5b00189
Permanent WRAP url:
http://wrap.warwick.ac.uk/71886
Copyright and reuse:
The Warwick Research Archive Portal (WRAP) makes this work of researchers of the University of Warwick available open access under the following conditions. Copyright © and all moral rights to the version of the paper presented here belong to the individual author(s) and/or other copyright owners. To the extent reasonable and practicable the material made available in WRAP has been checked for eligibility before being made available.
Copies of full items can be used for personal research or study, educational, or not-for-profit purposes without prior permission or charge. Provided that the authors, title and full bibliographic details are credited, a hyperlink and/or URL is given for the original metadata page and the content is not changed in any way.
Publisher’s statement:
“This document is the Accepted Manuscript version of a Published Work that appeared in final form in Journal of Chemical Theory and Computation copyright © American Chemical Society after peer review and technical editing by the publisher.
To access the final edited and published work see
http://dx.doi.org/10.1021/acs.jctc.5b00189
http://pubs.acs.org/page/policy/articlesonrequest/index.html].” A note on versions:
The version presented here may differ from the published version or, version of record, if you wish to cite this item you are advised to consult the publisher’s version. Please see the ‘permanent WRAP url’ above for details on accessing the published version and note that access may require a subscription.
Improved estimation of density of states for
Monte Carlo sampling via MBAR
Yuanwei Xu
∗,†and P. Mark Rodger
∗,‡Centre for Scientific Computing, University of Warwick, Coventry, UK, and Centre for
Scientific Computing and Department of Chemistry, University of Warwick, Coventry, UK
E-mail: [email protected]; [email protected]
Abstract
We present a new method to calculate the density of states using the Multistate
Bennett Acceptance Ratio (MBAR) estimator. We use a combination of parallel
tem-pering (PT) and multicanonical simulation to demonstrate the efficiency of our method
in a statistical model of sampling from a two-dimensional normal mixture and also in
a physical model of aggregation of lattice polymers. While MBAR has been commonly
used for final estimation of thermodynamic properties, our numerical results show that
the efficiency of estimation with our new approach, which uses MBAR as an
interme-diate step, often improves upon conventional use of MBAR. We also demonstrate that
it can be beneficial in our method to use full PT samples for MBAR calculations in
cases where simulation data exhibit long correlation.
∗To whom correspondence should be addressed
†Centre for Scientific Computing, University of Warwick, Coventry, UK
1
Introduction
Systems with rugged energy landscapes are very common in physics, biology and chemistry.
Crucial to understanding such systems is to have a comprehensive and efficient sampling of
the configuration space that makes optimal use of available computational resources. Monte
Carlo (MC) methods have been widely used to study such systems. The basic Metropolis
algorithm,1although commonly used, will most likely be trapped in a local energy basin when
temperature is low. Many advanced algorithms have been proposed to improve sampling
efficiency, and the choice of which algorithm to use largely depends on the nature of the
system in question.
Generally speaking, the MC methods used to study physical and chemical systems can be
broadly classified into two categories: based and energy-based. In
temperature-based methods, the system is simulated at one or several predefined temperatures and the
Boltzmann weight is used; examples of such methods include the classical Metropolis
algo-rithm, simulated tempering2,3 and parallel tempering.4,5 One deficiency of these methods,
apart from the actual sampling, is that quantities like the free energy and entropy are not
directly accessible. Fortunately, advances in free energy calculation greatly facilitate analysis
of simulation data with much higher statistical efficiency than earlier methods. For example,
in the Weighted Histogram Analysis Method6 (WHAM), the density of states (DoS) are
esti-mated by optimally combining estmates from each simulation after discretizing energy with
a suitable resolution; and in the Multistate Bennett Acceptance Ratio (MBAR) method,7
the problem of calculating free energy differences is treated as a problem in estimating the
ratio of normalizing constants and it uses extended bridge sampling theory to derive
sta-tistical estimators that are proven to be optimal. MBAR removes discretization of energy,
is capable of directly producing estimates of free energy and equilibrium expectations, and
thus obviates the need to calculate the density of states.
In contrast to temperature-based methods, energy-based methods usually work in a
Landau algorithm,9 and transition matrix Monte Carlo10,11 are examples of such methods.
A common feature of the aforementioned algorithms is that the DoS is refined iteratively so
that the resulting energy histogram is approximately flat. One could either reweight these
biased samples to obtain properties with respect to the canonical ensemble or use the density
of states produced from the final iteration to calculate thermodynamic properties, in which
case the histogram should be sufficiently flat to provide acceptable accuracy.
While it is generally considered a merit that methods like the Wang-Landau algorithm
allow for a quick exploration of the whole energy spectrum, there are situations where this is
not always desirable. For example, the range of potential energy in complex systems could
span several orders of magnitude. Two implications are that computationally, the time
needed to traverse all energy levels in a random walk increases as the square of energy range;
and that practically, it might be the case that only part of the configuration space, hence a
subset of all accessible energy levels, are of interest. This suggests that instead of directly
applying energy-based methods, which assumes no prior knowledge about the system, we
may initially run a temperature-based simulation and then, based on the information we
have collected, apply one of the energy-based methods to a reduced range of energy.
In this paper, we report an approach to derive estimates of the density of states from
the MBAR estimator. In WHAM, these estimates come out naturally because histograms
are used. However, since WHAM solves a self-consistent equation concerning the DoS and
free energy, this discretization will introduce error to free energy estimates which in turn
causes DoS estimates to be inaccurate. In contrast, MBAR does not require discretization
of energy so this error in free energy is removed.
To illustrate how this idea can be applied in practice, we use a combination of parallel
tempering (PT) and multicanonical sampling (MUCA) in two examples: a statistical example
to demonstrate the correctness of the method, and a lattice-polymer example to demonstrate
the efficiency and utility of the method in real physical models.
model we are interested in. Although parallel tempering is a powerful algorithm to simulate
bead-polymer systems, which are often characterized by many local energy minima, it can
become inefficient in situations where the system undergoes a phase change that resembles
a first-order phase transition. Because there is a steep change in energy, the transition rate
between low and high energy states can be low even if the chosen temperature difference is
small. In contrast, by sampling from the multicanonical ensemble, the sampler can move
freely in energy space because a flat energy histogram will be produced with good estimates of
the density of states. As the weights used in multicanonical simulation area priori unknown,
they are normally set to be equal to one at the start of the simulation, indicating that the
system is started from the disordered state with all configurations equally likely. This means
that the sampler may have difficulty sampling low energy configurations whose phase space
volume is proportionally smaller than high energy configurations, and so it may take some
time to produce “working estimates” of the density of states.
This suggests that there can be merit in using an estimated DoS from PT as the weights
of a MUCA simulation. However, it is not straightforward to obtain reliable estimates of
DoS given data of a PT simulation due to correlated sampling. A natural approach would
be using the WHAM method by following the advice of Ref. 12. In this paper we show that
an efficient alternative is to use the MBAR estimator instead.
This paper is organized as follows. Section 2 shows how MBAR can be used to produce
optimal estimates of DoS. Section 3 discusses two approaches to applying the idea to
par-allel tempering simulations. Section 4 demonstrates the method with two models. We also
compare both approaches of Section 3 with the common practice of using MBAR directly to
2
Estimating density of states using MBAR
Suppose independent canonical simulations have been carried out at K temperatures. The
probability density function of energy U at inverse temperatureβ is given by
p(U|β) = Z(β)−1Ω(U)e−βU,
where Z(β) = R Ω(U)e−βUdU is the configurational partition function and Ω(U) is the
density of states.
Consider a discretization of U in the energy range sampled from the K simulations.
Instead of including all energy levels that have been seen, it is possible to ignore those that
are close to the high energy end of the spectrum and so are rarely sampled. In this way
one can reduce the range of the spectrum to include only interesting system events, e.g.
phase transitions, although results associated with the highest temperature distribution are
then likely to be inaccurate. Let {Um}Mm=1 be the midpoints of energy bins and ˆΩkm be the
estimate of Ω(Um) from the simulation at temperature level k, given by
ˆ
Ωkm =Z(βk)eβkUmHkm/(Nk∆U), (1)
where Hkm is the histogram count of energy bin m at temperature level k, Nk is the
number of samples from simulationk, and ∆U is the bin width. We can write down estimates
of log Ω(Um) from each temperature by taking the logarithm of (1):
log ˆΩ1m = logZ(β1) +β1Um+ logH1m−log(N∆U)
log ˆΩ2m = logZ(β1) + log Z(β2) Z(β1)
+β2Um+ logH2m−log(N∆U)
.. .
log ˆΩKm = logZ(β1) + log
Z(βK)
Z(β1)
+βKUm+ logHKm−log(N∆U).
Because it is only needed to determine log Ω up to an additive constant, we see that
the terms logZ(β1) and log(N∆U) can be ignored, and only logZ(βk)/Z(β1), k= 2, . . . , K
need to be estimated; but these are precisely the dimensionless free energy differences. To
best estimate these quantities, we use the Multistate Bennett Acceptance Ratio(MBAR)
estimator,7 which is a generalization of the Bennett Acceptance Ratio(BAR) method13 to
multiple thermodynamic states. MBAR has been proven to be optimal in the sense that it
has the lowest variance among all reweighting estimators and is asymptotically unbiased.14
Note that there will be K independent estimates of the density of states in (2). Since
MBAR also yields uncertainty estimates of the free energy differences, it followes naturally
that the estimates log ˆΩkm should then be weighted inversely proportional to their variances.
3
Working with parallel tempering simulation
The parallel tempering simulation4,5 simultaneously simulates the system at multiple
tem-peratures that form a temperature ladder. A key step in PT is the exchange of configurations
between neighbouring temperatures to speed up the mixing of chains simulated at low
tem-peratures, thus enabling the lowest temperature chain to escape from local energy basins
with the help of high temperature chains, whose distributions are more flat.
Because a PT simulation yields data from all temperatures, it is natural to think of
applying the method in Section 2. However, the exchange step that makes PT effective also
introduces correlations between temperature trajectories. This violates the independence
assumption in Section 2, so subsampling is needed to remove the correlation (Section 3.1).
In Section 3.2, however, we show that there are situations in which it is justifiable to use
3.1
Using a subsampled PT trajectory
To deal with the correlation introduced in PT, a reordering of temperature trajectories by
so called replicas may be applied if we have recorded the history of temperature swaps.
Here each replica contains blocks of configurations sampled at different temperatures and
are nearly independent.12 In doing so, the main contribution to the correlation now comes
from within each replica, and this is the correlation that results from correlated sampling
in MCMC simulations. Subsampling with a suitable statistical inefficiency g > 1 can then
be applied to each replica to obtain effectively uncorrelated data. We point out that once
g is known, we can use it to subsample the original temperature trajectory because it is
equivalent to first subsampling the replicas and then permuting the subsampled replica back
by temperature.
Instead of constructing multiple replicas, we use a subsampling strategy suggested by
Chodera.1 We construct a new time series defined by u
t =PKk=1βkU(xkt), from each
tem-perature trajectory in the PT simulation, and then use the statistical inefficiency of {ut}Nt=1
for subsampling. The rationale is that if the reduced potential of a single-temperature
sim-ulation provides a practical estimate for the relaxation time of the trajectory, as suggested
by Shirts and Chodera, then an extension to the multi-temperature case should be given by
the utdefined above, where the exponential of−ut effectively gives the overall relative
prob-ability of observing a sample in the product state space of the parallel tempering simulation.
3.2
Using a full PT trajectory
We note that the estimating equations of MBAR can still be applied to correlated datasets,
but the estimated uncertainties will no longer be valid.7 Thus if one wishes to report
statisti-cal uncertainties of any MBAR estimator, subsampling is required whenever simulation data
are correlated. However, there are reasons why using full PT samples may still be an option
here. First, our DoS estimates are not used to produce thermodynamic properties; rather,
they are the weights to be used in the subsequent MUCA simulation. Second, MBAR is not
used as a final step to obtain free energy differences or other thermodynamic quantities; it is
only used as an intermediate step to estimate the log ratio of partition functions in (2).
Ev-idently, the optimal combination of log Ω estimators based on their variances will no longer
apply if full PT samples are used. However, if we had subsampled data with long
correla-tions, the resulting subsample size would be small and the uncertainty estimates may still be
unreliable. This is because MBAR estimators are derived under the asymptotic limit, and so
the estimated standard deviation will only reflect its true value when the sample size is large.
Furthermore, a result from statistics15states that the variance of the Monte Carlo estimator
for the expectation of some function of state, constructed from a subsampled Markov chain,
is no smaller than the variance of the estimator constructed from the full Markov chain. An
implication of this result is that variance of a full sample MBAR estimator may be smaller
than the variance of a subsample MBAR estimator.
From the above observations, a simple alternative to using a subsampled PT trajectory,
which also avoids complications associated with computing statistical inefficiency, is to feed
into MBAR the full dataset from the PT simulation, ignore uncertainty estimates of the
computed free energy differences, and average over the resulting estimates in (2). In the
last step, if bin width ∆U is small, then we may only average over those log ˆΩkm whose
corresponding entries in Hkm are greater than some small integer, say 1 or 2, because the
calculation is likely to be unreliable if there is only one observation in the bin.
4
Numerical Study
In this section, we present two examples where PT samples interesting regions of
config-uration space but suffers from low swap rate in the vicinity of a transition temperature.
We apply the method in Section 2 to accurately estimate the density of states from the
that, for these two examples, the additional MUCA simulation is trivial in the sense that it
will produce a more or less flat energy historgram sufficient for analysis, without needing to
implement multicanonical recursions as in Ref. 16.
The first example (Section 4.1) is designed to mimic a phase transition by sampling from
a mixture of two-dimensional normal distributions with suitably chosen parameters. The
advantage of using a statistical model is that exact results can be obtained relatively
eas-ily through numerical integration, so that we know whether different simulation methods
perform correctly. The second example (Section 4.2), inspired by reality, concerns the
simu-lation of the aggregation of lattice-polymers in an implicit membrane and water environment.
Since this model exhibits a phase transition between aggregated and dispersed states, the
statistical model may be viewd as a simplified, low-dimensional analog of the physical model,
with the benefit of knowing correct solutions.
To facilitate our study, we have used the pymbar module7 for MBAR calculations. The
PT and MUCA simulations were run with our own code. Details of the simulation protocol
not mentioned in text can be found in Supporting Information.
4.1
A statistical example
Consider a mixture of bivariate normal distributions defined by
π ∼0.5N(µ1,Σ1) + 0.5N(µ2,Σ2),
where the mean vector and covariance matrix of the two distributions are given by µ1 =
[0,0]T, Σ
1 = diag[0.01,0.01] and µ2 = [2,2]T, Σ2 = diag[2,2]. We define the energy
function to be U(x) = −logπ(x) and implement a PT sampler that samples from πT ∝
exp(−U(x)/T) with temperatures listed in Table 1. We then followed the procedure
de-scribed in Section 2 and Section 3 to estimate the density of states from the PT simulation.
these estimates. Once this was done, MUCA simulations were run with weights proportional
to the inverse of the estimated density of states. In this example, 10 independent MUCA
simulations with different initial configurations randomly generated from π were run. We
refer the approach that uses subsampled PT as PTMBARMUCA, and the approach that
[image:11.612.165.450.219.274.2]uses full PT as FPTMBARMUCA.
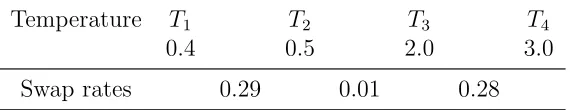
Table 1: Temperatures used and associated PT swap rates observed in the statistical model.
Temperature T1 T2 T3 T4
0.4 0.5 2.0 3.0
Swap rates 0.29 0.01 0.28
The swap rate between T2 and T3 in the PT simulation was observed to be only 1%
(Ta-ble 1). Because the interval [T2, T3] contains T = 1, which is when πT = π, the observed
frequency implies that transitions between the two modes in π are rare under the currrent
parameter setting.
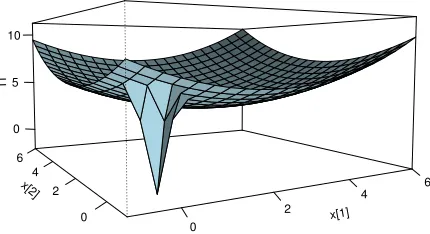
The parameters of π were chosen to mimic a broad high energy state and a narrow low
energy state. A plot of the energy surface is shown in Figure 1. Because we are interested
in quantities that vary with temperature, our goal is not just to sample from π, which
corresponds to T = 1, but to ensure efficient crossing between the two states. This is
different from common practice in statistics where one would use a temperature ladder
1 = T1 < . . . < TK and only the lowest temperature distribution is of interest. Instead, in
our setting the temperatures can be chosen as any positive values, and the relatively large
difference between T2 and T3 was chosen to test if our method can sustain large gaps in the
temperature ladder across a phase transition.
Two properties were calculated: the mean potential energyhU(x)iand heat capacityCv.
For a given inverse temperature β = 1/T,
hU(x)iT =
−R
π(x)βlogπ(x)dx R
x[1]
0
2
4 6 x[2]
0 2 4 6
U
[image:12.612.201.416.140.257.2]0 5 10
Figure 1: The energy surface in the statistical example: U(x) =−logπ(x).
and
(Cv)T =
hU2(x)i
T − hU(x)i2T
T2 .
We note that both hU(x)iT and (Cv)T can be calculated through numerical integration,
and so correct results are known. The Rpackagecubaturewas used to perform the
integra-tion. For all integration results, the estimated relative errors were of order 10−5. In Figure 2,
we show separately the estimated potential energy and heat capacity across a series of
tem-peratures between T1 = 0.4 andT4 = 3.0 using both the subsampled and full PT trajectory,
along with exact integration results. Clearly, the estimates show good agreement with the
correct values of potential energy and heat capacity, whether or not subsampling is used.
For comparison, we also used MBAR to obtain directly the estimates as well as
uncer-tainties of thermodynamic quantities of interest, which was the original purpose of MBAR
when it was introduced in Ref. 7. We note that although its use for PT simulations was
obtain effectively uncorrelated data. This approach will be refered to as PTMBAR.
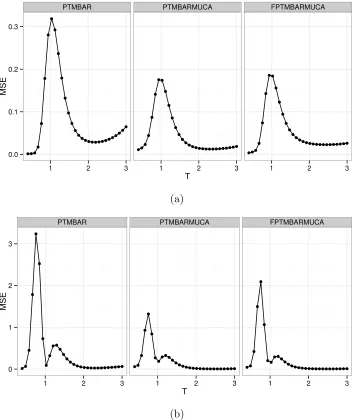
Since exact numerical integration results are known, a detailed error analysis can be
conducted to investigate the quality of estimation for different methods. We used the Mean
Squared Error (MSE) as a quality measure. The MSE of an estimator is defined as the average
squared deviation between the estimator and its true value, and so takes into account both
the variance and the bias of the estimator. To inspect the performance of the methods in
different temeprature ranges, we show pictorially the MSE of potential energy (Figure 3a)
and heat capacity (Figure 3b) across all temperatures for all methods.
The MSE plots suggest that both PTMBARMUCA and FPTMBARMUCA have
consis-tently smaller MSEs than PTMBAR across almost all temperatures, in particular, the MSEs
are significantly smaller when T is around 1. In addition, larger MSE was observed in both
energy and heat capacity estimates of PTMBAR when T is close to 3; as is also reflected in
the PTMBAR plots in Figure 2, where relatively large error bars are observed near T = 3
and, in particular, deviations from the exact values of heat capacity exceed one standard
deviation.
4.2
A lattice-polymer study
The work in this paper was originally motivited by a special protein transport mechanism
known as the Twin-Arginine Translocation (Tat) pathway.17 It is involved in the export of
proteins in bacteria cytoplasmic membrane and in thylakoid membrane in plants. The Tat
mechanism holds promising applications in the area of bioengineering due to the unique
twin-arginine motif within a signal peptide that, when attached to a protein, allows the protein
to translocate across the membrane without having to unfold. Despite much experimental
progress, many aspects of this complex process remain unknown. One key step in Tat is
the formation of the translocation pore, a channel which comprises variable amounts of the
membrane protein TatA and that can vary its diameter to allow certain types of substrates
PTMBAR PTMBARMUCA FPTMBARMUCA
−2 0 2 4 6
1 2 3 1 2 3 1 2 3
T
U
(a)
PTMBAR PTMBARMUCA FPTMBARMUCA
2.5 5.0 7.5 10.0
1 2 3 1 2 3 1 2 3
T Cv
[image:14.612.130.484.134.556.2](b)
Figure 2: Estimated potential energy (Figure 2a) and heat capacity (Figure 2b) from three methods. The exact numerical integration results are shown in red curves. In FPTMBAR-MUCA, averages of log ˆΩkm for each bin mover all temperaturesk withHkm >2 were used.
PTMBAR PTMBARMUCA FPTMBARMUCA
0.0 0.1 0.2 0.3
1 2 3 1 2 3 1 2 3
T
MSE
(a)
PTMBAR PTMBARMUCA FPTMBARMUCA
0 1 2 3
1 2 3 1 2 3 1 2 3
T
MSE
[image:15.612.129.486.141.561.2](b)
and dissociation of TatA; for simulations, this means that an effective sampling of both
aggregated and dispersed states becomes crucial.
Our model is essentially an adaptation of the H-P model.19 A protein is represented
as a sequence of non-overlapping beads on a three-dimensional cubic lattice with periodic
boundary, and the type of each bead can be either hydrophobic (H) or hydrophilic (P).
The environment is represented by a one-particle lattice site energy term that is either
hydrophobic (membrane) or hydrophilic (water). For the current method-validation study
we restrict our attention to a simpler lattice polymer which exhibits no secondary structure.
Details of the interaction potential can be found in Supporting Information.
Since TatA consists of a transmembrane region and another region that is water-soluble,20
we have studied two polymers with 34 beads each, the first 12 of which are H-beads and
the rest are P-beads. Pull moves21 and translation moves were used as trial moves. A PT
simulation was run with a total of 3×10⁷ iterations, the temperature ladder and associated
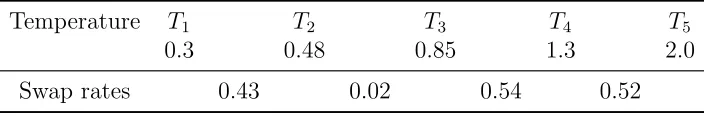
[image:16.612.130.482.450.508.2]swap rates for this model are listed in Table 2.
Table 2: Temperatures used and associated PT swap rates observed in the lattice-polymer model.
Temperature T1 T2 T3 T4 T5
0.3 0.48 0.85 1.3 2.0
Swap rates 0.43 0.02 0.54 0.52
With the potential energy function used in this study, the hydrophobic section of the
polymer was observed to remain in the membrane in the temperature range studied whereas
the hydrophilic section was able to explore both water and membrane regions. While it is
entropically favorable for the polymers to move independently, there is an energetic tendency
for the hydrophilic tails of both polymers to interact with each other within the membrane
and form a dimer. The equilibrium of the system is a balance between these two driving
forces. At high temperatures, the entropy dominates, and at low temperatures, the energy
mention that, when multiple polymers are included, our model may also be adapted to
study aggregate assembly in general protein aggregation processes.
In Section 4.1 we were mainly concerned with the correctness of the methods, and hence
used a simple model which could be solved exactly. In this section we turn to the question
of efficiency by using a model with more realistic complexity. As a result, while we continue
to compare three approaches (PTMBAR, PTMBARMUCA and FPTMBARMUCA), we
proceed as follows: we used all 3×10⁷ iterations of PT for analysis with PTMBAR, whereas
for the latter two approaches only the first 2× 10⁷ iterations were used to estimate the
DoS, and this was then followed by an additional 1×10⁷ iterations of MUCA. Hence the
computational effort is roughly equal for all three methods.
In order to obtain error estimates, we ran 10 independent MUCA simulations using
different initial configurations that belonged to both aggregated and dispersed states. The
results of potential energy and heat capacity calculated from the three methods are shown
in Figure 4. Since exact values are not known a priori in this case, the results are overlayed
to check for self-consistency. Uncertainty estimates are also compared for four temperature
points which cover the peak region of the heat capacity curve, i.e. the transition between
aggregated and dispersed states.
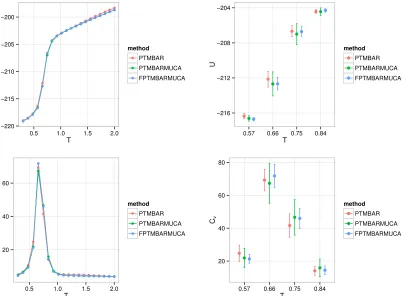
The first point to notice is that energy and heat capacity estimates agree very well for
all three methods; in particular, the peak of the heat capacity occurs around T = 0.66,
and differences between the mean values calculated by the methods are not statistically
significant at any of the four temperature points considered. Note that these temperatures
were purposely chosen around the transition temperature since property estimates at these
temperatures are most likely to suffer from incomplete sampling of the two states. The
uncertainty plots suggest that the method of PTMBARMUCA has larger statistical errors
than PTMBAR; however, with FPTMBARMUCA, that is, with the DoS estimated using
full PT trajectory, we obtain errors that are no worse, and often smaller, than PTMBAR.
−220 −215 −210 −205 −200
0.5 1.0 1.5 2.0
T U method PTMBAR PTMBARMUCA FPTMBARMUCA −216 −212 −208 −204
0.57 0.66 0.75 0.84
T U method PTMBAR PTMBARMUCA FPTMBARMUCA 20 40 60
0.5 1.0 1.5 2.0
T Cv method PTMBAR PTMBARMUCA FPTMBARMUCA 20 40 60 80
0.57 0.66 0.75 0.84
[image:18.612.103.506.184.480.2]T Cv method PTMBAR PTMBARMUCA FPTMBARMUCA
Figure 4: Estimated mean potential energy (top row) and heat capacity (bottom row) along with their uncertainties for the lattice polymer aggregation model. Results are overlayed. The methods with additional MUCA simulations only used half as many PT samples as the method of PTMBAR. In FPTMBARMUCA, an average of the equations in (2) over non-zero entries of Hkm was used. The plots in the second column show the uncertainties
by the strength of correlation in the PT trajectory. The statistical inefficiency in the lattice
polymer model is about 12 times larger than that in the statistical model of Section 4.1.
Although more iterations were used, the polymer model posed a more significant sampling
problem because the dimension of the configuration space got much bigger. Hence, for
PTMBARMUCA, the subsample size may still be inadequate for obtaining reliable estimates
of the uncertainties of the terms in (2). On the other hand, taking averages over the estimates
would seem to be a better option here, but would be too arbitrary in the statistical model.
Lastly, we mention that although we used multiple MUCA simulations and calculated
standard deviation of the estimates obtained from each run, a resampling technique known as
bootstrap22can be used to obtain error estimates and replace multiple runs which, however,
do serve a useful purpose for convergence check. In bootstrap methods, one generates by
sampling with replacement many sets of bootstrapped samples called resamples from the
original data, and use the distribution of the resamples to approximate the distribution of the
population. When we have dependent data, as is the case for most Monte Carlo simulations,
the resamples need also preserve the dependence structure and the so called block bootstrap
methods23 can be used. We refer interested readers to Ref. 24 for a comprehensive acount
of bootstrap methods.
5
Conclusion
The MBAR estimator exhibits superior statistical properties and has been widely used in
free energy calculations invloving multiple equilibrium states. In this paper we proposed an
approach that makes use of MBAR to calculate the density of states, and showed how this
could be applied to data from parallel tempering simulations. Subsequent MUCA
simula-tions which use this estimated density of states were shown to converge rapidly, without the
need for multicanonical recursions. In this way, MBAR “optimally connects” PT and MUCA
than being confined to its more usual role as a post-simulation analysis tool. Our numerical
study of a statistical model showed that the method was formally correct when compared
with exact numerical integration results. We then used the method to study polymer
ag-gregation in a lattice model and compared it with the traditional method of using MBAR
to analyse simulation data. We observed that even when we applied our method to the first
half of generated PT data, we were able to obtain comparable and even better results than
the traditional method. Our results therefore suggests that it can be more beneficial and
efficient to do analytical calculations, e.g. deriving MUCA weights through MBAR, than
simply running longer Monte Carlo simulations.
Because in our method MBAR is not used to produce final estimates, nor the associated
uncertainties, of physical properties, there is some leeway in how it can be applied. In
particular, it is possible to use full PT samples for MBAR DoS calculations, i.e. without
first subsampling to remove the intrinsic correlations in the MC trajectory. This aspect was
explored in both of our examples. Clearly, it is natural to subsample the data because we can
then properly combine the estimators of the log density of states. However, the optimality
of such estimators decreases as subsample size shrinks, and hence if correlation is long, the
full sample strategy of Section 3.2 may be preferred. The conventional usage of MBAR to
report statistical uncertainties would preclude such possibility.
Acknowledgement
The authors thank the Centre for Scientific Computing at Warwick University for providing
the computational resources. We would also like to acknowledge useful discussions with
Description of Supporting Information
The SI includes details of the simulation protocols in S4.1 and S4.2. In particular, it contains
a full description of the energy function used in S4.2, a table of the associated parameter
values chosen for the model and a description of trial moves. The information is available
free of charge via the Internet at http://pubs.acs.org
References
(1) Metropolis, N.; Rosenbluth, A. W.; Rosenbluth, M. N.; Teller, A. H.; Teller, E. J.
Chem. Phys.1953,21, 1087–1092.
(2) Marinari, E.; Parisi, G. Europhys. Lett. 1992,19, 451.
(3) Geyer, C. J.; Thompson, E. A. J. Am. Stat. Assoc. 1995, 90, 909–920.
(4) Geyer, C. J. Markov Chain Monte Carlo Maximum Likelihood. In Computer Science
and Statistics: Proceedings of the 23rd Symposium on the Interface; Keramidas, E. M.,
Kaufman, S. M., Eds.; Interface Foundation of North America: Fairfax Station, VA,
1991; pp 156-163.
(5) Hukushima, K.; Nemoto, K. J. Phys. Soc. Jpn. 1996, 65, 1604–1608.
(6) Kumar, S.; Rosenberg, J. M.; Bouzida, D.; Swendsen, R. H.; Kollman, P. A.J. Comput.
Chem. 1992,13, 1011–1021.
(7) Shirts, M. R.; Chodera, J. D. J. Chem. Phys. 2008, 129, 124105.
(8) Berg, B. A.; Neuhaus, T. Phys. Lett. B 1991,267, 249–253.
(9) Wang, F.; Landau, D. P. Phys. Rev. Lett. 2001, 86, 2050.
(12) Chodera, J. D.; Swope, W. C.; Pitera, J. W.; Seok, C.; Dill, K. A. J. Chem. Theory
Comput. 2007,3, 26–41.
(13) Bennett, C. H. J. Comput. Phys. 1976, 22, 245–268.
(14) Tan, Z. J. Am. Stat. Assoc. 2004,99, 1027–1036.
(15) Robert, C. P.; Casella, G. Monte Carlo Statistical Methods, 2nd ed.; Springer: New
York, 2004.
(16) Berg, B. A. Nucl. Phys. B (Proc. Suppl.) 1998,63, 982–984.
(17) Lee, P.; Tullman-Ercek, D.; Georgiou, G. Annu. Rev. Microbiol 2006, 60:373-395.
(18) Gohlke, U.; Pullan, L.; McDevitt, C.; Porcelli, I.; de Leeuw, E.; Palmer, T.; Saibil, H.;
Berks, B. Proc. Natl. Acad. Sci. U. S. A. 2005, 102, 10482–10486”.
(19) Lau, K. F.; Dill, K. A. Macromolecules 1989, 22, 3986–3997.
(20) De Leeuw, E.; Porcelli, I.; Sargent, F.; Palmer, T.; Berks, B. C. FEBS Lett.2001,506,
143–148.
(21) Lesh, N.; Mitzenmacher, M.; Whitesides, S. A Complete and Effective Move Set for
Simplified Protein Folding. In Proceedings of the 7th Annual International Conference
on Research in Computational Molecular Biology, Berlin, Germany, April 10-13, 2003;
ACM Press: New York, 2003.
(22) Efron, B. Ann. Stat.1979,7, 1–26.
(23) Politis, D. N.; Romano, J. P. J. Am. Stat. Assoc. 1994, 89, 1303–1313.
(24) Davison, A. C.; Hinkley, D. V. Bootstrap Methods and Their Application; Cambridge
Graphical TOC Entry
20 40 60
0.5 1.0 1.5 2.0 T Cv
method PTMBAR PTMBARMUCA FPTMBARMUCA
20 40 60 80
0.57 0.66 0.75 0.84 T Cv