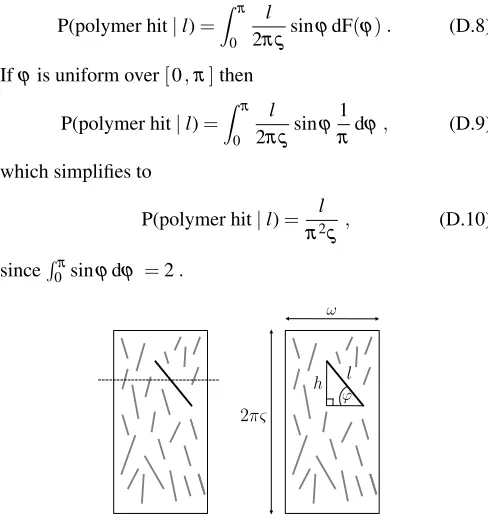
Original citation:
Dow, Claire E., Rodger, Alison, Roper, David I. and van den Berg, Hugo A.. (2013) A
model of membrane contraction predicting initiation and completion of bacterial cell
division. Integrative Biology . ISSN 1757-9694 (In Press).
Permanent WRAP url:
http://wrap.warwick.ac.uk/53310
Copyright and reuse:
The Warwick Research Archive Portal (WRAP) makes the work of researchers of the
University of Warwick available open access under the following conditions. Copyright ©
and all moral rights to the version of the paper presented here belong to the individual
author(s) and/or other copyright owners. To the extent reasonable and practicable the
material made available in WRAP has been checked for eligibility before being made
available.
Copies of full items can be used for personal research or study, educational, or
not-for-profit purposes without prior permission or charge. Provided that the authors, title and
full bibliographic details are credited, a hyperlink and/or URL is given for the original
metadata page and the content is not changed in any way.
Publisher’s statement:
http://dx.doi.org/10.1039/C3IB20273A
A note on versions:
The version presented here may differ from the published version or, version of record, if
you wish to cite this item you are advised to consult the publisher’s version. Please see
the ‘permanent WRAP url’ above for details on accessing the published version and note
that access may require a subscription.
A model of membrane contraction predicting initiation and
comple-tion of bacterial cell division
Claire E. Dow,
a,†Alison Rodger,
∗a,b, David I. Roper
cand Hugo A. van den Berg
dReceived Xth XXXXXXXXXX 20XX, Accepted Xth XXXXXXXXX 20XX First published on the web Xth XXXXXXXXXX 200X
DOI: 10.1039/b000000x
Bacterial cell division involves a complex and dynamic sequence of events whereby polymers of the protein FtsZ assemble at the division plane and rearrange to achieve the goal of contracting the cell membrane at the site of cell division, thus dividing the parent cell into two daughter cells. We present a mathematical model (which we refer to as CAM-FF: Critical Accumulation of Membrane-bound FtsZ Fibres) of the assembly of the contractile ring in terms of the accumulation of short linear polymers of FtsZ that associate and dissociate from the cell membrane. In prokaryotes, the biochemical function of FtsZ is thought to underpin the assembly and at least the initial kinetic force of ring contraction. Our model extends earlier work of Surovtsev
et al. [PLoS Computational Biology, 2008,4, 7, e1000102] by adding (i) the kinetics of FtsZ accumulation on cell membrane anchor proteins and (ii) the physical forces required to deform the cell against its surface tension. Moreover, we provide a more rigorous treatment of intracellular diffusion and we update some of the model parameters in light of the experimental evidence now available. We derive a critical contraction parameter which links the chemical population dynamics of membrane-bound FtsZ molecules to the force of contraction. Using this parameter as a tool to predict the ability of the cell to initiate division, we are able to predict the division outcome in cells depleted of key FtsZ-binding proteins.
1 Introduction
Co-ordination of cell division, both temporally and spatially, is essential for the propagation of life through successive genera-tions. A key event is the formation of a contractile ring, which is anchored to the cytoplasmic face of the cell membrane at the division plane. Following assembly, the ring contracts, draw-ing the membrane on opposite sides of the cell together. This divides the parent cell into two daughter cells.1
In eukaryotic cells, contraction relies on the sliding force generated by the ATP-dependent interaction of the motor pro-tein myosin and the structural actin filaments within a ring of polymeric actin fibres.2 As yet no equivalent motor protein has been identified in prokaryotic cells.3Whereas in eukary-otes the major structural component is actin, in prokaryeukary-otes the ring consists primarily of a tubulin homologue, FtsZ,4,5 and is referred to as the Z-ring.6
Although over two dozen additional proteins have hitherto
aMolecular Organisation and Assembly in Cells Doctoral Training Centre,
Coventry House, University of Warwick, Coventry, CV4 7AL, United King-dom. E-mail: [email protected]
bDepartment of Chemistry and Warwick Centre for Analytical Science,
Uni-versity of Warwick, Coventry, CV4 7AL, United Kingdom
cSchool of Life Sciences, University of Warwick, Coventry, CV4 7AL, United
Kingdom
dMathematics Institute, University of Warwick, Coventry, CV4 7AL, United
Kingdom
†The provision of funding by an EPSRC studentship through the MOAC
Doc-toral Training Centre is gratefully acknowledged
been found to localise to the division site, evidence suggests that the assembly of the ring and the generation of contractile force are critically dependent on the protein FtsZ.7Indeed, pu-rified FtsZ spontaneously forms linear head-to-tail polymers
fila-ments that span the entire circumference of the cell and anneal head-to-tail to form closed polymers. There have been two mechanisms proposed for the contraction of a ring of such a structure: (i) a progressive increase in the lateral overlap of the two ends of the filament forming a spiral structure16,17or (ii) that proposed by Surovtsevet al.14: the progressive loss of FtsZ subunits following GTP hydrolysis with the open ends generated re-annealing.
However, more recent evidence suggests that rather than be-ing composed of long circular polymers, the Z-rbe-ing consists of shorter overlapping FtsZ filaments.3,13 This remains con-sistent with the “Z-centric” hypothesis: that assembly and the force of constriction originate from FtsZ. In addition, our re-cent work determined the persistence length of FtsZ (i.e. the length over which the polymer naturally remains straight) to be 1.15±0.25µm.18This far exceeds previous estimates and
makes it impossible for a single fibre to span the midcell cir-cumference. Accordingly, the central aim of the present pa-per is to model the assembly of the Z-ring as a collection of shorter, membrane-bound, open filaments in the midcell re-gion. Our model combines a substantial portion of the molec-ular kinetics developed by Surovtsevet al.14, detailed here in Appendix A, but omits cyclisation as the driving force. We introduce diffusion of FtsZ into the midcell region as well as the interaction of FtsZ with membrane-bound anchor pro-teins, both additions to the Surovtsev model. Furthermore, we explicitly include the force exerted by FtsZ polymers on the membrane. We also modify some parameters in light of data determined since publication of the Surovtsev model in 2008. Surovtsevet al.19 have since incorporated their model of Z-ring assembly and contraction into a more complex model of protocell growth and division. They anticipate that the only viable path towards a whole-cell predictive model isvia the collaborative development of individual modules to be added piecemeal to a global model. We present this work as a devel-opment of the Z-ring assembly and contraction module. Lan
et al.20 have modelled the deformation and inward growth of the bacterial cell wall originating from the small Z-ring force that deforms the cell with full division dependent on the re-modelling of the peptidoglycan layer. We anticipate that this is complementary to our work and forms an additional mod-ule of the full cell division model. Our long-term goal is to link the current model with modules for: (i) the membrane bend-ing, (ii) the link to the outer membrane remodellbend-ing, and (iii) the outer membrane remodelling.
§2 introduces the equations describing the dynamics of FtsZ polymerisation, much of which follows the work of Surovtsev
et al.14, and the concentration of FtsZ at the midcell mem-brane. §2 concludes with our new analysis of the force re-quired for Z-ring contraction, leading to the definition of a key quantity which we call the contraction parameter. §3 shows that by implementing the wild-type parameter values,
estimated from the current experimental literature, the model solutions are in accordance with the properties of the Z-ring measuredin vivo. In §4 we show that the contraction parame-ter is a useful tool to predict the division outcome in cells, such as on depletion of the membrane-anchor proteins. §5 contains an analysis of the model assumptions.
2 Model
In the nascent daughter cell, FtsZ monomers are dispersed throughout the cytosol.21Formation of the Z-ring for the next cell division therefore requires polymerisation of FtsZ, poly-mer localisation at the midcell and polypoly-mer anchoring to the cell membrane. In the present model, which we refer to as CAM-FF: Critical Accumulation of Membrane-bound FtsZ Fibres, the cell is conceptually divided into three compart-ments: the midcell region, the adjoining cell caps, and the midcell membrane, as shown in Figure 1A. All FtsZ molecules are initially monomeric and dispersed within the cell caps and midcell compartments. A system of ordinary differential equations (ODEs) describes the changes in the concentrations of FtsZ molecules within the three compartments over time, as detailed in Appendix B. FtsZ molecules within the cell caps and the midcell region undergo the polymerisation and GTP hydrolysis reactions as shown in Figure 1B. Movement be-tween these two compartments is by diffusion. Movement oc-curs from the midcell region to the midcell membrane when FtsZ molecules bind to anchor sites fixed to the membrane and
Average polymer length (subunits) Total FtsZ concentration (µM) Number of FtsZ molecules Contraction parameter (i2
avZN) 1
2 3
Ratef=kex1[GDP-FtsZ] [GTP],Rater=kex2[GTP-FtsZ] [GDP] , (1)
d
dt[GTP-FtsZ] = Ratef−Rater, (2)
Rateh=khyd1(i−1)[FtsZi], Rex2=kex2[GTP-FtsZ] [GDP] , (3)
Pi
0 50 100 150
1
d
dt�(τZ−τˆ)p1(i)
2 0.0003
3×10⁻⁴ 2×10−41×10−4 A
Length (i) Time (s) B C D E F
Concentration (µM)
h
GTP GDP
1
A Length (i) B C D E F
Concentration (µM) h GTP GDP GTP-FtsZ GDP-FtsZ ϕ τ0 l τp 2π� 1 2 3 n (n−1) (n−2) kon koff λ (n−1)λ (n−2)λ 2λ µ 2µ 3µ nµ (n−1)µ (n−2)µ . . . 2�
1
Average polymer length (subunits) Total FtsZ concentration (µM) Number of FtsZ molecules Contraction parameter (i2
avZN) 1
2 3
Ratef=kex1[GDP-FtsZ] [GTP],Rater=kex2[GTP-FtsZ] [GDP] , (1)
d
dt[GTP-FtsZ] = Ratef−Rater , (2)
Rateh=khyd1(i−1)[FtsZi], Rex2=kex2[GTP-FtsZ] [GDP] , (3)
Pi
0 50 100 150
1
d
dt�(τZ−ˆτ)p1(i)
2 0.0003
3×10−42×10−41×10−4 A
Length (i) Time (s) B C D E F
Concentration (µM)
h
GTP GDP
1
Average polymer length (subunits) Total FtsZ concentration (µM) Number of FtsZ molecules Contraction parameter (i2
avZN) 1
2 3
Ratef=kex1[GDP-FtsZ] [GTP],Rater=kex2[GTP-FtsZ] [GDP] , (1)
d
dt[GTP-FtsZ] = Ratef−Rater , (2)
Rateh=khyd1(i−1)[FtsZi], Rex2=kex2[GTP-FtsZ] [GDP] , (3)
Pi
0 50 100 150
1
d
dt�(τZ−ˆτ)p1(i)
2 0.0003
3×10−42×10−41×10−4 A
Length (i) Time (s) B C D E F
Concentration (µM)
h
GTP GDP
1 Average polymer length (subunits) Total FtsZ concentration (µM) Number of FtsZ molecules Contraction parameter (i2
avZN) 1
2 3
Ratef =kex1[GDP-FtsZ] [GTP],Rater =kex2[GTP-FtsZ] [GDP] , (1)
d
dt[GTP-FtsZ] = Ratef−Rater, (2)
Rateh=khyd1(i−1)[FtsZi], Rex2=kex2[GTP-FtsZ] [GDP] , (3)
Pi
0 50 100 150
1
d
dt�(τZ−τˆ)p1(i)
2 0.0003
3×10⁻⁴ 2×10−41×10−4 A
Length (i) Time (s) B C D E F
Concentration (µM)
h
GTP GDP
1
Average polymer length (subunits) Total FtsZ concentration (µM) Number of FtsZ molecules Contraction parameter (i2
avZN) 1
2 3
Ratef =kex1[GDP-FtsZ] [GTP],Rater =kex2[GTP-FtsZ] [GDP] , (1)
d
dt[GTP-FtsZ] = Ratef−Rater, (2)
Rateh=khyd1(i−1)[FtsZi], Rex2=kex2[GTP-FtsZ] [GDP] , (3)
Pi
0 50 100 150
1
d
dt�(τZ−τˆ)p1(i)
2 0.0003
3×10⁻⁴ 2×10⁻⁴ 1×10⁻⁴ A
Length (i) Time (s) B C D E F
Concentration (µM)
h GTP GDP 1 GTP GDP GTP-FtsZ GDP-FtsZ ϕ τ0 l τp 2π� 1 2 3 n
(n−1) (n−2)
kon koff λ
(n−1)λ
(n−2)λ
2λ µ
2µ
3µ nµ
(n−1)µ
(n−2)µ . . . 2� ω β r 1 GTP GDP GTP-FtsZ GDP-FtsZ ϕ τ0 l τp 2π� 1 2 3 n
(n−1) (n−2)
kon koff λ
(n−1)λ
(n−2)λ
2λ µ
2µ
3µ nµ
(n−1)µ
(n−2)µ . . . 2� ω β r 1 GTP GDP GTP-FtsZ GDP-FtsZ ϕ τ0 l τp 2π� 1 2 3 n
(n−1) (n−2)
kon koff λ
(n−1)λ
(n−2)λ
2λ µ
2µ
3µ nµ
(n−1)µ
(n−2)µ . . . 2� ω β r 1 GTP GDP GTP-FtsZ GDP-FtsZ ϕ τ0 l τp 2π� 1 2 3 n
(n−1) (n−2)
kon koff λ
(n−1)λ
(n−2)λ
2λ µ
2µ
3µ nµ
(n−1)µ
(n−2)µ . . . 2� ω β r 1
+
+
+
+
+
+
+
Average polymer length (subunits) Total FtsZ concentration (µM) Number of FtsZ molecules Contraction parameter (i2
avZN) 1
2 3
Ratef =kex1[GDP-FtsZ] [GTP],Rater =kex2[GTP-FtsZ] [GDP] , (1)
d
dt[GTP-FtsZ] = Ratef−Rater, (2)
Rateh=khyd1(i−1)[FtsZi], Rex2=kex2[GTP-FtsZ] [GDP] , (3)
Pi
0 50 100 150
1
d
dt�(τZ−τˆ)p1(i)
2 0.0003
3×10⁻⁴ 2×10−41×10−4 A
Length (i) Time (s) B C D E F
Concentration (µM)
h GTP GDP 1 A B C kdif
kdif kdif
kdif kbi nd2 kbi nd1 kex1 kex2 kdim1 kdim2 kel1 kel2 kan1 kdis kbind1 kbind2 kbind1 kbind2 (i) (ii) (iii) (iv) (v) D Surface tension Cell radius Z-ring radius E Fτ FP
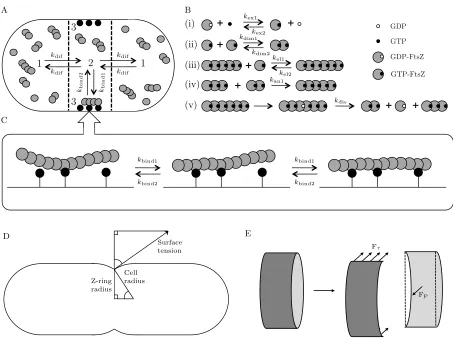
Fig. 1: Schematic diagram of the cell model used in this work. (A) The cell is conceptually divided into three compartments: the cell caps (1), the midcell (2), and the midcell membrane (3). FtsZ moves between the cell caps and the midcell regions by diffusion. Exchange between the midcell region and the midcell membrane is via the interaction of FtsZ with membrane anchor sites and subsequent polymerisation. (B) Using the notation of?], the chemical reactions in the model are: nucleotide exchange (i), dimerisation (ii), and elongation (iii) (reversible processes) and annealing (iv) and polymer breakdown following GTP hydrolysis (v) (assumed to be irreversible). (C) Depending on the anchor density, an FtsZ polymer may bind to multiple anchor sites. As polymer length increases, the number of anchor connections increases thereby lowering the probability that the polymer will be released from the membrane. (D) Z-ring contraction pulls the membrane inwards against the outward force from the cell surface tension. (E) For the slice through the Z-ring, at equilibrium the horizontal force due to the ring tension (Fτ) is balanced by the internal pressure acting over the cross-sectional area of the slice (FP).
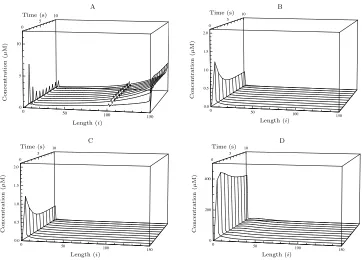
midpoint of the extreme values of the contraction parameter at approximately 70,000.
In the model solutions, the assembly of the Z-ring is complete within 5 sec compared to the 1-min
assembly time measured inE. coli in vivo[? ? ]. It is anticipated that the use of a single diffusion constant
for all lengths of FtsZ polymer accounts for this variation. The assumption of instantaneous dissociation
of the FtsZ polymers on GTP hydrolysis may also account in part for the rapid assembly if in fact there
is a time delay between GTP hydrolysis and polymer dissociation. These assumptions will be addressed in
future work.
4
Fig. 1Schematic diagram of the cell model used in this work. (A) The cell is conceptually divided into three compartments: the cell caps (1), the midcell (2),
and the midcell membrane (3). FtsZ moves between the cell caps and the midcell regions by diffusion. Exchange between the midcell region and the midcell membrane isviathe interaction of FtsZ with membrane anchor sites and subsequent polymerisation. (B) Using the notation of Surovtsevet al.14, the chemical reactions in our model are: nucleotide exchange (i), dimerisation (ii), and elongation (iii) (reversible processes) and annealing (iv) (assumed to be irreversible in the absence of GTP hydrolysis) and polymer breakdown following GTP hydrolysis (v) (also irreversible). (C) Depending on the anchor density, an FtsZ polymer may bind to multiple anchor sites. As polymer length increases, the number of anchor connections increases thereby lowering the probability that the polymer will be released from the membrane. (D) Z-ring contraction pulls the membrane inwards against the outward force from the cell surface tension. (E) For the slice through the Z-ring, at equilibrium the horizontal force due to the ring tension (Fτ) is balanced by the internal pressure acting over the cross-sectional area of the slice (FP).
2.1 FtsZ polymerisation and GTP hydrolysis: the
Surovtsev model rewritten
The molecular kinetics of FtsZ polymerisation and GTP hy-drolysis/dissociation summarised in Equations (1) to (6) are the rate equations as proposed by Surovtsevet al.14. FtsZ is a GTP/GDP-binding protein that interconverts GTP and GDP.24 The nucleotide-binding site is exposed to the cytosol allowing for a bound nucleotide to be released, leaving the site open for another nucleotide to bind in nucleotide exchange. The relative concentrations of GTP-bound and GDP-bound FtsZ monomers therefore depend on the relative concentrations of GTP and GDP in the cytosol. In CAM-FF, all FtsZ monomers are initially GDP-bound reflecting the starting point for some
in vitroexperiments25and the depolymerisation of the Z-ring in the previous cell division event.21 The rates of nucleotide exchange for monomeric FtsZ in solution are given by
Rex1=kex1[GTP]ZD and Rex2=kex2[GDP]ZT, (1)
whereZD andZT are the concentrations of GDP-bound and GTP-bound FtsZ monomers, respectively. In the GTP-bound state, FtsZ molecules polymerise rapidly in vitro forming head-to-tail subunit chains.10In CAM-FF, the rates of dimeri-sation and elongation of GTP-bound FtsZ are given by for-ward and reverse rates,
[image:4.612.66.519.65.407.2]and
Riel1=kel1ZTZi, Riel2=kel2Zi+1, (3) respectively, whereZ2is the concentration of FtsZ dimers and
Zi is the concentration of FtsZ polymers of lengthisubunits.
We assume the rate of elongation does not depend on the length i. The rates of dimerisation and elongation of GDP-bound FtsZ are assumed to be zero.10We assume the forward rates of dimerisation and elongation to be equal; for the corre-sponding dissociation, the rate constant has been found to be higher for the dissociation of FtsZ dimers than for the dissoci-ation of FtsZ polymers.26This is reflected in the values of the rate constantskdim2andkel2, see §3.
Polymer length can also increase by annealing reactions, in which a polymer of lengthiis formed by the annealing of a polymer of length jto a polymer of lengthi−j. This occurs with rate
Ri
an1=kan
i−2
∑
j=2
1+δj i−j
2 ZjZi−j, (4)
and the removal of polymers due to annealing is given by
Ri
an2=kanZi imax−i
∑
j=2
(1+δi j)Zj, (5)
whereimax is the maximum length polymer that can form in the model. In principle, the model should allow for arbitrarily long filaments,i.e.imax→∞, but for the purpose of calcula-tion a cut-off value is selected that is sufficiently large such that the results do not depend on the value chosen. We do not include reverse rates for the annealing reaction since we as-sume that depolymerisation does not occur in the absence of GTP hydrolysis.
On polymerisation, a GTPase active site is formed when a catalytic aspartate residue of one subunit inserts into the GTP-binding pocket of the adjacent subunit.27,28Once poly-merised, the nucleotide state of an FtsZ subunit may therefore switch from GTP-bound to GDP-bound. In vitro, depletion of GTP leads to net depolymerisation, which suggests that the GDP-bound polymers are unstable.10 Surovtsev et al.14 assumed that upon GTP hydrolysis, the GDP-bound subunit dissociates from the intact polymers on either side instanta-neously. We use the equivalent rate equation given by
Ri
dis= (i−1)kdisZi, (6)
where a polymer of length i has i−1 GTPase active sites. However, instead of the hydrolysis rate of 0.15 s−1as used by Surovtsev et al.14, to account for the rate of dissocia-tion of FtsZ following hydrolysis, we use the value of kcat from Romberg and Mitchison25of 4.5 min−1per FtsZ to give rate constantkdis=0.075 s−1. The rate constantkdisis equal for all GTPase active sites since it has been shown that all
monomer interfaces are equally competent for hydrolysis.22 The significance of the change in the model is that we now account for the time spent by FtsZ subunits within polymers in the GDP-bound state following hydrolysis, prior to dissoci-ation.
2.2 Novel features of our membrane contraction model 2.2.1 FtsZ diffusion. In CAM-FF, we consider the change in the midcell concentration due to diffusion from the cell caps to the midcell for FtsZ molecules of lengthi to be given by
Ri
cm=kdif(Zicc−Zimid)/Vmid, (7) and that for the diffusion from the midcell to the cell caps to be
Rimc=kdif(Zimid−Zicc)/Vcc, (8) wherekdif is the diffusion constant, which is assumed to be equal for all values of i, and Vcc andVmid are the volumes of the cell caps and midcell compartments, respectively. The rate of diffusion defined in Equations (7) and (8) applies to all polymer lengths and for both GDP- and GTP-bound FtsZ monomers.
The process of diffusion without any other factor will en-sure a uniform concentration of FtsZ throughout the cell. To model the accumulation of FtsZ at the midcell and the physi-cal attachment that confers a pinching force, we introduce to our model a compartment corresponding to the midcell mem-brane.
2.2.2 Membrane binding: Interaction of FtsZ poly-mers with multiple binding sites. To anchor to the cell membranein vivo, FtsZ interacts directly with the membrane-binding proteins proteins ZipA and FtsA.29 The anchoring means that if the Z-ring constricts, it exerts a pinching force on the cell membrane.
The rate of attachment of the FtsZ polymers within the mid-cell compartment is given by
Ribind1=
ikbind1Zimid
� 1021B
NAVbnd− �
Zbnd
D +ZTbnd+
imax
∑
j=2
S(j)Zbndj ��
,
(9)
for i≥2, whereBis the total number of binding sites, Vbnd is the volume of the midcell membrane compartment, NA is Avogadro’s number andS(j)is the expected number of bind-ing sites occupied by a polymer of length j. Multiplication by
may bind to the midcell membrane with rates given by
RD bind1=
kbind1ZmidD �
1021B
NAVbnd− �
ZbndD +ZTbnd+
imax
∑
j=2
S(j)Zbndj
��
(10)
and
RT bind1=
kbind1ZTmid �
1021B
NAVbnd− �
ZDbnd+ZTbnd+
imax
∑
j=2
S(j)Zbndj
��
,
(11)
respectively. Release from the membrane is given by
Ri
bind2=kbind2p1(i)Zbndi fori≥2, (12)
where p1(i)is the fraction of polymers of lengthiexpected to be attached to the membrane by a single binding site only. For GDP- and GTP-bound monomers, the rates of release are given by
RD
bind2=kbind2ZDbnd and RTbind2=kbind2ZTbnd, (13) respectively. On release, polymers return to the midcell solu-ble population.
To determine p1(i), the binding of polymers to multiple binding sites is modelled as a Markov chain with a fixed num-ber of binding sites available. We assume that the anchor pro-teins interact with single FtsZ subunits allowing a polymer of lengthisubunits to potentially formimembrane interactions.
At equilibrium, the fraction of polymers bound to a single binding site is given by
f1j= j
κ(1+κ1)j−κ , (14)
where jis the number of binding sites available andκ is the dissociation constant. A full derivation of Equation (14) is given in Appendix C. Since each anchor interacts with a single FtsZ subunit within the polymer, the probability thatjbinding sites are available to a polymer of lengthiis given by
P(jsites)= �i
j
�Pj
a(1−Pa)i−j
1−(1−Pa)i , (15)
where Pais the probability that one FtsZ subunit is adjacent
to a binding site. This equation is derived by conditioning the binomial distribution on at least one binding site being avail-able, since for a molecule in the membrane-bound fraction, this condition is satisfied. The fraction expected to be attached
by a single anchor is the expectation of fractions for all values of jfrom 1 toi:
p1(i) =
i
∑
j=1 �i
j
�Pj
a(1−Pa)i−j
1−(1−Pa)i ·
j
κ(1+κ1)j−κ . (16)
Since a polymer is held on the membrane until the final FtsZ-anchor interaction is broken, adjustment of the rate of release using the fraction of polymers in the singly-bound state ac-counts for the binding to multiple sites.
The binding rate is proportional to the number of available binding sites. The available number depends on the total num-ber of binding sites and the numnum-ber of occupied binding sites, which itself depends on the membrane-bound FtsZ popula-tion. The expected number of sites occupied by a chain of lengthiis given by
S(i) = Pai
1−(1−Pa)i , (17)
which is again conditional on at least one site being occupied by a membrane-bound polymer.
2.2.3 Polymerisation of membrane-bound FtsZ. For
membrane-bound monomeric FtsZ, we assume that nucleotide exchange occurs as for soluble FtsZ,cf.Equation (1). The ex-tension of membrane-bound FtsZ polymers occurs by inter-action with unbound, soluble FtsZ in the midcell region. By analogy to Equations (2) and (3) for soluble FtsZ, the rates of dimerisation and elongation of membrane-bound FtsZ are given by
Rdim1 bnd=kdim1ZTmidZTbnd, Rdim2 bnd=kdim2Zbnd2 (18)
and
Ri
el1 bnd=kel1ZTmidZibnd, Riel2 bnd=kel2Zi+bnd1, (19) respectively. For the reverse reactions, it is assumed that a GTP-bound FtsZ monomer returns to the midcell region while the shortened polymer (which is a GTP-bound monomer in the case of the reverse of dimerisation) remains bound to the midcell membrane. The rate of polymer annealing is given by
Rian1 bnd=kan
i−2
∑
j=2
Zbndj Zimid−j , (20)
with the removal of polymers due to annealing given by
Rian2 bnd=kanZimid imax−i
∑
j=2
Zbndj , (21)
and
Ri
an2 mid=kanZibnd imax−i
∑
j=2
Zmid
for the midcell region and midcell membrane, respectively. The Kronecker delta used in Equations (4) and (5) for the annealing reactions of soluble FtsZ is not required since the double-counted combinations for the soluble case are no longer equivalent in the case of interaction of a membrane-bound population with a soluble population. As for soluble FtsZ, the annealing reactions are assumed to be irreversible. The value of rate constants for dimerisation, elongation, and annealing are assumed in the model to be equal to those for reactions between soluble FtsZ.
2.2.4 Hydrolysis of membrane-bound polymers. The GDP-bound subunit and the shorter polymer(s), generated by the polymer cleavage that follows a hydrolysis/dissociation event, may remain bound to the membrane or may return to the soluble midcell compartment, depending on their attachment to adjacent binding sites. For a parent polymer of lengthi�, the probability that any subunit is adjacent to a binding site is given by
P(site adjacent|i�) = Pa
1−(1−Pa)i� . (23)
Therefore, for a polymer of lengthi, formed as a result of a hy-drolysis/dissociation reaction, the probability that the polymer returns to the midcell compartment is the probability that none of theisubunits is adjacent to a binding site which is given by
Pi(no sites|i�) =
�
1−1 Pa
−(1−Pa)i�
�i
. (24)
The probability that a polymer remains in the membrane-bound fraction is therefore 1−Pi(no sites|i�). It is assumed
that the fraction of those with at least one adjacent binding site will join the population of membrane-bound polymers of lengthi. The interaction of FtsZ with FtsA or ZipA does not affect the rate of GTP hydrolysisin vitro.30,31Therefore, the rate of dissociation of membrane-bound polymers remains as given by Equation (6) for soluble FtsZ in § 2.1.
We do not directly account for the potential of membrane-bound polymers to reanneal after fragmentation. However, the increased likelihood that a GTP hydrolysis/dissociation event occurring towards either end of the FtsZ polymer results in permanent loss of subunits from the polymer, compared to a GTP hydrolysis/dissociation event in the centre of the poly-mer, as found by Mateos-Gilet al.22, is accounted for in the model. By calculation of the number of binding sites available to the polymer fragments produced on dissociation, smaller polymers are less likely to be bound to an anchor and so are more likely to move back to the soluble fraction with loss from the Z-ring. Although fragments that remain bound do not re-anneal, they are available for reannealing to free (unbound) FtsZ polymers and remain within the Z-ring compartment.
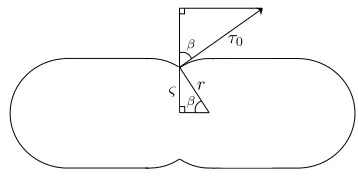
2.2.5 Tension in the Z-ring. Two key properties govern Z-ring contraction. The first is the total tension of the Z-ring, τZ, defined in terms of the cell surface tension and the radius of the Z-ring as contraction proceeds. The second is the maxi-mum tension the Z-ring can withstand, ˆτ, at a given radius,ς, based on the population of FtsZ polymers assembled and the force of the interaction between FtsZ and the membrane an-chor. The analysis shown in Appendix D, in which the com-ponents of the cell surface tension and the forces acting on the Z-ring are considered as in Figure 1D and Figure 1E respec-tively, shows that τZ, the total tension of the Z-ring during contraction, is given by
τZ=τ0 �
1+2r
ω ρ
� 1−ρ2
�
, (25)
whereτ0is the cell surface tension, ω is the width of the Z-ring, andρ=ς/ris the dimensionless ratio of the radius of the
Z-ring during contraction,ς, to the radius of the Z-ring before contraction, r. For the sake of simplicity, the parametersτ0 andω are assumed to be constant throughout the contraction process.
As shown in Appendix D, the maximum tension the Z-ring can withstand ˆτis given by
ˆ
τ=FPωal0
r .
¯
i2N Z
ρ , (26)
whereFis proportional to the force of the interaction of FtsZ with a single anchor site,l0is the length of one FtsZ subunit, ¯
iis the average number of subunits per polymer, andNZis the total number of polymers bound to the membrane.
In the model, the sign of d
dt(ς)agrees with that of(τZ−τˆ)
because it is assumed that this difference will drive the con-traction. The precise functional form of the relationship de-pends on the molecular mechanism of contraction, which re-mains to be elucidated. In the absence of detailed data, a sim-ple linear relationship is proposed:
d
dtς=ϑ0(τZ−τˆ), (27)
where ϑ0 is a constant. Substituting the total ring ten-sion and maximum sustainable tenten-sion, defined in Equa-tions (25) and (26) respectively, gives an ODE for the rate of change of the dimensionless ratio ρ, the size of the ring relative to its starting size:
d dtρ=ϑ
�
α�1+γρ�1−ρ2
�
−¯i
2N Z ρ
�
, (28)
where
ϑ�ϑ0FωPral0, α� τ0ωr
FPal0, and γ� 2r
Hidden in these parameters are the details of membrane bend-ing energy and the molecular reorganisation that occurs con-comitantly with the contraction. A full model of bacterial cell division would complement CAM-FF with a membrane remodelling module. Contraction corresponds to the rate of change ofρ being negative. Therefore, contraction proceeds if and only if
¯
i2NZ>αρ(1+γρ �
1−ρ2). (30)
The ability of the cell to divide thus depends on the value of thecontraction parameter:
χ�i¯2N
Z. (31)
Initially,ρ=1 and contraction therefore begins whenχ>α. Numerical solution of the system of ODEs, given in full in Appendix B, allows determination ofχunder various biolog-ical scenarios and prediction of the ability of cells to initiate and sustain division (since Equation (30) also tells us if con-traction stops).
Since the average length of polymers ¯i is squared in the calculation of the contraction parameter, for a given ber of FtsZ subunits bound to the membrane, a smaller num-ber of longer polymers are expected to collectively provide a stronger contractile force than a larger number of shorter poly-mers.
3 Estimation of wild-type rate constants
Surovtsev et al.14 selected rate constants based on the best available experimental data. However, we use a lower value of [FtsZ]Total. Based on the 15,000 molecules of FtsZ per cell found by Lu et al.32, [FtsZ]Total=12 µM. Although lower values for the number of FtsZ molecules have been found33,34, we use the highest of the recorded numbers since we use a large volume to calculate the corresponding concentration. Whereas, the effective volume available to the FtsZ will be much lower??? - I don’t know how to word this! We retain the values used by Surovtsevet al.14for [GTP], [GDP] andimax. The value ofimax=150 subunits is consistent with the average length of FtsZ polymers measuredin vitrousing transmission electron microscopy of 23 subunits35 and we have ensured that this is sufficiently large that the results are independent of its value. An increase in the value toimax=200 does not change the predicted average lengths of free and bound FtsZ polymers, the predicted number of membrane-bound FtsZ molecules nor the predicted percentage of FtsZ in-corporation into the Z-ring. We also follow Surovtsevet al.14 in representing the cell as a cylinder with radius 0.4 µm, length 4 µm, and midcell region width 0.1 µm. In contrast to them, we include the whole midcell slice, as shown in Fig-ure 2, not just a region of depth 8 nm. The volumes of the
cell caps and midcell regions are therefore Vcc=2.0 µm3 andVmid=0.05µm3respectively. For the midcell radius of 0.4µm and the midcell width of 0.1µm, this corresponds to a midcell membrane surface area of 0.25µm2. The depth of the midcell membrane was set to 4 nm (the size of an FtsZ subunit) giving a volume Vbnd=1.0×10⁻³ µm3. As the diffusion constant D of ovalbumin, which is of similar size to FtsZ, is 78 µm2s−1,36 we use this value for the diffusion constant of FtsZ. Fick’s Law gives the flux across the dif-fusion area Aequal to AD
L ∆C where∆Cis the concentration
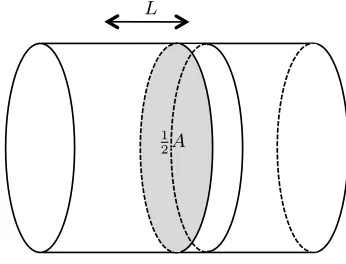
difference between the two compartments and L is the dis-tance between the midpoint of the two compartments, in this case 1µm. In our model, the flux in equivalent units is given by kdif(Zicc−Zmidi ), Equation (7), whence kdif∆C= ADL ∆C. Therefore, kdif= ADL . The value for the diffusion area Ais given by the bounding area of the midcell slice, 2πr2, see Fig-ure 2, givingkdif≈78µm3s−1. This is equal to the original value of the diffusion constantDsince the diffusion distance is taken as 1µm and the area of the boundaries of the slice are approximately equal to 1µm2for a radius of 0.4µm.
Initially,ρ= 1 and contraction therefore begins when ¯i2NZ>α. Numerical solution of the system of ODEs,
given in full in Appendix B, allows analysis in terms of this� of Z-ring contraction under various biological
scenarios and prediction of the ability of cells to initiate division.
3. Estimation of wild-type rate constants
Surovtsev et al. [14] selected rate constants based on the best available experimental data. The values
for [FtsZ]Total, [GTP], [GDP] andimax are therefore as chosen in the previous model [14]. The value ofimax
of 150 subunits is sufficiently large to accommodate the average length of FtsZ polymers measuredin vitro
using transmission electron microscopy of 23 subunits [26]. In Surovtsev et al. [14], the cell was represented
as a cylinder with radius 0.4 µm, length 4 µm, and width of the midcell region 0.1 µm. Here, the midcell
region was not modelled with depth 8 nm, as in their model, but included the whole midcell slice, as shown
in Figure 2. The volumes of the cell caps and midcell regions are therefore given by, Vcc = 2.0 µm3 and
Vmid = 0.05 µm3. For the volume of the midcell membrane, the depth was set to 4 nm, the size of an
FtsZ subunit to give Vbnd = 1.0×10⁻³ µm3. The experimental literature cites the diffusion constant D
of ovalbumin, of similar size to FtsZ at 45 kDa, as 78 µm2s−1 [27]. Fick’s Law gives the flux across the
diffusion area Aequal to AD
L ∆C where ∆C is the concentration difference between the two compartments
andLis the distance between the midpoint of the two compartments, in this case 1µm. In our model, the
flux in equivalent units is given by kdif(Zicc −Zimid), Equation (7), whence kdif∆C = ADL ∆C. Therefore,
kdif= ADL . The value for the diffusion area Ais given by the bounding area of the midcell slice, 2πr2, see
Figure 2, giving kdif ≈ 78 µm3s−1. This is equal to the original value of the diffusion constant D since
the diffusion distance is taken as 1µm and the area of the boundaries of the slice are approximately equal
to 1 µm2 for a radius of 0.4 µm.
L
1 2A
Fig. 2: The rate constant for the diffusion of FtsZ from the cell caps into the midcell region,kdif, is estimated using Fick’s
Law assuming diffusion through areaAalong a path of lengthL.
12
Fig. 2The rate constant for the diffusion of FtsZ from the cell caps into the midcell region,kdif, is estimated using Fick’s Law assuming diffusion through areaAalong a path of lengthL.
A key parameter in our model is the fraction of membrane-bound FtsZ polymers which are in the singly-membrane-bound state. This depends on the probability that a subunit is adjacent to a bind-ing site, Pa, and on the dissociation constantκ. We assume
[image:8.612.337.510.328.460.2]Z-ringin vivo. Therefore, it is assumed that 30% of the cell complement of anchors are found in the midcell membrane compartment. By dividing the surface area of the membrane into a grid of squares 4 nm×4 nm, Pa is given by the
pro-portion of grid squares occupied by 30% of the total number of anchor proteins. This gives Pa=0.043. The wild-type
dis-sociation constant of 0.2 µM for the FtsZ-ZipA (and hence the other) interactions was used to giveκ.40 Figure 3 shows
p1(i), the fraction of polymers expected to be attached to the membrane by a single binding site only, for Pa=0.043 and
κ=0.2µM. The high proportion of polymers that remain in
the singly-bound state for shorter lengths reflects the obser-vation that although an FtsZ polymer of lengthihas the po-tential to formiFtsZ:anchor interactions, ZipA interacts with FtsZ substoichiometrically.41 The interaction data presented by Martoset al.41 shows that oligomers of FtsZ, up to hex-amers, bind to a single ZipA molecule. This is reflected in the model as the predicted number of anchor proteins occupied by FtsZ oligomers at the membrane is 1 for an FtsZ monomer, up to 1.11 for a hexamer.
Key to the model is the fraction of membrane-bound FtsZ polymers in the singly-bound state, dependent
on the probability that a subunit is adjacent to a binding site, Pα, and the dissociation constantκ. Although
the model is based on a generic anchor interaction, Pα in fact accounts for the number of molecules of the
FtsZ-binding proteins ZipA, FtsA and the FtsEX complex. The experimental literature cites the number of
anchor molecules per cell for ZipA and FtsA as 1500 and 740 per cell, respectively [28]. Since the equivalent
value for the FtsEX complex is as yet unavailable, it is assumed that FtsEX is as abundant as FtsA and
the total number of anchor sites is set to 3000 per cell. Using fluorescent-labelled ZipA, Stricker et al. [29]
found that approximately 30% of the cell complement of ZipA localises to the Z-ringin vivo. Therefore, it
is assumed that 30% of the cell complement of anchors are found in the midcell membrane compartment.
This gives the number of binding sitesB= 900. By dividing the surface area of the membrane into a grid
of squares 4 nm×4 nm, 900 anchor proteins corresponds to Pα = 0.057. For the dissociation constant κ,
the wild-type dissociation constant of 0.2µM for the FtsZ-ZipA interaction was used [30]. Since the model
accounts for a single anchor interaction, the value for the ZipA interaction was used for all
FtsZ-anchor interactions in the model. Figure 3 showsp1(i), the fraction of polymers expected to be attached to
the membrane by a single binding site only, for Pα= 0.057 andκ= 0.2µM.
0 20 40 60 80 100 120 140
0.0 0.2 0.4 0.6 0.8 1.0
Length (i)
S
in
g
le
-b
o
u
n
d
fr
a
c
ti
o
n,
p1
(
i
)
Fig. 3: Fraction of membrane-bound polymers expected to be attached by a single FtsZ-anchor interaction, as a function of polymer length for Pα= 0.057 andκ= 0.2µM.
Finally, for the dissociation constant of 0.2µM, the model requires the associated kon and koff values
as kbind1 and kbind2respectively. Using fluorescence recovery after photobleaching (FRAP) the half life of
recovery of fluorescence in the Z-ring for wild-type FtsZ inE. coli was found to be 30 sec [29], corresponding
to an observed rate of release from the membrane of 0.023 s−1. Since the steady state of Z-ring assembly has
been reached prior to the photobleach, the observed release rate is given bykbind2 multiplied by the value
forp1(¯i) (see Equations (12) and (16)) where ¯i is the average bound polymer length at equilibrium. With
the dissociation constantκfixed at 0.2µM, the model solution corresponding to an observed wild-type half
13
Fig. 3The fraction of membrane-bound polymers expected to be attached by a
single FtsZ-anchor interaction, as a function of polymer length for Pa=0.043
andκ=0.2µM.
Fluorescence recovery after photobleaching (FRAP) exper-iments have shown the half life of recovery of fluorescence in the Z-ring for wild-type FtsZ in E. colito be 30 sec.39 Since the recovery of fluorescence in the bleached patch of the Z-ring is exponential, the observed rate of recovery is given by ln2/t1/2. For a half life of recovery of 30 sec-onds, the corresponding observed rate of release from the membrane is 0.023 s−1. Since the steady state of Z-ring as-sembly has been reached prior to the photobleaching, it fol-lows that kbind2p1(¯i) (see Equations (12) and (16)) equals 0.023 s−1(where ¯iis the average membrane-bound polymer length at equilibrium). With the dissociation constantκfixed at 0.2µM, it follows that the lower bounds ofkbind1andkbind2 are 0.142µM−1s−1and 0.0284 s−1, respectively.
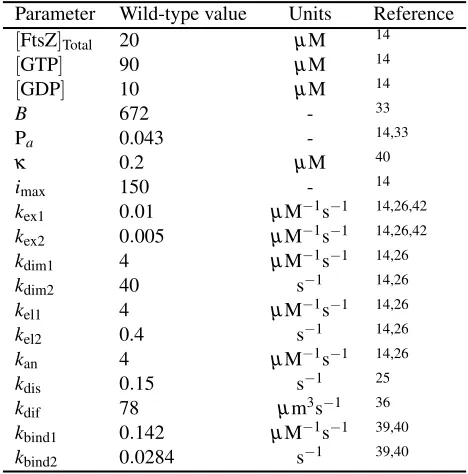
[image:9.612.308.542.101.338.2]For the wild-type parameter values as shown in Table 1,
Table 1Wild-type parameter values
Parameter Wild-type value Units Reference
[FtsZ]Total 20 µM 14
[GTP] 90 µM 14
[GDP] 10 µM 14
B 672 - 33
Pa 0.043 - 14,33
κ 0.2 µM 40
imax 150 - 14
kex1 0.01 µM−1s−1 14,26,42
kex2 0.005 µM−1s−1 14,26,42
kdim1 4 µM−1s−1 14,26
kdim2 40 s−1 14,26
kel1 4 µM−1s−1 14,26
kel2 0.4 s−1 14,26
kan 4 µM−1s−1 14,26
kdis 0.15 s−1 25
kdif 78 µm3s−1 36
kbind1 0.142 µM−1s−1 39,40
kbind2 0.0284 s−1 39,40
the NDSolve function of Wolfram Mathematica 8 was used to numerically solve the ODEs as provided in Appendix B. As described in Appendix E, including both the diffusion of FtsZ into the midcell region in a more physically realistic man-ner and an explicit model of membrane binding, prevents the truncation artefact arising in the Surovtsev model where long polymers accumulate thus increasing the concentrations of large polymers up toimax. CAM-FF predicts that the average FtsZ polymer length for the membrane-bound population is 14 subunits, which is considerably lower than in the Surovtsev model.14The average membrane-bound FtsZ polymer length of 14 subunits for the total of 504 polymers membrane-bound at equilibrium, gives a total polymer length of 29.3µm. This is sufficient to span the circumference over 11 times. This overlap of short FtsZ filaments on the membrane is consistent with the hypothesis that Z-ring formation proceeds by overlap of short FtsZ polymers.13In the wild-type, our model predicts that the average polymer length at equilibrium for soluble FtsZ is 4 subunits in both the cell caps and midcell regions.
In the Surovtsev model, 80% of the cell complement of FtsZ was found at the midcell due to the enforced confinement to this region.14In CAM-FF, the percentage incorporation of FtsZ into the membrane-bound Z-ring is predicted to be 28%, in accordance with the value measured experimentally of 30– 35%.39,43
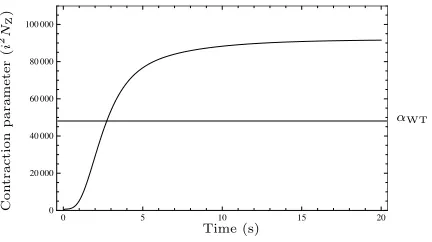
[image:9.612.49.257.325.457.2]in-creases reaching its maximum value on formation of the Z-ring.
Table 1: Wild-type parameter values
Parameter Wild-type value Units Reference [FtsZ]Total 20 µM [? ]
[GTP] 90 µM [? ]
[GDP] 10 µM [? ]
B 900 - [? ]
Pα 0.057 - [? ? ]
κ 0.2 µM [? ]
imax 150 - [? ]
kex1 0.01 µM−1s−1 [? ? ? ]
kex2 0.005 µM−1s−1 [? ? ? ]
kdim1 4 µM−1s−1 [? ? ]
kdim2 40 s−1 [? ? ]
kel1 4 µM−1s−1 [? ? ]
kel2 0.4 s−1 [? ? ]
kan1 4 µM−1s−1 [? ? ]
khyd 0.15 s−1 [? ]
kdif 78 µm3s−1 [? ]
kbind1 0.16 µM−1s−1 [? ? ]
kbind2 0.032 s−1 [? ? ]
is a time delay between GTP hydrolysis and polymer dissociation. These assumptions will be addressed in
future work.
0 5 10 15 20
0 20 000 40 000 60 000 80 000 100 000
Time (s)
Con
traction
p
arameter
(¯
i
2N
Z
)
αWT
Fig. 2: The contraction parameter�increases to a maximum value on formation of the Z-ring. The threshold value for the wild-type solutionαWTis assumed to lie at the midpoint of the extreme values. Parameter values as shown in Table 1.
Results and discussion
The effect of various mutations on the population of membrane-bound FtsZ at equilibrium is summarised
in Table 2.
5
Fig. 4The contraction parameterχincreases to a maximum value on
forma-tion of the Z-ring. Parameter values as shown in Table 1.
4 The contraction parameter predicts division
outcome
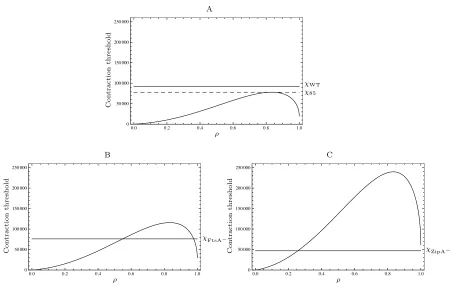
The key parameter in CAM-FF is the contraction parameterχ which is a useful tool to predict the ability of cells to initi-ate and continue Z-ring contraction. Once contraction is ini-tiated, the evolution of both the contraction parameter and the contraction threshold determine whether Z-ring constriction proceeds to completion. For the Z-ring radius to continue to decrease, χ must remain greater than αρ(1+γρ�1−ρ2). If the width of the Z-ring is assumed to be constant during contraction,γis constant at 8 (cf.Equation (29)) and the con-traction threshold is a function ofρ, the dimensionless ratio of the radius of the Z-ring at timet to the initial radius. The plot of χ vs ρ is given in Figure 5 for the wild-type case. CAM-FF predicts three possible division outcomes: (i) divi-sion proceeds to completion, (ii) dividivi-sion is initiated but stalls prior to completion and (iii) division is not initiated. These scenarios are highlighted in Figure 5, on the assumption that the contraction parameterχ remains constant throughout the division process. The value of the initiation thresholdα is currently unknown. Therefore, using the wild-type parame-ters, the value ofαis set on the assumption that the wild-type contraction parameter valueχ is sufficient to allow full divi-sion with the capacity to lose 15% of its value before dividivi-sion behaviour is affected. In Figure 5, the initiation thresholdα is set to 20,000. The value ofα determines the peak of the threshold curve or the “completion threshold”.
4.1 Predicting division behaviour in cells depleted of FtsA or ZipA
Deletion of an anchor protein in CAM-FF alters the values ofB, the total number of membrane-binding anchors, Pa, the
0.0 0.2 0.4 0.6 0.8 1.0
0 20 000 40 000 60 000 80 000 100 000
ρ
χWT χ(i) χ(85)
χ(ii)
χ(iii)
Con
traction
th
resh
old
(
αρ
(1
+
γρ
�
1
−
ρ
2))
Fig. 5: The threshold value varies as the radius of the Z-ring decreases. The contraction parameter�must exceed this value, at all values of the radius ratio from 1 to 0, for contraction to proceed.
a given population of bound FtsZ. It is therefore less likely that the condition for contraction is met i.e.
that ˆτ >τZ for lower values of Pα, see Equation (27), and the thresholdαis correspondingly increased, see
Equation (29). With the value of the wild-type thresholdα as shown in Figure 4, the model predicts that
the contraction parameter does not reach the threshold value and cells are unable to initiate contraction in
the absence of ZipA. The average length of the bound polymers remains at 15 subunits, as for the wild-type
solution, but the number of bound polymers is reduced from 589 for the wild-type to 364 and the percentage
incorporation falls from 37% to 22%. This prediction is corroborated by the experimental observation that
the Z-ring can still form in the absence of ZipA but that ZipA is essential for cell division to occur [21]. The
model thus accurately predicts the outcome of ZipA deletion.
For the deletion of FtsA, Pα is set to 0.043 corresponding to a total number of anchor proteins of 2260
i.e. ZipA and the FtsEX complex only, again with 30% located on the midcell membrane. As shown in
Figure 6B, the model predicts that the value of the contraction parameter is able to reach the threshold.
Thus contraction will be initiated on depletion of FtsA. However, in this scenario, the difference between
the initiation threshold and the equilibrium value of the contraction parameter is much smaller than in the
wild-type solution, suggesting that the increase in the threshold value on initiation of division may drive the
threshold value above that of the contraction parameter thus contraction may be stalled. This is borne out
by experimental observations. Following induced ZipA depletion inE. coli, cells are no longer able to divide
and appear completely smooth [33], suggesting that for ZipA depletion the initiation of division is prevented.
For induced depletion of FtsA, while cell division is prevented, indentations form above the Z-ring, which
suggests that contraction is initiated but is later arrested, indicating that the model solutions accurately
predict the effect of anchor depletion on contraction initiation.
Attainment of the thresholdα for theinitiation of contraction is not sufficient to predict the ability of
16
Fig. 5The contraction threshold value varies as the radius of the Z-ring
de-creases. Using the wild-type value of the contraction parameterχWTand the 85% tolerance limitχ85, for the parameter values in Table 1,α=20,000. γ=8. Since the contraction parameterχmust exceed the contraction thresh-old at all values of the radius ratio from 1 to 0 for contraction to proceed, the model predicts three division outcomes:χ(i)division proceeds to completion, χ(ii)division is initiated but stalls prior to completion andχ(iii)division is not initiated.
probability that one FtsZ subunit is adjacent to a binding site and the initiation threshold α. Anchor deletion results in an increase in the initiation threshold valueα from the assigned wild-type value sinceα ∝1/Pa. The underlying reason for
this behaviour can be understood from Equation (26). The maximum tension the ring may withstand, ˆτ, is proportional to Paso in the deletion mutant, ˆτis smaller than in the wild-type
for a given population of membrane-bound FtsZ. It is therefore less likely that the condition for contraction is meti.e. that ˆτ>
τZfor lower values of Pa, see Equation (27), and the threshold
α is correspondingly increased, see Equation (29).
If FtsA is depleted, as shown in Figure 6C (B=450, Pa=0.029), we expect the initiation threshold to increase
toα=29,665 and outcome (ii) is predicted: division is
ini-tiated but stalls prior to completion. The predicted average membrane-bound FtsZ polymer length remains at 14 subunits but the percentage incorporation falls to 21%. Experimental data for a mutant with FtsA depleted shows that the Z-ring is still formed, indentations are observed above the Z-ring but division is prevented,44 in accord with the model prediction that division is initiated but later arrested.
The loss of ZipA changes the parameters to B=222, Pa=0.014, and the effect is shown in Figure 6D. The
[image:10.612.308.537.73.196.2] [image:10.612.60.276.110.231.2]suggested that the loss of division activity on deletion of ZipA was due to the loss of initiation of contraction
of the Z-ring, whereas for FtsA, the model predicts that division is initiated but may subsequently stall
if the value of the contraction parameter cannot remain above threshold which rises following initiation of
contraction.
Although certain aspects of the biological process have been simplified in the model and the molecular
mechanism of the contraction process remains to be elucidated, the definition of a contraction parameter
and the analysis of the time evolution of the parameter allows whole-cell predictions to be made based
on the biochemical activity of FtsZ measured in vitro. The application of such a framework will not only
improve our understanding of the biological process itself, as in the formulation of a hypothesis of the
explanation of the biochemical mechanism of the temperature sensitivity of ftsZ84, but may also be applied
to the optimisation of anti-biotic drug design, such as the suggested inclusion in screening protocols for
small molecules that increase the observed rate of GTP hydrolysis. Further potential drug interactions may
be tested for efficacyin silicoby identification of their effect on key processes of the system.
A
0.0 0.2 0.4 0.6 0.8 1.0 0
50 000 100 000 150 000 200 000 250 000
ρ
Con
traction
th
resh
old
χWT
χ85
B
0.0 0.2 0.4 0.6 0.8 1.0 0
50 000 100 000 150 000 200 000 250 000
ρ
Con
traction
th
resh
old
χFtsA−
C
0.0 0.2 0.4 0.6 0.8 1.0 0
50 000 100 000 150 000 200 000 250 000
ρ
Con
traction
th
resh
old
[image:11.612.70.522.69.354.2]χZipA−
Fig. 10: ATP binding and hydrolysis by the ftsZ84 temperature-sensitive mutant. Solid line: Wild-type solution. All other plots kex1= 3×10⁻⁴µM−1s−1. Dotted line: 43◦C,khyd eff= 0.15 s−1. Dashed lines correspond to reduced temperatures. Short
dash (–): A 2-fold decrease in the rate of ATP hydrolysis,khyd eff= 0.1 s−1. Medium dash (−): A 3-fold decrease in the rate
of ATP hydrolysis,khyd eff= 0.08 s−1. Long dash (—): A 4-fold decrease in the rate of ATP hydrolysis,khyd eff= 0.075 s−1.
(A) ATP:GTP ratio 2:1, [NTP] = 270µM, [NDP] = 20µM. (B) ATP:GTP to 3:1, [NTP] = 360µM, [NDP] = 20µM. (C) ATP:GTP to 4:1, [NTP] = 450µM, [NDP] = 20µM. All other parameters as shown in Table 1.
17
Fig. 6The effect of anchor deletion. (A) The wild-type value of the contraction parameterχWTis shown forB=672, Pa=0.043.χ85indicates the 15% tolerance threshold used to setα=20,000. (B) For the deletion of FtsA (B=450, Pa=0.029,α=29,655), division is initiated but stalls prior to completion. (C) For the deletion of ZipA (B=222, Pa=0.014,α=61,429), division is not initiated. All other parameters as shown in Table 1.
5 Analysis of model assumptions
5.1 Membrane-binding
Although the model accurately predicted the ability of the cell to divide in the absence of either one of the anchor proteins, more subtle features may become apparent if we acknowledge that the interaction of FtsZ with each protein is likely to differ, including the value of the dissociation constant κ, the force of the interactionF, and the strength of the interaction of the anchor protein with the cell membrane. It was assumed in the calculation of the maximum tension sustainable by the Z-ring that the weak point is the interaction of FtsZ with the anchor protein. While this seems plausible for the transmem-brane protein ZipA,44whether this is the case for FtsA is less clear since FtsA is a peripheral membrane protein.29 An ad-ditional anchoring role may be provided by the FtsEX com-plex.37Here, the weak point may be the interaction between FtsE and FtsX. The fact that the model predicts the behaviour of depletion mutants supports our assumptions.
5.2 Polymerisation and dissociation rates
We (and Surovtsevet al.14) assumed (i) the rate of polymeri-sation of GDP-bound FtsZ is zero, and (ii) the GTP hydrolysis event results in the dissociation of an FtsZ subunit, thus break-ing two FtsZ-FtsZ interfaces. In reality, there may be some level of polymerisation of GDP-bound FtsZ and the hydrol-ysis event may disrupt only the FtsZ-FtsZ interface contain-ing the bound nucleotide resultcontain-ing in the dissociation of the parent polymer into two shorter polymers, without the loss of the GDP-bound subunit. While Surovtsev et al.14 assumed that the dissociation of the GDP-bound subunit is instanta-neous (thus all subunits in FtsZ polymers were assumed to be GTP-bound), we introduced the rate constant of FtsZ dis-sociation (following GTP hydrolysis) in accordance with the GTP turnover measured by Romberg and Mitchison25. Al-though technically within CAM-FF all FtsZ subunits within polymers are GTP-bound, apparently in contrast to the report thatin vitroapproximately 20% of the subunits in FtsZ poly-mers are GDP-bound, the reduced rate constant accounts for the time spent in the GDP-bound state following GTP hydrol-ysis.
hydroly-sis/dissociation is equal for soluble and membrane-bound FtsZ and that the rate of nucleotide exchange for FtsZ subunits within polymers is zero. According to structural studies by Oliva et al.45, and molecular modelling by Mingorance
et al.46, the active site is non-occluded leaving the nucleotide free to exchange with the cytosol from within FtsZ polymers. However, Chen and Erickson47 found no evidence of nu-cleotide exchange within FtsZ polymers and Huecaset al.48 reported that while exchange can occur, disassembly occurs first. Therefore our assumption is in accord with the latest ex-perimental evidence. We do not explicitly include the role of the putative bundling and stabilising (reduced GTPase activ-ity) proteins that also localise to the Z-ring such as the ZapA orthologue YgfE inE. coli.49,50Since at this point in time, ex-perimental data to refine the model are not available. Thus we are implicitly assuming that they are behaving as required.
5.3 Regulation of FtsZ localisation
In CAM-FF, we assumed that FtsZ interacts with anchor pro-teins within the midcell region only, even though the midcell membrane contains only 30% of the total cell complement of anchors. In vivo, this apparently unrealistic assumption is made valid by additional systems that operate to regulate the localisation of Z-rings allowing formation at the midcell only.6
5.4 Changes in fibre geometry as contraction proceeds
In CAM-FF, we assume that the contraction parameter valueχ remains constant throughout the division process. This is un-likely to be true for the later stages of cell division since as the radius decreases, the values of Vmidand Vbndalso change. The properties of the membrane-bound FtsZ population, in-cluding the components of the contraction parameter: the av-erage membrane-bound polymer length and the number of membrane-bound polymers, may also vary. However, it is anticipated that the assumption of constant χ is reasonable for the initial stages of division which actually determines the prediction of division outcome since the peak of the threshold curvei.e. the “completion threshold” is early in the division process atρ=0.833, independent of the value ofα.
Finally, a single diffusion constant for all lengths of FtsZ polymer was used. Extension of the current approximation of diffusion to a spatially continuous model may remove the artefact of the rapid assembly time observed compared to that measured in vivo. Our model predicts that the assembly of the Z-ring is complete within 5 sec, as does the Surovtsev model.14However, the assembly time measured inE. coli in
vivois 1 min.51,52
5.5 Dynamics of contraction
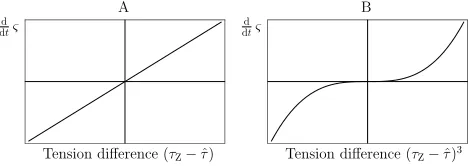
Whenever the maximal Z-ring tension that can physically be sustained by the population of FtsZ polymers assembled is less than that required to maintain a given radius, the Z-ring radius is expected to expand under the force of the cell surface ten-sion. Conversely, whenever the maximum tension sustainable in the Z-ring exceeds the tension required to maintain a given Z-ring radius, we assume that cell constriction proceeds. The relationship between the rate of change of the Z-ring radius and the difference in the maximal tension and the required tension was assumed to be linear, as shown in Figure 7A. De-pending on the molecular mechanism, it is conceivable that the true form of the relationship is non-linear,e.g. proportional to (τZ−τˆ)3as in Figure 7B, or a higher-order power. For the current analysis, the prediction of division outcome is based on the sign of(τZ−τˆ). Therefore, this assumption only con-cerns the the rate of change of the radius.
that the FtsA and FtsEX interactions play a secondary, consolidating role important to the completion (as
opposed to the initiation) of Z-ring contraction.
5.4. Changes in fibre geometry as contraction proceeds
The model assumes that the volume of the cell compartments remains constant over time and the
solutions have not been analysed here for progression of contraction following initiation. As the radius
changes, the values of Vmidand Vbndalso change as do the properties of the bound FtsZ population,
including the components of the contraction parameter: the average bound polymer length and the number
of bound polymers. If the contraction parameter cannot keep pace with the rate of contraction, its value
may subsequently fall below the threshold and contraction will be arrested.
Finally, a single diffusion constant for all lengths of FtsZ polymer was used. It is anticipated that
extending the current approximation of the rate of diffusion to a spatially continuous model may remove
the artefact of the rapid assembly time observed compared to that measuredin vivo.
5.5. Dynamics of contraction
Whenever the maximal Z-ring tension that can physically be sustained by the population of FtsZ
poly-mers assembled is less than that required to maintain a given radius, the Z-ring radius is expected to expand
under the force of the cell surface tension. Conversely, whenever the maximum tension sustainable in the
Z-ring exceeds the tension required to maintain a given Z-ring radius, we assume that cell constriction
pro-ceeds. The relationship between the rate of change of the Z-ring radius and the difference in the maximal
tension and the required tension was assumed to be linear, as shown in Figure??A. Depending on the molecular mechanism it is conceivable that the true form of the relationship is non-linear, e.g. proportional
to (τZ−τˆ)3as in Figure??B, or a higher-order power.
A
d dtς
Tension difference (τZ−τˆ)
B
d dtς
Tension difference (τZ−τˆ)3
20
Fig. 7Relationship between the rate of change of the Z-ring radiusςand the
difference in calculated tensions. (A) In the presented model the relationship is assumed to be linear d
dtς=ϑ0(τZ−τˆ). (B) The true form may be a higher
order powere.g. d
dtς=ϑ0(τZ−τˆ)3.
6 Discussion and conclusions
[image:12.612.304.541.296.379.2]viathe definition of the contraction parameterχ, a useful pa-rameter in the prediction of the ability of cells to initiate and complete cell division.
We used CAM-FF to analyse the effect of reducing the concentrations of membrane-anchoring proteins to understand how their absence inhibits cell division by reducing the num-ber of FtsZ polymers and the percentage of FtsZ molecules in the cell that bind to the membrane. Cell division is still initiated if the less concentrated anchor FtsA is depleted but division stalls before completion. The cells show no sign of even initiating cell division if the more prevalent anchor ZipA is removed. Thus we effectively model whether division oc-curs or not. More work is required to to accurately model the timescale of cell division. In particular a more complicated analysis of diffusion is required, though currently the experi-mental parameters are not available.
Our model is silent on the molecular mechanism of Z-ring contraction except to consider the force required for it. At the molecular level, we implied this constriction as being driven by thermodynamic fluctuations. Biochemically analo-gous processes, such as the contraction of mammalian skeletal muscle, have previously been modelled by a Brownian ratchet mechanism whereby the movement of a motor protein along the actin fibre due to thermal fluctuation becomes unidirec-tional when coupled to a non-equilibrium chemical reaction.53 For the contraction of skeletal muscle, the directionality arises from the conformational changes of the motor protein due to its nucleotide-binding state, where the chemical hydrolysis of the nucleotide is far from equilibrium.54While no equivalent motor protein has hitherto been identified in prokaryotes, the existence of an as yet undiscovered motor protein is neither proposed nor repudiated in the assumption of a relationship between the difference in calculated tensions and the rate of change of the Z-ring radius. In the absence of a motor pro-tein, as in the presented model, the contraction mechanism is nonetheless coupled to a non-equilibrium process by the con-tinual binding and release of FtsZ polymers, dependent on the rate of GTP-hydrolysis. It seemsprima facieplausible that the release and rebinding of FtsZ polymers could create a ratchet mechanism whereby local fluctuations become locked in place by the adjacent binding of further FtsZ polymers.
The presence of multiple membrane anchors may provide a ratchet-type mechanism wherebye.g. ZipA, and potentially the FtsEX complex, are tightly anchored within the membrane but FtsA is more weakly bound and so may be released and rebound during thermal fluctuations, either from the FtsZ or from the cell membrane. Interestingly, FtsA is an ATPase55 suggesting a possible means of chemical coupling to drive uni-directional contraction. The state of the bound nucleotide may affect the interaction of FtsA with FtsZ or the cell membrane or both. In our model, we coupled the thermal fluctuations of the Z-ring radius to the non-equilibrium hydrolysis of GTP by
FtsZviathe rate constantϑ0, Equation (28).
An additional role of the Z-ring that is not included in this work is the recruitment of peptidoglycan remodelling en-zymes on the outside of the inner cell membrane.6As the Z-ring contracts, the peptidoglycan remodelling process poten-tially creates a physical barrier to any subsequent re-expansion of the Z-ring. This barrier formation process would be a pos-itive feedback loop contributing to unidirectional contraction by consolidating the progress made thus far. The mechanics of the bacterial cell wall during division have been modelled by Lanet al.20in a complementary study. We assume that the contraction parameter is constant at the initial stages of divi-sion which is satisfactory for the prediction of incomplete cell division but to be fully confident of the prediction of division, the cell wall must also be considered.
We have established a framework for the further investiga-tion of the effect of modificainvestiga-tions to the biochemical proper-ties of FtsZ and its membrane binding on the initiation and completion of cell division. Application of such a framework will not only improve our understanding of the biological pro-cess itself, but may also be applied to the optimisation of anti-biotic drug design. Potential drug interactions may be tested for efficacy in silico by identification of their effect on key processes of the system. This model may also now be applied to a global model of cell division as proposed by Surovtsev
et al.19.
A ODEs as defined by Surovtsev
et al.
14The change in concentrations of FtsZ molecules over time was given by Surovtsevet al.14in terms of the following rate equa-tions:
d
dtZD=−Rex1+Rex2+R2hyd+R2hyd cyc
+ξ
imax
∑
j=3
(Rhydj +Rhyd cycj ), (A.1)
d
dtZT=Rex1−Rex2−2Rdim1+2Rdim2−R2el1+ξR2el2
−ξ imax−1
∑
j=3
(Rel1j −Rel2j ) +R2hyd+ξR3hyd
+ξ
imax
∑
j=4 2
j−1R
j
hyd+R2hyd cyc, (A.2)
d
dtZ2=Rdim1−Rdim2−R2el1+ξR2el2−R2an2−R2cyc1+R2cyc2
−R2hyd+12ξR3hyd+ξ
imax
∑
j=4 2
j−1R
j