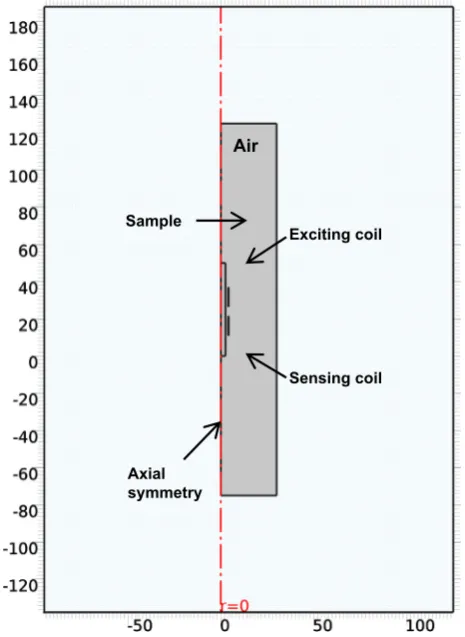
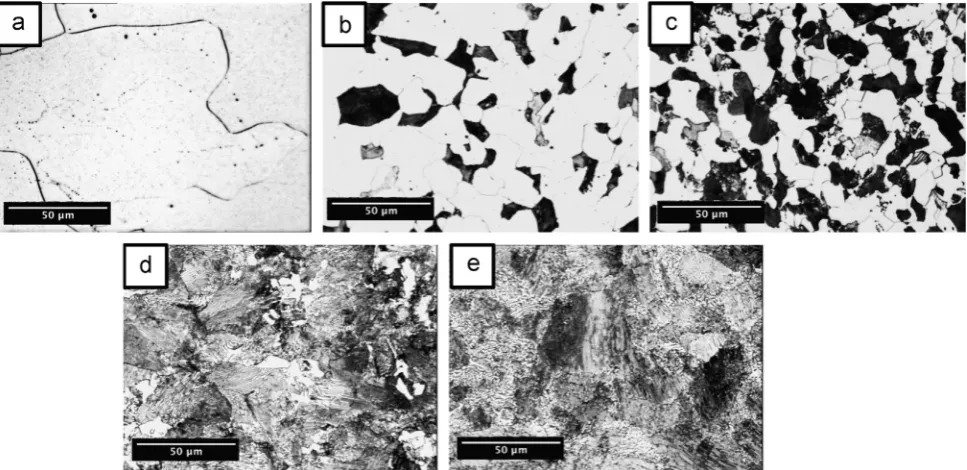
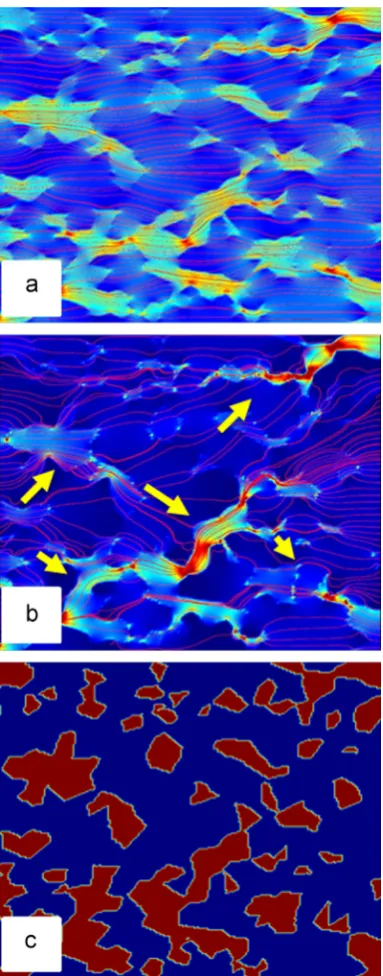
Quantification of the phase fraction in steel using an electromagnetic sensor
Full text
Figure
Related documents
44: Crossing Phase: Driver/Vehicle Turned right 45: Approaching Phase: Vehicle Stopped for observed pedestrian 46: Crossing Phase: Driver/Vehicle Accelerated 47: Approaching
Accurate estimation and forecasting of loads is a necessary enabler for the development of smart grids, energy markets and customer engagement. Starting from 2014 hourly
21 Department of Neurosurgery, Tangdu Hospital, The Second Affiliated hospital of the Fourth Military Medical University, 1 Xinsi Road, Xian, Shanxi Province 710038, People ’ s
Accordingly, the High Court held that Kirk and the company were deprived of knowing what measures they were required to prove were not reasonably practicable.. 3 February
In this PhD thesis new organic NIR materials (both π-conjugated polymers and small molecules) based on α,β-unsubstituted meso-positioning thienyl BODIPY have been
the Siberian stonechats, whereas the growth rate towards adult wing length is higher in the European stonechats (note, however, that in the European birds the wing
Tracings of electrocardiograms (lead V4) in patients with hyperkalemic familial periodic paralysis before and during spontaneous attacks of paralysis and after disappearance of
Field experiments were conducted at Ebonyi State University Research Farm during 2009 and 2010 farming seasons to evaluate the effect of intercropping maize with
