Original citation:
Suma, Rossella, Stavropoulou, Georgia , Stathopoulou, Elisavet K. , van Gool, Luc,
Georgopoulos, Andreas and Chalmers, Alan. (2016) Evaluation of the effectiveness of HDR
tone-mapping operators for photogrammetric applications. Virtual Archaeology Review, 7
(15).
http://dx.doi.org/10.4995/var.2016.6319
Permanent WRAP URL:
http://wrap.warwick.ac.uk/83909
Copyright and reuse:
The Warwick Research Archive Portal (WRAP) makes this work of researchers of the
University of Warwick available open access under the following conditions.
This article is made available under the Attribution-NonCommercial-NoDerivatives 4.0 (CC
BY-NC-ND 4.0) license and may be reused according to the conditions of the license. For
more details see:
http://creativecommons.org/licenses/by-nc-nd/4.0/
A note on versions:
The version presented in WRAP is the published version, or, version of record, and may be
cited as it appears here.
Virtual Archaeology Review, 7(15): 54-66, 2016
http://dx.doi.org/10.4995/var.2016.6319
© UPV, SEAV, 2015
Received: July 1, 2016 Accepted: July 22, 2016
*Corresponding Author: Rossella Suma, r.suma@warwick.ac.uk
EVALUATION OF THE EFFECTIVENESS OF HDR TONE-MAPPING
OPERATORS FOR PHOTOGRAMMETRIC APPLICATIONS
Rossella Suma
a,*, Georgia Stavropoulou
b, Elisavet K. Stathopoulou
c, Luc van Gool
b,
Andreas Georgopoulos
c, Alan Chalmers
aa WMG, University of Warwick, CV4 7AL Coventry, UK. r.suma@warwick.ac.uk; alan.chalmers@warwick.ac.uk
b ESAT - PSI, VISICS, KU Leuven, Kasteelpark Arenberg 10, 3001 Heverlee, Belgium. georgina.stavropoulou@esat.kuleuven.be; luc.vangool@kuleuven.be
c Laboratory of Photogrammetry, National Technical University of Athens, Heroon Polytechneiou 9, 15780 Athens, Greece. elliestath@central.ntua.gr; drag@central.ntua.gr
Abstract:
The ability of High Dynamic Range (HDR) imaging to capture the full range of lighting in a scene has prompted an increase in its use for Cultural Heritage (CH) applications. Photogrammetric techniques allow the semi-automatic production of three-dimensional (3D) models from a sequence of images. Current photogrammetric methods are not always effective in reconstructing images under harsh lighting conditions, as significant geometric details may not have been captured accurately within under- and over-exposed regions of the image. HDR imaging offers the possibility to overcome this limitation, however the HDR images need to be tone-mapped before they can be used within existing photogrammetric algorithms. In this paper we evaluate four different HDR tone-mapping operators (TMOs) that have been used to convert raw HDR images into a format suitable for state-of-the-art algorithms, and in particular keypoint detection techniques. The evaluation criteria used are the number of keypoints, the number of valid matches achieved and the repeatability rate. The comparison considers two local and two global TMOs. HDR data from four CH sites were used: Kaisariani Monastery (Greece), Asinou Church (Cyprus), Château des Baux (France) and Buonconsiglio Castle (Italy).
Key words: high dynamic range (HDR) imaging, HDR tone-mapping, keypoint detection, image-based 3D reconstruction
Resumen:
Las posibilidades que ofrecen las imágenes de alto rango dinámico (HDR) para registrar la totalidad del rango de iluminación de una escena han propiciado su creciente uso en aplicaciones de patrimonio cultural. Los métodos fotogramétricos actuales permiten la producción semi-automática de modelos tridimensionales (3D) a partir de una secuencia de imágenes. Sin embargo, éstos presentan serias limitaciones en escenas con iluminación dura, resultando en consecuencia la aparición de zonas expuestas o sobreexpuestas. En este tipo de condiciones, el uso de imágenes HDR ofrece la posibilidad de superar este problema. Para evaluar su potencialidad, se presentan en este artículo cuatro operadores diferentes de mapeado tonal (tone-mapping) en imágenes HDR, conocidos como TMOs, cuya misión es convertir las imágenes HDR crudas en un formato adecuado para su uso en algoritmos de vanguardia, y en particular en técnicas de detección de entidades. Los criterios de evaluación que se utilizan para analizar su potencialidad son: el número de entidades detectadas, el número de correspondencias válidas y su índice de repetibilidad. En la comparación se incluyen TMOs, dos locales y dos globales. Se utilizan datos HDR tomados en cuatro sitios patrimoniales: el monasterio de Kaisariani (Grecia), la iglesia de Asinou (Chipre), el castillo de los Baux (Francia) y el castillo de Buonconsiglio (Italia).
Palabras clave: toma de imágenes de alto rango dinámico (HDR), mapeado tonal HDR, detección de entidades, reconstrucción 3D basada en imágenes
1. Introduction
High Dynamic Range Imaging (HDRi) is a technique that enables the acquisition, storage and display of a wider range of luminance values than normal (or Low Dynamic Range (LDR)) cameras allow (Banterle, Artusi,
(a) (b) (c) (d) (e) (f)
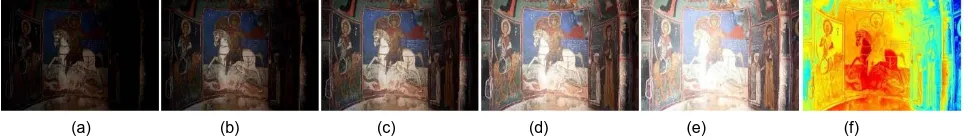
Figure 2: Asinou Church fresco captured with the bracketing technique. The exposures are: a) -2 EV; b) -1 EV; c) 0 EV; d) +1EV; e) +2EV. The last image f) is the result of the merged luminance values represented in false colours, the false colours technique allows the
range of lighting in an HDR image to be visualised on a non HDR display.
often characterised by highly reflective or shiny materials and the presence of shadows and bright areas.
Although HDR video cameras exist (Chalmers et al., 2009), their cost is prohibitive. A less expensive alternative is to use exposure bracketing, as described by Debevec & Malik (1997). The technique involves capturing a sequence of pictures with varying exposure times from a fixed camera position (Fig. 2).
After acquisition, each image in the sequence has well-exposed, under-exposed and over-exposed pixels. The HDR image can then be created by fusing the images together into a single file, selecting only the best exposed pixels. This is achieved by deriving the camera response function and then weighting each pixel’s contribution to the final HDR image. Prior to this process it is necessary to align the images and eliminate flares and ghosting effects. HDR images use 32 bits IEEE floating point values to represent each colour channel in order to fully record all the visual data in a scene. Photogrammetric techniques, on the other hand, have been designed to work with traditional 8-bit LDR images, although some recent proprietary solutions of dealing directly with HDR exist, for example Agisoft PhotoScan.
Tone-mapping is a technique that converts HDR images to perceptually similar LDR images and has been an active research field for more than 20 years. Tone-mapping operators (TMOs) can be broadly divided in two categories depending on their working principle: global and local. Global TMOs process the image as a whole, applying the same computation to every pixel. Local TMOs, on the other hand, process the image pixel by pixel taking into account adjacent pixels. An important aspect of this research field is that not all tone-mapping techniques have been developed for the same purpose. Within the aim of documenting, reusing and processing by means of photogrammetry and computer vision techniques, it is important that the TMO preserves the original appearance, while also being efficient for the applications.
The basic idea behind 3D reconstruction with Structure from Motion (SfM) techniques is to take multiple images
of a certain object from varying viewpoints and then reconstruct the object in a 3D space by triangulating the image sequence matching features (Hartley & Zisserman, 2003). More specifically, the steps to obtain a 3D object starting from images can be categorised as: keypoint detection, description and extraction, image matching and camera pose estimation using bundle adjustment. The outcome of this process is a sparse 3D point cloud, which can then be further densified using Multi-View Stereo (MVS) techniques.
In cases of harsh lighting conditions, the keypoints tend to cluster only in the well-exposed areas of the LDR images, whereas in strongly shadowed or very bright areas there is a lack of texture and subsequently a lack of keypoints. This non-uniform spatial distribution of points, can, as a result, increase the image registration error and potentially compromise the stability of the reconstructed geometry. HDR imaging is, however, capable of overcoming these limitations and therefore presents a more reliable input for the SfM pipeline.
In this paper we address the problems related to the initial steps of SfM with an in depth analysis on how feature detection is affected when applied on images that have been tone-mapped with four different TMOs: the Gradient Domain HDR Compression (Fattal, Lischinski, & Werman, 2002), the local and global version of Reinhard, Stark, Shirley, & Ferwerda (2002)
and a video Tone Mapping Operator called Display Adaptive Tone Mapping (Mantiuk, Daly, & Kerofsky, 2008). Regarding the detection, three of the most popular feature detectors were used: Difference of Gaussians (DoG), a keypoint detection method used by SIFT (Lowe, 1999; Lowe, 2004); Fast Hessian approximation, a process integrated in the SURF (Speeded Up Robust Features) package (Bay, Tuytelaars, & Van Gool, 2006); and, finally, FAST (Features from Accelerated Segment Test), that is based on Accelerated Segment Test (AST) (Rosten & Drummond, 2006). The evaluation in this paper takes into account the number of detected feature points, the number of good matches as well as the repeatability rate.
[image:3.595.56.540.670.740.2](a) EV -2 (b) EV 0 (c) EV +2 (d) Merged HDR
Figure 1: Example of extreme lighting conditions: a, b, c) 3 different exposures of the inside of Asinou church; and d) HDR tone mapped version. With such a great dynamic range no traditional camera can capture the walls and the shape of the windows and the frescoes
The case studies used for our experiments are four archaeological sites in different locations across Europe. Buonconsiglio Castle is the biggest and amongst the most important monuments of Trentino Alto Adige. It is composed of a sequence of different buildings from different periods. The building complex has been the permanent residence of the archbishops of Trento from medieval times until the 18th century. The oldest building Castelvecchio is characterised by an imposing tower Torre Aquila, where the famous Cycle of the Months, one of the most fascinating secular pictorial cycles of the late Middle Ages, is situated. Amongst the most imposing rooms is Loggia Romanina, located in the central part of the castle. The particular fresco selected as dataset for this work is situated on the ceiling of Loggia Romanina.
The Church of Asinou in Cyprus has been a listed UNESCO monument since 1985. This modest church is located in the Troodos mountain region and it is part of a group of 10 different Byzantine churches all richly decorated with murals. The complex attests the variety of artistic influences affecting Cyprus over a period of 500 years. The fresco under examination in particular is a representation of St. George located in the 14th century apse.
The site where Kaisariani Monastery is located was probably dedicated to Aphrodite in Antiquity, before being transformed by Christians in the 5th and 6th centuries. The present katholikon was built in the late 11th century and was dedicated to the Presentation of the Virgin to the Temple. It is a cross-in-square, four-column church. The interior is decorated with wall paintings dated around 1700, while those in the narthex are a little earlier, dated to 1682 and made by Ioannes Hypatios, according to an inscription.
Finally, the last case study is Château des Baux (France), which has been a military bastion since the Middle Age (built from the 11th to the 13th century), because of its location. Amongst one of the most ancient feuds the fortress was the residence of the lords of Baux, which controlled Provence until 1633 over a period of almost five hundred years.
2. Related Work
Digital cultural heritage reconstructions are often created with 3D modelling software such as Autodesk Maya or Blender. Although such reconstructions might serve educational and visualisation purposes, they are usually not suited for geometric and colourimetric documentation. In this type of reconstruction it is quite common to apply textures obtained elsewhere on a simple, manually modelled geometry, as illustrated in
Dylla, Frischer, Müller, Ulmer, & Haegler (2008). However, state-of-the-art 3D reconstruction techniques using HDR images have the potential to produce, not only visually pleasing, but also geometrically accurate models.
A number of previous researchers have suggested that the incorporation of HDR images in the photogrammetric pipeline would be advantageous for archaeological applications and would be worth more investigation (Wheatley, 2011; Ntregka, Georgopoulos, & Quintero, 2014; Guidi, Gonizzi, & Micoli, 2014). However, HDR
imaging has not been frequently used in CH and in photogrammetry.
In Kontogianni, Stathopoulou, Georgopoulos, & Doulamis (2015) a comparative study of keypoint detectors on tone-mapped images with respect to the number of detected points is presented, although only one tone-mapper was considered. Přibyl, Chalmers, Zemčík, Hooberman, & Čadík (2016) performed an evaluation of the suitability of original LDR, native HDR and tone-mapped HDR images with keypoint detectors. According to their work, the TMO elaborated by Fattal et al. (2002), seems to be the most effective method, but we argue that the method is not entirely adequate to give good results if the main purpose is cultural heritage documentation. The colour rendition is not sufficiently accurate and each image has to be tone-mapped individually and independently from the other images taken in the same set, loosing coherence in terms of both brightness and hue.
The TMO proposed by Fattal et al. (2002) is a very effective and quick method to compress the dynamic range of an image, preserving edges and fine details, while maintaining local contrast with very few artefacts such as haloes. The basic idea behind this method is to compress the luminance values by measuring its gradient and working at different scales. On the one hand, the TMO attenuates dramatic luminance changes preserving the gradient direction and, on the other hand, it preserves small changes in the gradient in order to maintain small details as much as possible. This operator is often classified as a local operator (Banterle et al., 2011), because the value of a single pixel will depend on its neighbourhood. The major issue with local operators is that the value of the pixel under study is altered based on the kernel size and the intensity values of its neighbourhood, therefore they can potentially alter the geometry, thus making the SfM reconstruction less reliable.
The display adaptive operator proposed by Mantiuk et al.
(2008) works in two different stages. Firstly, being a global TMO, it applies a monotonically increasing curve, piecewise defined and, secondly, a temporal filter is applied to these tone-mapping curves in order to avoid flickering. This results in a higher homogeneity of the overall brightness. Mantiuk et al. (2008) observed that tone-mapping without knowledge of the target display is not a fully defined problem. This is true in our case, since there is no target display. We thus selected as target display parameter required as an input by this method, a LCD TV seen in dark environment, as this, according to the Recommendation ITU-RBT.2022, is the best viewing condition for LDR displays in a laboratory environment.
Reinhard et al. (2002) is a fairly simple but effective TMO. Inspired by the “dodge and burn” photographic techniques, it has two implementations, one global and one local. The global version uses a log-average luminance evaluation for the scene, and then applies a function which scales high luminance values more heavily than lower low luminance values. In many cases the compression provided is sufficient to preserve detail in low contrast areas, while compressing high luminance pixels. The local tone-mapping version of Reinhard et al.
contrast. For example, the silhouette of a human standing in front of a bright window would constitute a single region. For each pixel a measure of locality is defined considering the largest circular area surrounding it where no large contrast change occurs.
In this paper we have compared these four TMOs on HDR images from real CH case studies, as previously mentioned. To see how effective these TMOs are for photogrammetric applications, we applied three popular feature detectors: Difference of Gaussians, (Lowe, 1999; Lowe, 2004), Fast Hessian (Bay et al., 2006) and FAST (Rosten & Drummond, 2006). The comparison was conducted between the combinations of TMOs and feature detectors, using the number of keypoints, the number of matches and the repeatability rate as criteria (Schmid, Mohr, & Bauckhage, 2000). Additionally, visual inspection was performed by plotting the points on the images and assessing their density and distribution in the image space.
3. Feature Points Detectors
3D object reconstruction relies on accurate detection, description and matching of keypoints. Therefore, local features that will constitute stable and well-localised anchor points need to be identified. According to
Tuytelaars & Mikolajczyk (2008) repeatability, distinctiveness, locality, quantity, accuracy and efficiency are the most important properties for local feature descriptors. In this study we have focused on feature detectors that have been built for computational efficiency, since complex mathematical operations need to be executed for every location in the feature coordinate space (Tuytelaars & Mikolajczyk, 2008).
Difference of Gaussians: DoG is a feature enhancement method that has also been used for keypoint detection in the pipeline of the SIFT (Scale Invariant Feature Transform) descriptor (Lowe, 1999; Lowe, 2004). In this method, image pyramids are created by repeatedly convolving the original image with Gaussian kernels. Then, in each image of the pyramid, every pixel is compared with its 8 neighbouring pixels in the current image as well as with its 9 neighbours of its adjacent Gaussian images. The keypoints are detected as the extrema in the difference between the Gaussian images.
Fast Hessian: Fast Hessian is the detection method adopted in the SURF detector and descriptor algorithm (Bay et al. 2006). This method uses integral images through Hessian-matrix approximation for the detection of keypoints. Box type convolution filters of different sizes are used to approximate second order Gaussian derivatives for each image point. Then the algorithm searches for points where the determinant becomes maximal through non-maximal suppression.
FAST: FAST is a keypoint detection method suitable for real-time applications. It was proposed in 2006 (Rosten & Drummond, 2006) as a modification of the SUSAN corner detector (Smith & Brady, 1997) and outperforms previously used keypoint detectors in terms of speed and repeatability. Its performance is based on the accelerated segment test (AST), which is used to distinguish keypoints from other points by examining the intensity values of 16 pixels that fall in a circular pattern around the candidate pixel. If there are at least N contiguous pixels on that circle that have either higher or lower intensity values than the pixel under examination, then this is considered to be a possible interest point.
In this work, we used the implementations of these methods that are available in the OpenCV library.
4. Methodology
The availability of good quality off-the-shelf DSLR cameras makes it easy to go on CH sites and capture the images needed in order to create a 3D model of the site. The data used for this paper are HDR images of the four cultural heritage sites. These HDR images were subsequently tone-mapped with each of the four considered TMOs (Fig. 3). The four case studies represent an assorted range of common scenarios in heritage documentation.
The first image sequence presents an indoor scene of a side chapel from the Kaisariani Monastery. Windows at the back of the chapel create such variability in the light that a normal camera would not be able to capture. Gold paint or mineral pigments are difficult to fully capture in dim lighting conditions with LDR cameras, for example in an unlit church or castle. The Asinou Church fresco is a dark coloured painting, drawn on an arched wall and the
[image:5.595.57.539.592.747.2](a) (b) (c) (d) (e)
Buonconsiglio Castle fresco is characterised by bright pigments and covers a rather planar part of the ceiling. The Château des Baux Chapel represents a case with harsh lighting conditions, where strong shadows and bright sunlight coexist in the same scene. The Kaisariani Monastery and the Château des Baux Chapel are non-planar scenes, with Kaisariani containing highly detailed architectural objects with intense texture and Le Baux depicting a rather low textured wall. While the Asinou Church and the Buoncosiglio Castle represent a scenario where HDRi enables the capture of fine fresco details.
4.1. HDR images creation
The raw images were captured using DSLR cameras on tripods and the exposure bracketing technique. Depending on the dynamic range of the scene, up to seven different exposures were taken with a full-frame camera. After taking one set of exposures, the viewpoint was changed before taking the next set, so that strongly overlapping stereo pairs were created. The raw data was processed with the MATLAB HDR Toolbox (Banterle et al., 2011), which merges the different exposures using Debevec and Malik’s method (Debevec & Malik, 1997) and a single HDR image is generated.
4.2. HDR tone-mapping
The generated HDR images were tone-mapped with each of the four TMOs: Fattal et al. (2002), Reinhard et al. (2002) in its two variants, and Mantiuk et al. (2008),
from now on referred to as Fattal, ReinhardGlobal, ReinhardLocal and Mantiuk, respectively. Tone-mapping was carried out using the implementations of the TMOs available in the last release (2.0.2) of the open source package pfstools first published by Mantiuk, Krawczyk, Mantiuk, & Seidel (2007). It should be noted that in the pfstools implementation of Fattal, a discrete cosine transform is used instead of a Full Multigrid Algorithm to solve a Poisson discrete equation as suggested in the original paper. This is because the method proposed in the original paper is an iterative solver which has been shown to lose accuracy when applied to higher resolution images, thereby resulting in halo effects and surreal looking images. The used parameters for Fattal are summarised in Table 1.
Table 1: Parameters used for Fattal TMO processing
Parameter Value
Threshold gradient (alpha) 0.01
Strength of modification 0.9
Noise floor 0.001
Saturation 0.4
Threshold gradient (alpha) 0.01
Considering that our aim is an automated pipeline, the chosen parameters for threshold, strength noise and saturation are the ones suggested as default by the original paper.
For Reinhard both the global and the local implementation were tested on the data and, as
suggested by the authors, a gamma correction has been applied. Again, we used, the default parameters mentioned in the original paper (Tables 2 and 3).
Table 2: Parameters used for ReinhardGlobal TMO processing
Parameter Value
Use scales No
Key Value 0.18
Phi Value 1
Table 3: Parameters used for ReinhardLocal TMO processing
Parameter Value
Use scales Yes
Key Value 0.18
Phi Value 1
Number of scales 8
Lower scale size 1
Upper scale size 43
[image:6.595.313.538.551.698.2]Mantiuk, which is a video TMO, was also selected for our test. The idea behind this choice is that photogrammetry requires a sequence of images and, as we are tone-mapping this entire sequence, we wanted to investigate the importance of preserving coherence in brightness and colour appearance for the entire sequence. An additional advantage is that these coherent images can also be used directly to texture the 3D model that results from the SfM implementation. Mantiuk requires a visualisation target and, as discussed above, we selected the best possible condition for the observation of an LDR screen, as mentioned in the Recommendation ITU-RBT.2022. The selected parameters for Mantiuk are listed in Table 4.
Table 4: Parameters used for Mantiuk TMO processing considering a viewing distance of 0.5 m and 30 pixel per visual
degree angle
Parameter Value
Display Function Gamma-gain-black-ambient
Gamma 0.18
Max Luminance of the display(L_max)
500
Black Level 0.5
Ambient Illumination 10 Lux
Reflectivity of the screen 1%
Contrast adjustment 3.8
value was best for our data, we tested it with increasing values including the default one. The relationship between the contrast value and the number of keypoints has a sigmoidal trend. The default value seems to have good results in most cases and has the advantage of not requiring human intervention while processing the images. On the other hand, the tuning of the contrast value improves the results, but it is time consuming. This creates a tradeoff between the time spent finding the perfect contrast value and the automatic tone-mapping with the original image contrast. In our case, a contrast enhancement was preferred, as it was considered more appropriate for our datasets.
4.3. Evaluation Criteria
The comparison of the TMOs was conducted for the purpose of evaluating their suitability for photogrammetric applications and more specifically for image-based 3D reconstructions. Since efficient 3D reconstruction is highly dependent on accurate keypoint detection and matching, the criteria under which the four TMOs and the respective LDR images of middle exposure were evaluated are the number of keypoints, the repeatability rate and the number of matches achieved between stereo pairs.
When an HDR image is processed with a tone-mapping method, its radiometric quality is explicitly affected. Additionally, tone-mapping methods tend to reveal details in regions that are poorly illuminated in LDR images. Therefore, keypoint detectors are expected to perform differently, and ideally better, on tone-mapped images than on the LDR images; the more details are preserved, the more well-defined keypoints will be detected evenly distributed around the scene. Therefore the performance of keypoint detectors on different tone-mapped images is a good initial indicator of the effectiveness of each TMO in preserving detail.
The performance of the detectors on the different tone-mapping methods was assessed first based on the number of keypoints detected in each image. However, this measure by itself may be misleading when it comes to photogrammetric applications, as large numbers of keypoints do not necessarily offer a noise-free and homogenous coverage of the image. It is more important to obtain good and sufficient matches between images in order to increase the robustness of the reconstruction. Thus, visual inspection was also performed, evaluating the distribution of the keypoints and their density.
After the detection stage, feature description and matching were carried out in order to evaluate the TMOs based on the number of matches. More specifically one stereo pair of images was selected from each of the four datasets and each pair was tone-mapped with each of the TMOs under study. Haar wavelet-like filters were used as implemented in the SURF descriptor (using the OpenCV library). For the matching process, the Flann-based (Muja & Lowe, 2009) matcher was applied for pairwise matching using a nearest neighbour search. The matches were then filtered in order to keep the best ones, by comparing the closest match to the second closest, based on Lowe’s ratio test criterion (Lowe, 2004), the so-called good matches. The comparison was conducted between pairs of overlapping images from all four datasets.
The last criterion that was used to assess the keypoint detection and the tone-mapping methods was the Repeatability Rate (RR). First introduced by Schmid et al. (2000), it is considered as a standard criterion that describes how feature point detectors are affected by different image transformations, such as changes in rotation, scale or viewpoint. This method tests whether the same keypoints are detected in both views. The RR is considered analogous to the quality of the detector; the higher the RR value the more robust a detector is to a specific transformation.
Given two images of the same scene under one of the aforementioned transformations, the number of detected points and the location of those points may differ significantly. The repeatability rate (RR) is thus calculated as the ratio of the total number of matches divided by the minimum number of keypoints detected between the two images (Přibyl, Chalmers, & Zemčík, 2012). The repeatability rate 𝑟𝑖 of an image li is thus
defined by:
𝑟𝑖=
|𝑅𝑖|
min(𝑛1, 𝑛𝑖)
where 𝑛1 and 𝑛𝑖 are the number of points detected in the
common part of images 𝐼1 and 𝐼𝑖, respectively, and 𝑅𝑖 is
the number of repeated points. As mentioned by Schmid et al. (2000), the RR can only be defined for planar scenes because the relative geometry between the two views in each image pair can, in that case, be easily described through a planar homography, thus allowing for a simple test on the matching point’s location:
𝑥′= 𝐻 𝑥
where 𝐻 is a 3 x 3 homography matrix and 𝑥′ and 𝑥 the
homogeneous image coordinates of the same point in the test image and the reference image, respectively. In cases of 3D scenes the geometry is not that easily determined, as more complex relations based on epipolar geometry exist between views. In order to enable the mapping of points between the two images, a 3D model of the scene is necessary. As suggested by
Přibyl et al. (2016), if a 3D model is not available, then the problem can be solved by manually annotating a triangular net of the scene. However, in this paper only planar data were used to calculate the RR.
As emphasised by Ehsan, Kanwal, Clark, & Mcdonald-Maier (2010), only the points that lie in the common part of the two images should be taken into consideration. These are subsequently labelled as repeated or not. Additionally, in order to calculate the RR and have comparable results between different detectors, the detection should be carried out by specifying the number of the strongest keypoints that need to be detected, regardless how strong they are, as suggested by Přibyl et al. (2016). We consider an amount of 1000 points to be suitable for calculating an accurate ratio between repeated and total points and at the same time low enough so that they can be detected in all images. Therefore, only the best 1000 points of each image, which lie within the common region of the stereo pair were regarded in the calculation of the RR.
same pair of HDR images. For this purpose the planar data from the Buonconsiglio Castle in Trento was used. As shown in Figure 9, the fresco has been photographed from different viewpoints and the two sequences have been processed and tone-mapped. For the detection of keypoints SIFT (DoG) was used. The comparison is conducted between pairs of tone-mapped images with different viewpoints and it is calculated as the ratio of keypoints between a given image and a reference image.
As stated by Schmid et al. (2000), the repeatability criterion should take into consideration the uncertainty of the detection, since a detected point in one image might not appear in the exact respective position in the other image, but rather in the neighbourhood of this position. Thus a threshold ε is set which defines the radius around the x’ image coordinates within the matching point should be found. The choice of the specific threshold immediately affects the RR since a larger radius signifies a larger search area and the possibility to have a point repeated is higher. Thus the threshold should not be too high to incorrectly label neighbouring pixels, but neither too small so that it fails to find the correct points. In recent literature this threshold has been set as less than 1% of the total image size (Přibyl
et al., 2012; Přibyl et al., 2016). In our case, given the size of the images, a value of ε =10 pixels was considered an appropriate but rather strict threshold –it is less than 0.5% of the total image size.
5. Results
5.1. Keypoint Detection
Figures 4 and 5 illustrate the average number of keypoints and how four different TMOs and the original LDR image perform under the selected keypoint detection methods. As it can be seen (Fig. 4), Mantiuk performs better than ReihardLocal and ReinhardGlobal and the middle exposed original LDR image. ReinhardGlobal is marginally better than ReinhardLocal.
Fattal is shown separately and in comparison with only Mantiuk (Fig. 5), since it detects significantly more keypoints than any of the other three TMOs. In fact, the number of keypoints can be considered excessive (see also Appendix I). Especially the combination of FAST and Fattal can produce a number of keypoints that is higher than 5% of the image pixels (around 1 out of 20 pixels is detected as a keypoint). This can be attributed to Fattal’s ability to intensify the contrast in dark regions, enhancing poorly visible detail but also image noise.
The results were also inspected visually by plotting all the detected points on the images. In Fig. 7, an image of a fresco in the Asinou Church is used to illustrate the density of the points and their distribution in the image area across different combinations of TMOs and detectors. In terms of density, as expected, the combination of FAST and Fattal produces an excessive amount of points that almost completely covers the image. Although the coupling of Fattal and the Fast Hessian or DoG detectors produces less intense results, the density of points is still relatively high even in regions where the fresco lacks in relevant details –a good indicator that Fattal tends to unnecessarily intensify contrast, due to its local action based on a small
0 200000 400000 600000 800000 1000000
Mantiuk Fattal
Number of Keypoint (Mantiuk-Fattal)
[image:8.595.313.531.83.237.2]FAST SIFT (DoG) SURF (Fast Hessian)
Figure 5: Comparison of the average number of keypoints detected with FAST, SIFT and SURF for Fattal and Mantiuk
Figure 4: Comparison of the average number of keypoints detected with FAST, SIFT and SURF for Mantiuk,
ReinhardGlobal, ReinhardLocal and LDR.
0 30000 60000 90000 120000 150000 180000
Number of Keypoints
FAST SIFT (DoG) SURF (Fast Hessian)
Figure 6: The LDR has almost no keypoints in the shade. However, in the Mantiuk’s toned-mapped image the distribution of the detected keypoints is more uniform as the
[image:8.595.313.544.556.708.2]neighborhood around each pixel. Regarding Reinhard’s methods, as it can be seen in Figs. 3 and 7, they produce images with low contrast, a fact that is also reflected in the density of keypoints. Regarding the points’ spatial distribution, apart from Fattal, the rest of the TMOs produce more points in highly textured areas. As it can be seen in Fig. 7, more points are detected on
[image:9.595.66.544.169.719.2]the halo of the Saint and on the inscription at the lower right corner and almost none on the blue painted wall. However, Figure 6 demostrates the ability of the HDR images to enhance poorly visible detail and subuquently to improve the distribution of keypoints even in dark or very bright areas.
Figure 10: Good matches for TMO Mantiuk on Buonconsiglio Castle fresco (first 100 matches).
5.2. Matches
Keypoint matching was performed between sequential images of the datasets. The overall average results on all datasets for the number of matches and the number of good matches are presented in Figs 8 and 9, respectively.
The average number of total matches on Fattal tone-mapped images outperforms the other methods on all
datasets, as many more points are detected (Appendix II).
In the Mantiuk tone-mapped image sets, more points are detected than either of the Reinhard methods or the original LDR images, especially while using the FAST feature detector. ReinhardGlobal and ReinhardLocal produce a similar number of matches for FAST, DoG and Fast Hessian, which in both cases outperforms those of LDR images (Fig. 8).
After Lowe’s criterion for discarding false matches (ratio test), the SURF detector (Fast Hessian) is proven to be more efficient than the FAST and DoG as the number of matches that pass the ratio test is increased significantly (around three times larger). Indeed, the combination of tone-mapped images with Mantiuk’s TMO with Fast Hessian gives the best percentage of good matches (Fig. 9). ReinhardLocal is the least robust method, while the number of good matches appears comparable between ReinhardGlobal and LDR images. Figure 10 illustrates an example of the best 100 matches that have passed Lowe’s ratio test.
5.3. Repeatability Rate
The values in Table 5 show that Mantiuk has the highest repeatability rate (RR) among the TMOs, followed by ReinhardGlobal, Fattal and the ReinhardLocal case. RR values are high for LDR images as well, at the same level as ReinhardGlobal. However, it should be emphasised that the results are highly dependent on the threshold values ε and the number of keypoints detected in the images.
One important observation that becomes evident from the results in Table 5 is the fact that the high number of keypoints is not necessarily a symptom of their quality, as proven in the case of Fattal. The RR for Fattal is, in fact, the second-lowest RR, with only 0.38.
Figure 9: When it comes to good matches again Mantiuk and Fattal outperform Reinhard and LDR. The SURF detector however seems to produce better quality matches whereas the performance of the FAST descriptor decreases significantly.
0 5000 10000 15000 20000 25000
Number of Good Matches
FAST DoG Fast Hessian
Figure 8: Fattal and Mantiuk outperform the Reinhard methods and the LDR image in terms of number of matches. As expected, for all the operators the FAST detector has produced the highest number of matches since it detects more points.
0 150000 300000 450000 600000 750000 900000
Number of Matches
[image:10.595.314.540.311.559.2] [image:10.595.64.279.467.663.2]Table 5: Repeatability rate calculated for different tone-mapping
methods with ε=10 pixels. The number of keypoints detected in
each images was retained in 1000 points.
TMO RR
Fattal 0.38
Mantiuk 0.5
ReinhardGlobal 0.45
ReinhardLocal 0.33
LDR 0.46
6. Conclusions
In this paper four different tone-mapping methods were compared in terms of their suitability for photogrammetric applications. The results suggest that Mantiuk’s method is a more suitable TMO for such procedures since both the number of detected keypoints and the number of matches are high enough yet not excessive. Mantiuk also obtains the best RR score, demonstrating that, although it might not offer the highest number of points, those points are of better quality. In fact, in the case of Fattal TMO, the quantity of detected keypoints is higher, but this does not imply a better quality in scene reconstruction but rather computationally intensive, time-consuming and prone-to-error image matching and registration. Regarding the Reinhard’s methods, surprisingly, they produce almost the same number of keypoints as the original LDR images. This might be attributed to the fact that Reinhard’s method yields poor reproduction of details in brightly illuminated regions as demonstrated in Ledda, Chalmers, Troscianko, & Seetzen (2005).
Therefore we suggest that, out of the four TMOs considered, Mantiuk TMO should be chosen because:
it performs very well in all the performed tests;
offers a more natural accurate colour rendition;
as it is a video TMO, it offers brightness coherence and homogeneity throughout the entire sequence of the image set;
being a global TMO there is no risk of altering the geometry of the image, thereby compromising the geometric accuracy of the 3D model produced.
This paper has shown that, despite the availability of a plethora of HDR TMOs in literature, not every one of them is well-suited to the specific task of cultural heritage site documentation and 3D reconstruction. Moreover, most of the tone-mapping algorithms have previously been evaluated in terms of appeal to the human observer. Our future work will continue exploring the potential of HDR TMOs specifically built for computer vision applications, in particular those that improve the robustness of the geometry for 3D reconstruction purposes.
Acknowledgements
We would like to thank Kurt Debattista, Timothy Bradley, Ratnajit Mukherjee, Diego Bellido Castañeda and Tom-Bashford Rogers for their suggestions, help and encouragement.
We would like to thank the hosting institutions: 3D Optical Metrology Group, FBK (Trento, Italy) and UMR 3495 MAP CNRS/MCC (Marseille, France), for their support during the data acquisition campaigns.
This project has received funding from the European Union’s 7th Framework Programme for research, technological development and demonstration under grant agreement No. 608013, titled “ITN-DCH: Initial Training Network for Digital Cultural Heritage: Projecting our Past to the Future”.
References
Banterle, F., Artusi, A., Debattista, K., & Chalmers, A. (2011). Advanced high dynamic range imaging: theory and practice. Natick, MA, USA: CRC Press. http://dx.doi.org/10.1201/b11373
Bay, H., Tuytelaars, T., & Van Gool, L. (2006). Surf: Speeded up robust features. Computer Vision and Image Understanding, 110(3), 346–359. http://dx.doi.org/10.1016/j.cviu.2007.09.014
Chalmers, A., Bonnet, G., Banterle, F., Dubla, P., Debattista, K., Artusi, A., & Moir, C. (2009). High-dynamic-range video solution. In ACM SIGGRAPH ASIA 2009 Art Gallery and Emerging Technologies: Adaptation p. 71.
http://dx.doi.org/10.1145/1665137.1665190
Debevec, P., & Malik J. (1997). Recovering high dynamic range radiance maps from photographs. In Proceedings of the 24th Annual Conference on Computer Graphics and Interactive Techniques (SIGGRAPH '97) (pp. 369–378). New York, NY, USA: ACM Press/Addison-Wesley Publishing Co. http://dx.doi.org/10.1145/258734.258884
Dylla, K., Frischer, B., Müller, P., Ulmer, A., & Haegler, S. (2008). Rome reborn 2.0: a case study of virtual city reconstruction using procedural modeling techniques. Computer Graphics World, 16, 62–66.
http://dx.doi.org/10.15496/publikation-2869
Ehsan, S., Kanwal, N., Clark, A. F., & Mcdonald-Maier, K. D. (2010). Improved repeatability measures for evaluating performance of feature detectors. Electronics Letters, 46(14), 998–1000. http://dx.doi.org/10.1049/el.2010.1442
Guidi, G., Gonizzi, S., & Micoli, L. L. (2014). Image pre-processing for optimizing automated photogrammetry performances. ISPRS Annals of Photogrammetry, Remote Sensing and Spatial Information Sciences, 2(5), 145–152.
http://dx.doi.org/10.5194/isprsannals-II-5-145-2014
Hartley, R., & Zisserman, A. (2003). Multiple view geometry in computer vision. Cambridge University Press.
http://dx.doi.org/10.1017/CBO9780511811685
Kontogianni, G., Stathopoulou, E. K., Georgopoulos, A., & Doulamis, A. (2015). HDR imaging for feature detection on detailed architectural scenes. The International Archives of Photogrammetry, Remote Sensing and Spatial Information Sciences, 40(5/W4), p. 325–330. http://dx.doi.org/10.5194/isprsarchives-XL-5-W4-325-2015
Ledda, P., Chalmers, A., Troscianko, T., & Seetzen, H. (2005). Evaluation of tone mapping operators using a high dynamic range display. ACM Transactions on Graphics (TOG), 24(3), pp. 640–648.
http://dx.doi.org/10.1145/1073204.1073242
Lowe, D.G. (1999). Object recognition from local scale-invariant features. In Computer Vision. The proceedings of the seventh IEEE international conference on, 2, pp. 1150–1157. http://dx.doi.org/10.1109/ICCV.1999.790410
Lowe, D.G. (2004). Distinctive image features from scale-invariant keypoints. International Journal of Computer Vision, 60(2), 91–110. http://dx.doi.org/10.1023/B:VISI.0000029664.99615.94
Mantiuk, R., Krawczyk, G., Mantiuk, R., & Seidel, H. P. (2007). High dynamic range imaging pipeline: Perception-motivated representation of visual content. In: Human Vision and Electronic Imaging XII, 6492, San Jose, USA, SPIE.
http://dx.doi.org/10.1117/12.713526
Mantiuk, R., Daly, S., & Kerofsky, L. (2008). Display adaptive tone mapping. ACM Transactions on Graphics (TOG), 27(3), 68:1–68:10. http://dx.doi.org/10.1145/1360612.1360667
Muja, M., & Lowe, D.G. (2009). Fast approximate nearest neighbors with automatic algorithm configuration. VISAPP (1), 2, 331–340.
Ntregka, A., Georgopoulos, A., & Quintero, M. S. (2014). Investigation on the use of HDR images for cultural heritage documentation. International Journal of Heritage in the Digital Era, 3(1), 1–18. http://dx.doi.org/10.1260/2047-4970.3.1.1
Přibyl, B., Chalmers, A., & Zemčík, P. (2012). Feature point detection under extreme lighting conditions. In Proceedings
of the 28th Spring Conference on Computer Graphics. ACM, pp. 143–150.
http://doi.acm.org/10.1145/2448531.2448550
Přibyl, B., Chalmers, A., Zemčík, P., Hooberman, L., & Čadík, M. (2016). Evaluation of feature point detection in high dynamic range imagery. Journal of Visual Communication and Image Representation, 38(1), pp. 141–160.
Reinhard, E., Stark, M., Shirley, P., & Ferwerda, J. (2002). Photographic tone reproduction for digital images. In ACM Transactions on Graphics (TOG), 21(3), ACM, pp. 267–276. http://dx.doi.org/10.1145/566654.566575
Rosten, E., & Drummond, T. (2006). Machine learning for high-speed corner detection. In Computer Vision–ECCV 2006, Springer Berlin Heidelberg, pp. 430–443. http://dx.doi.org/10.1007/11744023_34
Schmid, C., Mohr, R., & Bauckhage, C. (2000). Evaluation of interest point detectors. International Journal of Computer Vision, 37(2), pp. 151–172. http://dx.doi.org/10.1023/A:1008199403446
Smith, S. M., & Brady, J. M. (1997). SUSAN—a new approach to low level image processing. International journal of Computer Vision, 23(1), pp. 45–78. http://dx.doi.org/10.1023/A:1007963824710
Tuytelaars, T., & Mikolajczyk, K. (2008). Local invariant feature detectors: a survey. Foundations and Trends in Computer Graphics and Vision, 3(3), pp. 177–280. http://dx.doi.org/10.1561/0600000017
Appendices
Appendix I: Number of keypoints detected in each image for the four datasets.
Fattal Mantiuk
Reinhar d Global
Reinhard
Local LDR
Kaisariani FAST Image0 Image1 Image2 Image3 Image4 611151 623696 634557 686520 672965 6955 17900 26474 24624 25847 4419 7898 8800 9614 9634 4923 9670 10519 11636 11803 8392 13803 15127 14073 14597 DoG(SIFT) Image0 Image1 Image2 Image3 Image4 149090 139199 150785 178438 165459 4197 9671 13743 12381 12984 3033 4883 4857 5338 5600 2956 5179 5241 5702 6022 4874 7476 7366 6705 7024 Fast Hessian (SURF) Image0 Image1 Image2 Image3 Image4 94694 98830 105924 111896 108050 5540 11934 16241 15244 16166 3882 6077 6297 6788 7030 3733 6548 6713 7276 7544 5675 8647 8433 8022 8631 Asinou FAST Image0 Image1 Image2 928575 919266 1024468 85074 134136 144721 27341 33153 40167 28696 35254 29784 42633 54387 87412 DoG(SIFT) Image0 Image1 Image2 194306 200359 289431 23345 49158 45971 9632 13123 9054 8487 11290 4093 13677 15802 23652 Fast Hessian (SURF) Image0 Image1 Image2 125768 124709 126653 18045 35873 21190 5449 7189 3268 4365 5687 1320 8181 8353 9120 Buonconsiglio
FAST Image0
Image1 476544 517057 93432 118225 27710 20548 1758 1699 14822 11708
DoG(SIFT) Image0
Appendix II: Comparison between the number of matches and number of good matches after the ratio test for one image pair per dataset. The pairs of images tone-mapped with different methods. For the keypoint detection, three different detectors were used.
Kaisarini Fast
Hessian Fattal Mantiuk ReinhardGlobal ReinhardLocal LDR Matches Good M 94694 16023 5540 2604 3882 1698 3733 1732 5675 2233
DoG Fattal Mantiuk ReinhardGlobal ReinhardLocal LDR Matches Good M 149090 5751 4197 1154 3033 725 2956 706 4874 915
FAST Fattal Mantiuk ReinhardGlobal ReinhardLocal LDR Matches Good M 611151 10799 6955 1010 4419 673 4923 652 8392 926 Asinou Fast
Hessian Fattal Mantiuk ReinhardGlobal ReinhardLocal LDR Matches Good M 147225 37035 26473 8022 12590 5703 11548 5215 16387 7153
DoG Fattal Mantiuk ReinhardGlobal ReinhardLocal LDR Matches Good M 194306 7039 23345 1588 9632 1414 8487 1226 13677 1646
FAST Fattal Mantiuk ReinhardGlobal ReinhardLocal LDR Matches Good M 928575 14690 85074 2554 27341 1139 28696 1008 42633 1732 Buonconsiglio Fast
Hessian Fattal Mantiuk ReinhardGlobal ReinhardLocal LDR Matches Good M 91453 30272 34247 16429 15939 6528 1712 713 6696 3035
DoG Fattal Mantiuk ReinhardGlobal ReinhardLocal LDR Matches Good M 145686 7448 27326 4713 11412 2344 1203 258 4917 1001
FAST Fattal Mantiuk ReinhardGlobal ReinhardLocal LDR Matches Good M 476544 12298 93432 4707 27710 1813 1758 193 14822 754 Baux Fast
Hessian Fattal Mantiuk ReinhardGlobal ReinhardLocal LDR Matches Good M 168127 9442 75441 6813 58996 4984 47116 4231 30318 4619
DoG Fattal Mantiuk ReinhardGlobal ReinhardLocal LDR Matches Good M 476156 14559 229600 8196 159239 6004 112699 4260 89948 4279