Please cite this article as: J. T. S. Al-Obaedi, Simulating the Effect of Speed Humps on the U-Turn Traffic, International Journal of Engineering (IJE), IJE TRANSACTIONS C: Aspects Vol. 32, No. 12, (December 2019) 1773-1780
International Journal of Engineering
J o u r n a l H o m e p a g e : w w w . i j e . i rSimulating the Effect of Speed Humps on the U-Turn Traffic
J. T. S. Al-Obaedi*
Roads and Transport Department, College of Engineering, University of Al-Qadisiyah, Iraq
P A P E R I N F O
Paper history:
Received 12 September 2019
Received in revised form 12 October 2019 Accepted 08 November 2019
Keywords:
Microsimulation Traffic Calming U-turn Speed Humps Travel Time
A B S T R A C T
Traffic simulation represents an effective tool for evaluating the suggested alternatives to enhance traffic conditions prior to their application in real sites. U-turn sections represent examples of the complicated sections that cannot be analyzed properly without applying microsimulation approach. Recently, in Iraq, speed humps were applied in prior to the merging locations and U-turn sections to enhance traffic safety. However, the characteristics of traffic at U-turn section with the presence of speed humps have got little attention in previous literatures. This paper uses VISSIM microsimulation model to emulate traffic movements at selected U-turn sites in the cases of with and without speed humps. Three median U-turn sites have been selected where two of these sites have speed humps prior to the turning locations. Real traffic data have been obtained from these sites using video recordings to estimate specific parameters. The developed simulation models were successfully calibrated and validated with the real data. The models have been used in testing different scenarios including the effect of having different locations/ types of speed humps and finding the capacity of U-turn sections. The results showed that closer the speeds hump to the turning location is lower the time spent for merging. The time spent values are increased with the increasing of traffic speeds at humps. Higher capacity value is obtained for the site with an auxiliary lane and speeds hump compared with the other sites.
doi: 10.5829/ije.2019.32.12c.10
1. INTRODUCTION 1
Traffic simulation represents an effective tool for evaluating the suggested alternatives to enhance traffic conditions prior to application in real sites. This is important since it provides the ability to test various scenarios without interrupting real traffic sites [1, 2]. There are three types of traffic simulation techniques; these are macroscopic, mesoscopic and microsimulation. The illustration of these types were described in literature [3]. Among these three types, microsimulation has the ability to deal with complex situations such as merging and gap acceptance behavior [4, 5].
Many microsimulation softwares have been developed in last decades such as AIMSUN, VISSIM,
and PARAMICS. These models were widely
implemented over the world [6]. VISSIM
microsimulation model has been globally used for many complicated geometric layouts [7, 8].
The Microsimulation models, include “Car Following
*Corresponding Author Email: [email protected]
(J. T. S. Al-Obaedi)
rules” that describe the relation between pairs of vehicles for longitudinal movement in terms of the follower’s vehicle acceleration/deceleration rate, “lane Changing rules” that describe the lateral movements of vehicles on the available lanes, and “gap acceptance rules” that define the size of accepted gap for lateral movement [2]. The application of VISSIM has more flexibility in building a simulation models for complicated networks as well as providing reasonable parameters for models calibration and validation. However, VISSIM and the other referred above models have limitations in dealing with replicating drivers’ behavior at specific situations [6].
type of U-turn section is represented by allowing traffic from making U-turn movement at intersection and roundabouts [9-11].
There are many reasons for using of median U-turn at multilane highways such as that to reduce the amount of traffic that use the neighbor coming intersection; however, such benefit found to be only valid with minimal interaction between vehicles [9]. Another reason for using a median U-turn is related by the long distance for the next intersection where the turning is allowed.
Median U-turn regards as a source of traffic congestion creation due to the fact the U-turn movements conflict with traffic at the origin and destination directions. This is related to the mechanism of the turning process and interaction with the opposite traffic. The turn traffic should be decelerating in approaching the U-turn section, stopping, when necessary, at the U-U-turn opening if there is no enough gap to turn, and accelerating when starting merging at the opposing direction. Such turning process forces the opposing traffic to reduce speeds in approaching the turning location. The microscopic behavior of the opposing vehicles is either decelerating, shifting to another lane, or continue moving by ignoring the turning traffic [11].
The geometric layout of the U-turn section may has an acceleration lane that allows storing U-turn traffic that waiting for appropriate gap in the opposite directions. Another benefit regarding the use of acceleration lane is to reduce accident rates at U-turn’s locations [10].
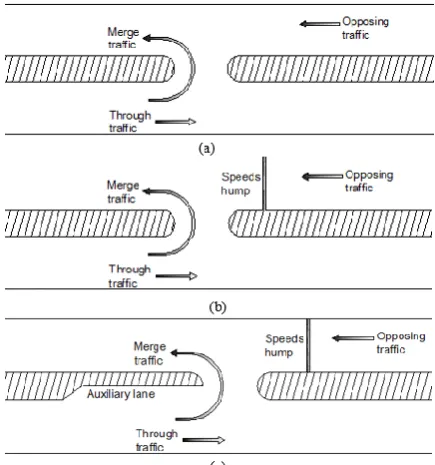
As a type of traffic calming, speed humps have been installed at many U-turn sections to ease the merging process and enhance safety by forcing the opposing traffic (see Figure 1) to reduce speeds [12]. The speed humps are raised obstruction installed over the highways pavement across the whole lanes [13]. Speed humps have the ability to reduce the injury accidents about 41% according to Jateikienė, et al. [14]. Similar findings were obtained by Čygaitė [15] who examined the effect of speed humps in Lithuania. The later suggested that number of killed people were reduced by 100%. Chen et al. [16] suggested that the use of speed humps in New York City reduced the fatal and injury accidents by 33%. Based on data from Iraq U-turn sites, Al-Obaedi [15] reported that speed humps reduced the merging time by more than 50%. Shwaly et al. [17], based on a questionnaire in Egypt, found that both vehicle speeds and accident rates significantly reduced as the effect of speed humps.
Some research works have discussed the negative impacts of speed humps including the increasing of travel time because of speeds reduction. Data from Egypt suggested that the presence of humps would increase the deterioration rates on highways pavement [13, 17]. Litman [18] found significant increasing in pollution rates and fuel consumption because of speed humps.
Regarding the simulation studies, Wu et al. [19]
modeled the U-turn traffic based on game theory concept [20] and suggested that the arrival rate of the U-turn traffic affect the traffic flow of the whole highway section. Many studies have dealt with the evaluation of U-turn traffic at intersections [21, 22]. Li et al. [23] simulated the effect of speed humps on traffic flow using cellular automata model.
So far, many studies have considered the traffic performance at the median U-turn sections. However, limited researches have discussed the performance of median U-turn with the presence of speed humps. In addition, simulation the effect of speed humps with the presence of speed humps at U-turn sites has got limited attention. The novelty of this paper is represented by applying traffic simulation to replicate traffic movements for cases with and without speed humps to examine some related factors such as the type of speed humps, location of speed humps and the effect of geometric layout of the capacity of the U-turn section.
2. METHODOLOGY
In order to build a reliable simulation model for a U-turn section, video recordings for traffic data have been collected from some median U-turn’s sites at Al-Diwaniyah city, Iraq. Three sites have been selected for the study. Figure 1 shows a simple drawing for the geometric layouts of these sites. As shown in this figure, sites 2 and 3 have speed humps on the opposing directions while the first site (site 1) has not. The humps were located about 10m upstream the turning location and having a height of 5cm with a width of 50cm. Among these three sites, only site 3 has an auxiliary lane. The abstracted parameters from the data represents traffic volumes for both merging and opposing traffic, time spent for merging, speeds of vehicles at humps, lane choice for merging and the size of the accepted gaps. Figure 2 shows a snapshot from video recordings for site 2 wiht a hump.
While there are many simulation softwares such as VISSIM, PARAMICS, AIMSUN, and others, VISSIM micro simulator has been used in this study due to its availability and its ability to simulate complicated sections such as the U-turn sites [21].
The selected parameters for comparison between the real data from sites and the simulation model, are the volume of merging traffic and average time spent (ATS) for merging at every five minutes time interval.
the time spend can be accurately obtained from video recordings while it is difficult to obtain the traffic delay from the videos as the delay calculation is related to the desired speed at the approach. In addition, the time spent data can be simply obtained from the simulation models for comparison purposes.
It is believed that it is not accurate to calibrate the simulation model with only one of these parameters. For example, if the comparison is based only on the merging volume, there is no guarantee that the time spent data will be in a good agreement with the simulation model. In addition, the use of time spent data only may satisfied the simulation results with significant differences between actual and simulated merging volumes. Therefore, the two parameters have been selected together in the calibration and validation process. The flowchart in Figure 3 shows the summary of the methodology steps.
3. DATA DESCRIPTION
3. 1. Traffic Volumes and Time Spent Data The traffic volumes of merging traffic, opposing traffic and ATS data for each 5 minutes time interval for sites 1, 2 and 3 is based on the author previous work [11]. The data is presented in the simulation section below of this paper to eliminate repetition. As reported there, the data suggested that the ATS values were mainly influenced by the amount of traffic in opposing direction. In addition, lower ATS values were obtained for the sites with speed humps compared with the site 1 without speeds hump. Please see [11] for further details regarding the parameters affecting ATS.
3. 2. Gap Acceptance and Speeds at Humps The accepted gap for merging is defined here as the separation time (in seconds) between the comings opposing vehicle and the merging vehicle at the time of starting the merging process. This has been extracted from video recordings. The gap acceptance data has been calculated for sites 1 and 2 representing the cases without and with speed humps. Initially, 151 merging cases for site 1 and 225 cases for site 3 has been analyzed. However, and in order to focus on critical situations, the gaps greater than 5 second have been excluded from the data as suggested elsewhere.
Table 1 shows the minimum, maximum, standard deviation, and average accepted gaps for the remaining cases. The results in the table suggest that average accepted gap for site 1 (without speeds hump) is about 3.5 s and about 2.6 s for site 2 (with speeds hump). The reason of such difference is might be related to the effect of speed humps on opposing speeds. In other words, the merging drivers feel by lower risk in the presence of speed humps. This is true since speed measurements using speed gun device has been conducted on a site with
speeds hump and suggested that the average speeds of traffic at the hump is about 20km/h. This is relatively low
Figure 1. Geometric layout for the selected sites: (a) site 1, (b) site 2 and (c) site 3
Figure 2. Snapshots from video recordings for site 2 with a hump
TABLE 1. Size of the accepted gaps for merging for sites 2 and 3
Max. gap (s) Min. gap
(s) Standard
Deviation (s) Average
gap (s) No. of
cases Site No.
4.81 1.79
1.00 3.5
110 1
4.98 0.7
1.28 2.6
150 2
compared with the site without speeds hump (site 1) as the average speeds was about 70km/h based or real observation for the site.
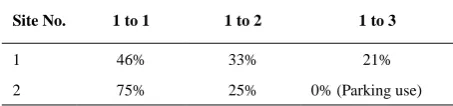
3. 3. Selected Lanes for Merging The selected lanes for merging represents the destination lane of a merger (turner) vehicle in the opposite direction. Real data based on the video recordings for sites 1 and 2 suggested that drivers usually prefer to choose the middle or the outer lane so as increase the turning radii of the movement. The results in Table 2 suggested that for site 1, about half of merging traffic choose the far lane (lane 1) and the rest was distributed between lane 2 (middle lane) and lane 3 (nearest lane). For site 2, the outer lane (i.e. slower lane; lane 1) is usually occupied as a parking lane and therefore 75 of merging traffic choose the middle lane (lane 2) while the rest choose the nearest lane (lane 3).
4. SIMULATION MODELS
This section describes the development, calibration and validation of the simulation models using VISSIM V5.1 software.
4. 1. Models Development Three simulation models were developed using VISSIM micro simulator to replicate real traffic movement for the sites of the study. The geometric layouts, for each model, has entered as it is in the real site. The speed humps are modelled as a “speed reduction area” with an average speed of 20km/h (similar to those speeds obtained from real site at speed humps as discussed earlier).
Based on real observations from video recording, the priority of traffic while merging is modelled as a “yield priority” where turning traffic has to wait enough gap to merge. To overcome some limitations in using VISSIM
TABLE 2. Selected lanes for turning traffic
1 to 3 1 to 2
1 to 1 Site No.
21% 33%
46% 1
0% (Parking use) 25%
75% 2
as described in literature [24], the “waiting time before diffusion” parameter is set to be 600 s to prevent vehicles from diffusion from the simulation system in a case of there is no enough gaps.
4. 2. Models Calibration and Validation The calibration process means finding suitable model’s parameters based on try and error process to get good agreement between real data set and the simulation results. The validation process means using the same parameters that obtained from the calibration process in testing the agreement between real and simulation data for other set(s) of data. If the obtained parameters from calibration process do not satisfy the validation process, the selected parameters should be changes until the simulation results satisfying the data for both data sets used in calibration and validation process.
As discussed earlier in this paper, the selected parameters for calibration and validation are the merging volumes and ATS for merging for each 5 minutes time interval. For each site there are at least nine data sets (nine times five minutes interval) so one of these data sets is selected for the calibration process and the rest data sets are used in validation process. This is a difficult and time consuming process since it requires changing the model parameters (using trial and error) until obtaining reasonable agreement between real and simulated data.
In the simulation model, the running time for the simulation is 10 minutes, the first 5 minutes is regarded as a warm up time while the data gathered from the rest five minutes is used for comparison with the real data. The length of the sections where used in collecting the ATS results from real site is used in the simulation models to obtain the simulated ATS. It might be necessary to mention here the ATS obtained from the simulation is called “travel time” in VISSIM.
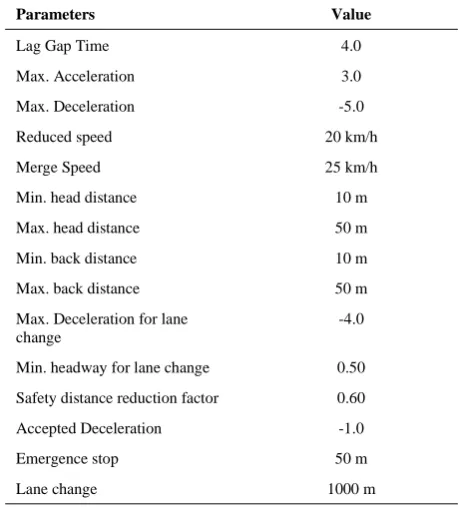
Table 3 shows the actual and simulated merging volume and ATS data for all sites. The table shows good agreement for all the selected sites. The final selected model parameters for site 1 is represented in Table 4. The illustration of these parameters were discussed in the VISSIM user manual. It should be noted here that the actual gap time for the site 3 was 3.6 seconds (as discussed in section 3 above) which is close to the selected value in the simulation model. The average speed of 70km/hr was used for traffic in the opposing direction since no speed humps were installed at the site.
For site 2 (with speeds hump), the lag gap time parameter has been changed to be 2.6 seconds (was 4.0 seconds in site 1) in order to get good agreements between the actual data and the simulation results and as obtained from real data for site 2. The other parameters were not changes.
volumes and that suggests that humps are useful in reducing merging time.
Statistical comparison has also been considered to verify the results. GEH statistics as in (1) is used to compare hourly merging volumes while root mean square error (RMSE) as in (2) is used for ATS results.
TABLE 3. Traffic volume and ATS for the three sites
Observed data Simluation results
Site No.
Time interval
Opposing volume (veh.5min)
Merging volume (veh/5min)
Observed ATS (s)
Merging volume (veh/5min)
ATS (s)
Site 1
1 89 52 8.2 49 8.6 2 95 48 14.2 47 10 3 87 41 10.2 40 9 4 105 39 10.0 41 9.4 5 122 37 14.5 33 10.9 6 128 47 14.1 42 14.8 7 102 38 12.8 37 10.5 8 97 53 12.3 49 10.9 9 98 40 9.5 42 8.6
Site 2
1 58 42 3.75 42 3.71 2 98 40 6.1 37 5.2 3 76 53 4.25 57 4.44 4 74 41 5.05 40 4.52 5 94 36 5.05 38 4.7 6 126 43 7.64 40 7.74 7 115 40 5.36 39 5.74 8 85 36 5.02 37 3.9 9 109 43 7.48 43 6.15 10 100 50 6.18 50 4.6
Site 3
1 142 46 6.64 45 6.7 2 158 48 6.34 49 6.86 3 138 38 6.96 38 5 4 150 56 7.56 58 7.2 5 154 56 5.73 56 6.1 6 106 58 4.2 60 4.6 7 149 57 6.43 55 7.76 8 146 69 7.68 63 7.4 9 129 67 6.04 66 5.55 10 129 75 6.5 69 6.05 11 127 63 6.26 69 6.07 12 119 51 5.8 49 5.43
TABLE 4. The selected model parameters for site 1
Value Parameters
4.0 Lag Gap Time
3.0 Max. Acceleration
-5.0 Max. Deceleration
20 km/h Reduced speed
25 km/h Merge Speed
10 m Min. head distance
50 m Max. head distance
10 m Min. back distance
50 m Max. back distance
-4.0 Max. Deceleration for lane
change
0.50 Min. headway for lane change
0.60 Safety distance reduction factor
-1.0 Accepted Deceleration
50 m Emergence stop
1000 m Lane change
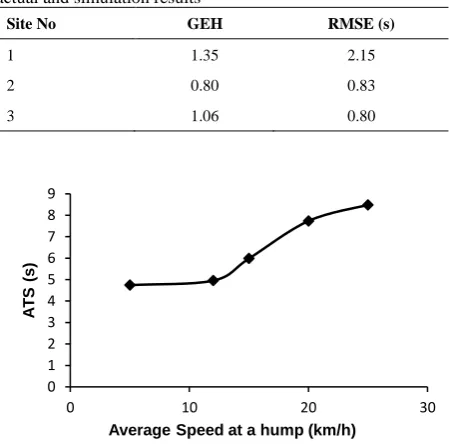
Based on [25] GEH statistic of lower than 5 suggests good fitness between actual and simulated hourly volumes. The RMSE is widely used to compare the simulation error of speeds and travel time [26]. The results that shown in Table 5 suggest that the GEH is a maximum of 1.35 for site 1 which is within the acceptable limits. The RMSE was 2.15 sec for site 1 and lower than 1.0 sec for the site 2 and 3.
Based on above, it can be concluded here that the simulation models for the three sites provides reasonable agreement with the data and therefor, the developed models could be used for further applications in testing different scenarios.
𝐺𝐸𝐻 = √2(S−O)2
(S+O) (1)
𝑅𝑀𝑆𝐸 = √ 1
𝑛 ∑ (𝑂𝑖 − 𝑆𝑖)
2 𝑛
𝑖=1 (2)
where S refers to the simulated data and O refers to the observed (actual data).
5. SIMULATION APPLICATIONS
changing the location of a hump and evaluating the capacity of U-turn section at different geometric layouts.
5. 1. Effect of Speeds at a Hump The developed simulation model based in the geometric layout of site 2 has been selected to test the effect of traffic speed at humps on merging ATS. Speeds at a hump of (5, 12, 20, 20 and 30 km/h) are applied with traffic volumes of 750 veh/h and 1500 veh/h for merging and opposing traffic respectively. Figure 4 shows the results and suggests that higher speeds at a hump is higher ATS values.
The finding here has an importance in selecting the type of humps since it is believed that the type of speed humps are directly influencing the vehicle speeds that passing on the humps. For example, it is reasonable to suppose that vehicles passing over a hump with a height of 5cm are moving slower than vehicles passing over a hump with a height of 3cm. However, a care should be given to reduce the vehicles damage in selecting the types of humps.
5. 2. Effect the Location of a Hump Usually speed humps are located upstream of the merging location (Fig. 1b) to force the opposing traffic to slowdown to reduce the risk of the merging process due to the interaction between merging and opposing traffic. However, there is no limit were defined for the distance between the hump and merging location.
For testing the effect of a hump’s location on ATS, the locations of (10, 20, 30 and 40m) upstream of the U-turn merging location have been tested with a same flow
TABLE 5. Statistical tests for the differences between the actual and simulation results
Site No GEH RMSE (s)
1 1.35 2.15
2 0.80 0.83
3 1.06 0.80
Figure 4. Effect of speeds at a hump on ATS
rate in section 5.1 above. Figure 5 shows the results and suggests that longer the distance between a hump and merging location is higher ATS values. This is because that the opposing traffic has a longer distance to accelerate and increase its speed and that increase the difficulties of merging process. The findings of the results suggested that speed humps should be located very close to merging locations.
5. 3. Capacity of U-turn Section In order to find the capacity of the merging traffic with the traffic volumes in the opposite direction, several traffic volumes for merging traffic are examined with each value of opposing traffic volume. The capacity of the turning (merging) traffic is selected as a higher flow rate just before the creation of traffic congestion. Due to the change in the design layouts of the selected U-turn sites, the capacity of each site was estimated separately using the developed simulation models with identical number of lanes for opposing traffic.
Figure 6 compares the capacities of the three sites and shows that the third site (site 3 with speeds hump and auxiliary lane) has the highest merging capacity comparing with the other two sites. This is due to the presence of an auxiliary lane at site 3 which enables more than one vehicle to merge at time as discussed earlier in this paper. In addition, lowest merging capacity was
Figure 5. Effect of a hump location on ATS
Figure 6. Merging capacity for the simulated sites
0 1 2 3 4 5 6 7 8 9
0 10 20 30
A
T
S
(
s
)
Average Speed at a hump (km/h)
0 1 2 3 4 5 6 7 8
0 10 20 30 40 50
T
im
e
S
pent
(
s
)
Location of a hump before merging (m)
0 200 400 600 800 1000 1200
500 1000 1500 2000 2500 3000
M
e
rging
C
a
pa
c
it
y
(
v
e
h/
h)
Opposing flow (veh/hr)
obtained at site 1 since there is no speeds hump at the site and that increase the difficulty of merging. The results suggested that the use of an auxiliary lane at U-turn sites is essential.
6. CONCLUSIONS
This paper uses VISSIM microsimulation model to emulate traffic movements at selected U-turn sites in the cases of with and without speed humps prior to the U-turn sites. Three median U-U-turn sites, at Al-Diwaniyah city, Iraq, have been selected where two of these sited have speed humps prior to the turning locations. Real traffic data has been obtained from these sites using video recordings to estimate the required parameters including merging and opposing traffic volumes, size of the accepted gaps and desired turning lanes. An evidence obtained from the data suggested that the presence of speed humps cause in significant reduction in the size of accepted gaps for turning and therefore reducing the merging time.
The developed simulation models were calibrated and validated using the real data taken from these sites by considering merging volumes and ATS as parameters for comparison. Good agreement has been obtained and that suggest the ability of VISSIM model to replicate real traffic movements at such complicated sites.
The developed simulation models have been used to test different scenarios including the effect of different locations and types for speed humps and as well as testing the U-turn capacity for different opposing flow rates and geometric layouts. The results showed that closer the speeds hump to the turning site is lower of time spent for merging. In addition, the ATS values were increased with the increasing of speeds at humps and that would influence the selection the types of speed humps. The capacity of each site has been estimated and it is found that the site that has an auxiliary lane and a hump, has the highest capacity and that is encouraging the use of such auxiliary lanes in design of U-turn sites within urban areas. The lowest capacity has been obtained for a site with no hump.
7. REFERENCES
1. Mastio, M., Zargayouna, M., Scemama, G. and Rana, O., "Distributed agent-based traffic simulations", IEEE Intelligent
Transportation Systems Magazine, Vol. 10, No. 1, (2018),
145-156.
2. Al-Obaedi, J. and Yousif, S., "Microsimulation model for motorway merges with ramp-metering controls", IEEE
Transactions on Intelligent Transportation Systems, Vol. 13,
No. 1, (2011), 296-306.
3. Kraft, W.H., Homburger, W.S. and Pline, J.L., "Traffic engineering handbook, (2009).
4. Sánchez-Medina, J.J., Galán-Moreno, M.J. and Rubio-Royo, E., "Traffic signal optimization in “la almozara” district in saragossa under congestion conditions, using genetic algorithms, traffic microsimulation, and cluster computing", IEEE Transactions on
Intelligent Transportation Systems, Vol. 11, No. 1, (2009),
132-141.
5. Müller, E.R., Carlson, R.C., Kraus, W. and Papageorgiou, M., "Microsimulation analysis of practical aspects of traffic control with variable speed limits", IEEE Transactions on Intelligent
Transportation Systems, Vol. 16, No. 1, (2015), 512-523.
6. Lu, L., Yun, T., Li, L., Su, Y. and Yao, D., "A comparison of phase transitions produced by paramics, transmodeler, and vissim", IEEE Intelligent Transportation Systems Magazine, Vol. 2, No. 3, (2010), 19-24.
7. Fan, R., Yu, H., Liu, P. and Wang, W., "Using vissim simulation model and surrogate safety assessment model for estimating field measured traffic conflicts at freeway merge areas", IET
Intelligent Transport Systems, Vol. 7, No. 1, (2013), 68-77.
8. Leng, J., Zhang, Y. and Sun, M., "Vissim-based simulation approach to evaluation of design and operational performance of u-turn at intersection in china", in 2008 International Workshop on Modelling, Simulation and Optimization, IEEE., (2008), 309-312.
9. Combinido, J.S.L. and Lim, M.T., "Modeling u-turn traffic flow",
Physica A: Statistical Mechanics and its Applications, Vol. 389,
No. 17, (2010), 3640-3647.
10. Meel, I., "The optimal design of u-turns on thai highways", Acta
Technica Jaurinensis, Vol. 7, No. 1, (2014), 21-32.
11. Al-Obaedi, J., "Investigation the effect of speed humps on merging time of u-turn traffic", Ain Shams Engineering Journal, Vol. 10, No. 1, (2019), 1-4.
12. Krammes, R. and Sheldahl, E., "Traffic calming on main roads through rural communities", Federal Highway Administration, US Department of Transportation, Washington, DC, (2009). 13. Bekheet, W., "Short term performance and effect of speed humps
on pavement condition of alexandria governorate roads",
Alexandria Engineering Journal, Vol. 53, No. 4, (2014),
855-861.
14. Jateikienė, L., Andriejauskas, T., Lingytė, I. and Jasiūnienė, V., "Impact assessment of speed calming measures on road safety",
Transportation Research Procedia, Vol. 14, (2016), 4228-4236.
15. Cygaite, L., Lingyte, I. and Strumskys, M., "Analysis of vertical traffic calming measures in impacts on road safety and environment in lithuania state roads", in Environmental Engineering. Proceedings of the International Conference on Environmental Engineering. ICEE, Vilnius Gediminas Technical University, Department of Construction Economics, Vol. 9, (2014), 1.
16. Chen, L., Chen, C., Ewing, R., McKnight, C.E., Srinivasan, R. and Roe, M., "Safety countermeasures and crash reduction in new york city—experience and lessons learned", Accident Analysis &
Prevention, Vol. 50, (2013), 312-322.
17. Shwaly, S., Amal, A.-A. and Zakaria, M.H., "Public evaluation of speed humps performance and effectiveness", Civil Engineering
Journal, Vol. 4, No. 6, (2018), 1206-1222.
18. Litman, T., "Traffic calming: Benefits, costs and equity impacts, Victoria Transport Policy Institute Victoria, BC,, Canada, (1999). 19. Wu, W., Liang, Z., Luo, Q. and Ma, F., "Game theory modelling for vehicle u-turn behavior and simulation based on cellular automata", Discrete Dynamics in Nature and Society, Vol. 2018, (2018), DOI: 10.1155/2018/5972495.
20. Petrosjan, L. and Mazalov, V.V., "Game theory and applications, Nova Publishers, Vol. 11, (2007).
International Conference on Measuring Technology and Mechatronics Automation, IEEE. Vol. 3, (2009), 567-570. 22. ElAzzony, T., Talaat, H. and Mosa, A., "Microsimulation
approach to evaluate the use of restricted lefts/through u-turns at major intersections—a case study of cairo-egypt urban corridor", in 13th International IEEE Conference on Intelligent Transportation Systems, IEEE. (2010), 1324-1329.
23. Li, C., Guo, H., Zhang, Y., Wang, W. and Jiang, X., Simulation for the impacts of speed bumps on traffic flow considering driving behaviors’ diversity, in Cictp 2016. 2016.1134-1145.
24. Yousif, S. and Al-Obaedi, J., "Close following behavior: Testing visual angle car following models using various sets of data",
Transportation Research Part F: Traffic Psychology and
Behaviour, Vol. 14, No. 2, (2011), 96-110.
25. Oketch, T. and Carrick, M., "Calibration and validation of a micro-simulation model in network analysis", in Proceedings of the 84th TRB Annual Meeting, Washington, DC., (2005). 26. Al-Obaedi, J., "Development of traffic micro-simulation model
for motorway merges with ramp metering", Salford: University of Salford, (2011),
Simulating the Effect of Speed Humps on the U-Turn Traffic
J. T. S. Al-Obaedi
Roads and Transport Department, College of Engineering, University of Al-Qadisiyah, Iraq
P A P E R I N F O
Paper history:
Received 12 September 2019
Received in revised form 12 October 2019 Accepted 08 November 2019
Keywords:
Microsimulation Traffic Calming U-turn Speed Humps Travel Time
هدیکچ
رد تآ یریگ راکب تهج کیفارت دوبهب و لرتنک یا رب یبولطم و رثوم رازبا کیفارت رتیلومیس رود .دشاب یم یعقاو هاگیاج
رد اریخا .دنشاب یمن زیلانا لباق اهرتیلومیس ورکیم یریگ راکب نودب کیفارت یگدیچیپ زا هنومن اههارراهچ و عطاقم نادرگرب ورکیم زا هلاقم نیا .تسا تیمها زئاح عبانم رطن زا هک دش هتفرگ راکب نادرگرب رود عطاقت زا لبق ریگ تعرس عناوم قارع هرهب دیوج یم . یارب کیفارت زا یعقاو یاه هداد .تسا هتفرگ رارق یبایزرا درومدریگ تعرس نودب و اب نادرگرب رود لکش هس
هک .تفرگ رارق شیامزآ دروم یعقاو یکیفارت یاه هداد اب اهرتیلومیس ورکیم .دیدرگ یروآ عمج هژیو یاهرتماراپ نیمخت ا هتشاد نادرگرب رود یارب یبولطم تیفرظ یباختنا لدم نادرگرب رود هب ریگ تعرس ندوب کیدزن هک داد ناشن جیاتن .تس
رد ریگ تعرس اب و یفاضا نیلا اب نادرگرب رود یارب ییلااب تیفرظ .دوش یم نادرگرب رود ماجنا یارب نامز شهاک بجوم .دیدرگ لئان لباقم تمس