AUT J. Elec. Eng., 51(1) (2019) 83-92 DOI: 10.22060/eej.2019.14699.5240
Reduced-Reference Image Quality Assessment Based on Saliency Region Extraction
E. Kalatehjari , F. Yaghmaee
Electrical and Computer Engineering Department, Semnan University, Semnan, Iran
ABSTRACT: In this paper, a novel saliency theory-based RR-IQA metric is introduced. As the human visual system is sensitive to the salient region, evaluating the image quality based on the salient region could increase the accuracy of the algorithm. In order to extract the salient regions, we use blob decomposition (BD) tool as a texture component descriptor. A new method for blob decomposition is proposed, which extracts blobs not only in different scales but also in different orientations. Different blob components consist of the location of blobs, blob shape and color attributes are used to describe the texture of the image according to the human visual system conception. A region covariance matrix is calculated from extracted blob components which can easily be interpreted in terms of its eigenvalues. Therefore, the reference image is described as a squared covariance matrix and a good data reduction is achieved. The same process is used for describing the received image in the destination. Finally, the image quality is estimated by using the eigenvalues of two covariance matrices. The performance of the proposed metric is evaluated on different databases. Experimental results indicate that the proposed method performs in accordance with the human visual perception and uses few reference data (maximum 90 values).
Review History: Received: 10 July 2018 Revised: 9 December 2018 Accepted: 6 February 2019 Available Online: 6 February 2019
Keywords:
Reduced-Reference Image Quality Assessment
Human Visual System Blob detection Salient regions
1- Introduction
Over the past years, the role of visual media in everyday life has increased tremendously. The quality of digital images is subject to distortions during various image processing procedures, such as compression and communication. It is vital for the service providers to be able to identify and quantify image quality degradations. Therefore, the image quality assessment algorithms are desirable to estimate the subjective quality of the image affected by various kinds of distortions. The image quality assessment (IQA) algorithms can be categorized into three main groups according to the availability of a reference image: 1) full reference IQA metrics which have full access to the perfect reference images [1-6]Wang, Bovik, Sheikh and Simoncelli [1], [2, 3]. These methods have a mostly limited application due to the lack of availability of the reference image. 2) No-reference image quality assessment (NR-IQA) approaches that operate without any prior knowledge of reference image data [7-11]. These methods offer the greatest freedom and flexibility. The absence of reference image, however, leads to diminishing their accuracy to face a wide variety of distortions compared with the FR-IQA methods. 3) reduced-reference (RR) IQA metrics, which only use partial information about high-quality reference image and evaluate the high-quality of the distorted image by using extracted features at the sender side. RR-IQA indices provide a tradeoff between FR and NR approaches [12-22]. The RR-IQA metrics can be categorized into three different and related groups. The first one consists of those RR-IQA models, which are designed to evaluate the perceptual quality of images, affected by a specific distortion.
feature transmission to the receiver troublesome. Whereas in contrast, for a smaller RR data rate, it is easier to transmit the RR information, but the performance of the RR quality metric is not accurate. Although in recent years the computational cost and the RR data rate have remained unsolved, the RR-IQA methods have achieved a satisfactory level of performance.
In this paper, a novel RR IQA metric is introduced based on structural information of images. The human visual system is sensitive to different orientations and scales. Therefore, the new method is designed to describe the image according to different orientations and scales. Another feature of the human visual system is salient based behavior. Quality degradation has a larger influence on the visually salient positions and hence, these regions should be more carefully processed. Motivated by the relation between visual attention and quality assessment, recently some algorithms were designed based on visual saliency as a quality feature [28, 30]. The new metric extracts the saliency-based features to achieve maximum compatibility with the HVS behavior. Due to the mentioned reasons, a new method is proposed for blob detection and extract the structural features from the salient regions of different orientations and scales. The achieved comparative results demonstrate that the performance of the proposed metric is very good and comparable to the state-of-the-art approaches. Another advantage of the proposed method is its low computational cost due to the simplicity of the algorithm. Hence, the novel metric can make an acceptable balance among the mentioned challenges of the RR-IQA methods.
The rest of this paper is organized as follows. In section 2 the feature extraction step is described. A modified blob descriptor which extracts blobs in different scales and orientations is explained and a review of region covariance and its implementation in our method and quality evaluation is given. Experimental results are presented in section 3. Finally, section 4 presents the conclusion.
2- Proposed method
The framework of the proposed metric contains three steps. First is the feature extraction in which salient regions are determined which contain important and informative regions in images. Therefore, the quality evaluation is closely related to the human processing system. In order to extract the salient regions, we use the blob decomposition visual information (BD) tool as a texture component descriptor. The second step is describing the structure of the extracted blobs, so the Region Covariance metric is used which can easily interpret the image in terms of its eigenvalues. As a result, the image is summarized in terms of eigenvalues which leads to very small RR data rate value. The extracted eigenvalues contain valuable information and are used to estimate the distorted image quality. In the last step, a quality metric is used to evaluate the image quality using the eigenvalues. Figure 1 shows the framework of the novel RR-IQA metric.
2- 1- Feature extraction
In this section, we focus on the image representation which is based on how users perceive and describe textures. Therefore, we extract features which can describe the texture of images and summarize them more efficiently. Also, the extracted features should have been in accordance with human visual
perception. The blob detection technique is used to extract the regions of interest in accordance with human visual system perception. The blob detectors are able to describe the texture of the image [31]. The traditional blob detection methods are based on two assumptions [32]: first, the natural images can be described as a group of Gaussian blobs. Second, the group of similar blobs is existed in most natural images. The first assumption is yield to represent the blob detection techniques based on scale-space. To achieve more compatibility with the HVS system, we suggested a new orientation-based and scale-based blob detection technique. It can extract the region of interest from the image more efficiently compared to traditional techniques.
Fig 1. Flowchart of the proposed image quality metric
2- 1- 1- Salient region extraction
the description of a set of Gaussian blobs and their attributes. In the next sub-section, we explain the blob detection method and related features.
2- 1- 2- Blob detection
Intuitively, a blob is a connected region which is significantly brighter or darker than surrounding neighbors. It is clear that a blob belongs to one local extremum. According to the operator, there are some different methods to extract the image’s blob which are based on differential operators. There are some attributes related to the image’s blob. The attributes are the blob shape, contrast, orientation, and location. Different Textural Components (TC) of the image can be obtained by grouping blobs with similar features. According to [35] using blob group instead of individual blobs has more advantages and provides more information about the conceptual content of the image. In this paper, a new blob extraction method is proposed which is based on differential operators in the different orientations and scales. Lindeberg [32] used the normalized differential Laplacian of Gaussian operator to detect the blobs of the image [32].
2 2 2
norm
L
σσ
L
σ∇
=
∇
. (1)In equation (1) the ∇2 is the Laplacian operator, L
σ is the result of convolving the image with the Gaussian filter. In order to extract the features in both different directions and different scales, the wavelet transform is used instead of the Gaussian filter. It is well known that the wavelet transform function in space domain is as [32]:
(
,) (
,) (
r ,)
g x y =s x y w x y , (2)
where w x yr
(
,)
is the Gaussian operator which representsthe image in different scales and s x y
(
,)
is a complex sinusoid to represent the orientation. The Gaussian envelope looks as follows [32]:(
)
(
(
2(
)
2 2(
)
2)
)
0 0
, exp
r r r
w x y =k −π a x x− +b y y− (3)
And the complex sinusoid is defined as:
(
,)
exp( 2(
(
0 0)
)
S x y = j π u x v y+ +P (4)
where
(
u v0, 0)
and P define the spatial frequency and thephase of the sinusoid, respectively. A scale and multi-orientation Gabor filter bank is constructed and convolved with the image. In order to identify the blobs of the image I, the normalized differential Laplacian of Gabor operator is applied, as well.
( ) ( )
2 2 2
, ,
norm
L
σ θσ
L
σ θ∇
=
∇
(5)In equation (5) L(σ θ, ) is defined as:
( , )
*
( , ),
L
σ θ=
I g
σ θ (6)where g(σ θ, ) is the Gabor filter with scale value σ and orientation value θ. Finally, to determine the position of the blobs, local maxima/minima of the result represented by Laplacian of Gabor is considered. In order to extract the regional extrema of the result, the definition proposed in [36] is used. Therefore, a regional minimum M of the output image f at elevation t is defined as:
(1)
, ( ) ,
( ) \ , ( ) .
p M f p t
q δ M M f q t
∀ ∈ =
∀ ∈
(7)
In equation (7) the δ(1) refers to the morphological dilation
operation at level one. In the same way, the regional maxima
M of the image at level t can be computed as:
(1)
, ( ) ,
( ) \ , ( ) .
p M f p t
q δ M M f q t
∀ ∈ =
∀ ∈
(8)
The union of the regional minima and maxima are defined as the regional extrema of the image.
We obtain the local extrema in eight-connected neighbors. According to normalizing the operator in equation (5), the result of applying it to the image leads to blobs of radius
2r = √ .
2- 1- 3- Blob components
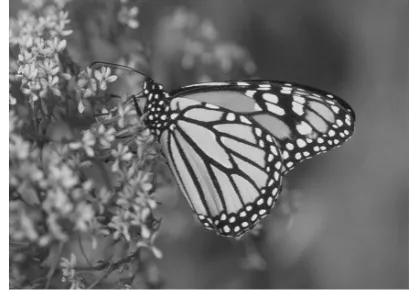
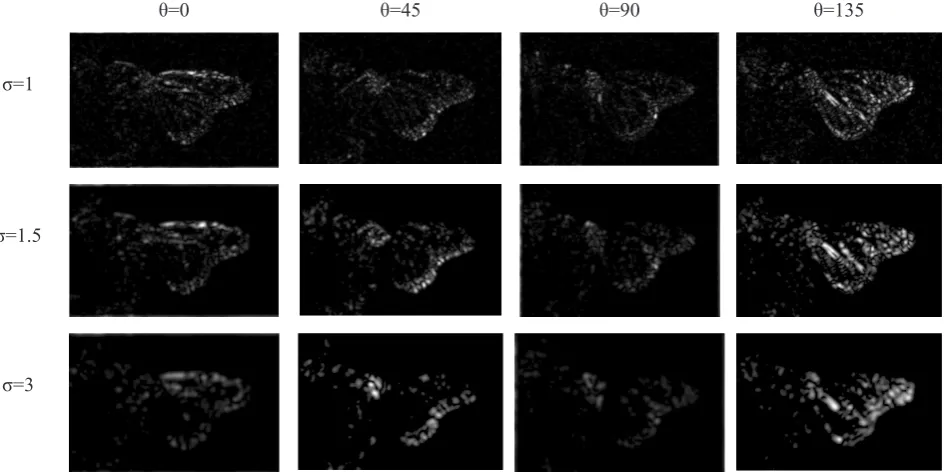
In order to describe the texture of the image, the blob components are used. The blob components used here are the locations of blobs, blob shape attributes, and color attributes. As mentioned before, the blob detector is able to extract the salient regions. To extract the blob components of the color image, all color images are transformed into the opponent color representation to emerge blob information from both intensity and chromaticity variations. The color components are the luminance (L) component, the red-green and blue-yellow chromaticity dimensions. The blob detection operator is applied to three coordinates of the color space. Detecting blobs in the three different dimensions of the opponent space implies some redundancy and to eliminate this redundancy, overlapped blobs are eliminated. The results of detecting blobs of an instance image are shown in Figure 2. It is notable that the images are the results of applying extracted blobs to the luminance image and contain the region of interest of intensity image. It is clear that more details are appeared in the images with lower scales and in the higher scale ones smaller details are removed. On the other hand, by increasing the scale parameter, the response of the filter to the distortion becomes more robust. In Figure 3, an example shows the robustness of the filters with higher scales against the distortion. The filters with low scale parameters are more sensitive to the distortion and can better sense their effects. By increasing the distortion the blobs in the low scale sub-bands cannot determine the region of interest. But the higher scale sub-bands can respond better in higher distortion levels.
Therefore three different scales are selected to obtain a response for all images with different distortion levels with maximum similarity to the HVS. The human visual system is orientation based and exhibits anisotropy distributions of response across the range of orientations. According to the psychological research studies [31, 37, 38], the human visual system is more sensitive to horizontal, vertical, and oblique directions comparing to other directions. Therefore, the proposed algorithm is designed to extract features in the mentioned direction to obtain maximum matching to the human visual perception. When the distortion level is so high that the human visual system is unable to understand the contained images, the blob detector fails to detect the region of interest (ROI) correctly. In order to group blobs with similar features (shape-orientation), the detected blobs of each Gabor filter sub-band, with the same scale and orientation are assumed to be as one single group. It is due to the same scale and orientation of the extracted blobs related to each filter response. Therefore, different sub-bands with the same dimension as the original image are produced. The blobs determine the salient regions but to evaluate the image quality, some related perceptual features are needed. Therefore, every blob is described by a feature matrix which contains nine attributes as Blob Components (BC). The attribute matrix for each Blob is as follows [35]:
[ , , , , , , , , ]
i L
F = X Y W L θ I RG BY µ (9)
In the equation (9), Fi refers to feature matrix of the ith blob,
(X,Y ) refer to the location and (W,L) are width and length of the blob while (I, RG, BY) contain the color attributes of the blob which are the median of chromaticity and luminance of pixels in the blobs. µL describes the grey-level structure around a point q of the image and is defined as [35]:
2
( ) ( ( ))( ( )) (T ) .
L x
q L x L x q x dx
µ
ω
∈
=
∫
∇ ∇ − (10)
Here,
µ
is the windowed second-moment matrix (WSMM)which is introduced by Lindeberg [32],L is the image brightness and
ω
:2→is the normalized window function. For simplicity, an averaging operatorEq is used to describe the windowing operation. The (10) can be rewritten:2
2
( ) x x y
L q
x y y
L L L
q E
L L L
µ =
(11)
As explained before, the blob detector is applied in different scales and orientations to achieve maximum conformity to the human visual perception and therefore, some redundancies have appeared. In order to eliminate the redundancies, all extracted blobs in different scales and orientations and color spaces are considered as the same group and the overlapped blobs are removed. It leads to a group of blobs which determine the region of interest (ROI) of the image and each blob is described by a feature matrix Fi. Hence, the final feature matrix dimension is m×9 in which m is the number of extracted blobs and 9 is the number of features related to each blob. The m value is not constant and depends on the image and distortion level. It means in the same images with different distortion levels the numbers of extracted blobs are different. As the number of features is so large, it should be decreased to be small enough for transmission. Therefore, we should find a good method to describe the extracted features which are from different kinds and reduce the amount of information.
2- 2- Covariance matrix and feature description
It is obvious that describing the image by blobs leads to so many sub-bands as the same size as the original image. But in the reduced- reference IQA methods, the final goal is to reduce the amount of information. Therefore, a feature descriptor is used to reduce the extracted features and make them suitable for transforming to the receiver side. The extracted features are the sub-band images whose shape and content change due to the distortion level. All sub-band
θ=0 θ=45 θ=90 θ=135
σ=1
σ=1.5
σ=3
images are described as a feature matrix, hence the shape, illumination, and color changes can be explained as blob components changes. Depending on the number of extracted blobs, the dimension of the feature matrix is variable. In addition, the blob components are not homogeneous and are from different kinds. Therefore, the descriptor required should be able to describe a set of non-identical and different dimensions features. In this paper, the covariance matrix is used to achieve an efficient summary of the constructed feature matrix. Because this descriptor has the mentioned features. Since the blobs are detected in multi-scale and multi-orientation spaces, extracting blobs leads to some redundancies.To eliminate this redundancy, the blob group (BG) is used and blob attributes which are referred to as blob components (BC) are given in the matrix form. There are four main attributes which describe a blob. These attributes are the location of the blob, the shape attributes, blob color attribute, and structure. In order to use both the chrominance and grey-level information and reduce the computational cost, we employ the covariance matrix motivated by Erdem [40] to integrate these pixel-wise feature vectors within a BC. There are several advantages in describing region by using the covariance matrix. As mentioned before, using the covariance matrix makes it possible to fuse multiple features which might be lying in different domains. The covariance matric for describing regions with d-dimensional feature points has only 2
2
+
d d different values. Unlike Erdrem’s work,
there is no need to reshape the image to a square size and the region S can be represented with a d×d covariance matrix:
(
)(
)
1 1
1
d
T
S i i
i
C f f
d = µ µ
= − −
−
∑
(12)where fi signifies the n-dimensional feature vector extracted from the region S and µ is the mean of these feature vectors. According to the number of the feature vectors, the d-dimension varies. In this paper, nine different feature
vectors are used which leads to a 9×9 covariance matrix and about 2
9 9 452+ = different values. To evaluate the quality of distorted image, it is merely needed to send these values to the receiver side.
2- 3- Quality evaluation
The quality evaluation is the last step in our algorithm. The reference image represented on the sender side and the distorted version of it on the receiver side are represented by the covariance matrix. As mentioned before only 2
2 d +d values are sent to the receiver side as a reduced reference image. In order to evaluate the quality of the distorted image, the method proposed by [41] is used. This metric measures the dissimilarity of two covariance matrices Cs1and Cs2[41]:
(
)
2(
)
1 2 1 2
1
, n ,
S S i S S
i
dis C C Ln λ C C
=
=
∑
(13)In equation (12), ,λi
(
C CS1 S2)
refers to generalized eigenvalues of Cs1and Cs2, computed from:1 2
0
i
C X
S iC X
S iλ
−
=
i=1,…,d. (14)in which Xi ≠0 are the generalized eigenvectors. In the next
section, the experimental results on the different databases are shown.
3- Experimental results
The performance of the proposed method is compared with different state-of-the-art IQAs to depict the efficiency of the new RR IQA metric. We tested the proposed metric on four different benchmark database widely used in the IQA community, including:
1) the LIVE database [39] which contains 29 reference and 779 distorted images spanning five different distortion categories, including JPEG and JPEG2000 compression, white noise, Gaussian blur and a Rayleigh fading channel (fast fading). 2) The TID2008 database [42], which containing 1700 distorted Distortion
Level Scale
value Level 1 Level 2 Level 3 Level 4 Level 5
original
Low Scale
High Scale
images with 17 distortion types at four distortion levels. 3) The CSIQ database [43] which contains 30 original images and 866 distorted ones with six types of distortions at 4 and 5 levels. 4) The IVC database [44] includes 10 original images and 185 distorted images which is generated from four different distortion types. Applying the new method on different databases assures us of the proposed metric performance against different images affected by different distortion types. To validate the performance of the proposed RR-IQA approach, three popular criteria, including the Spearman rank-order correlation coefficient (SROCC), Pearson linear correlation coefficient (PLCC) and the root mean square error (RMSE) are employed. In order to measure the prediction accuracy, the PLCC and the RMSE are used. The SROCC measures the monotonicity. To determine a desirable objective RR-IQA, PLCC and SROCC values should be higher while the RMSE value needs to be lower. As mentioned before, there are subjective DMOS or MOS values associated with every distorted image which are obtained from the opinions of many observers on the perceptual quality of the distorted images. The results of the proposed metric are normalized using an exponential function. Then to regress the predicted quality scores nonlinearly, a regression analysis between objective scores and the given mean opinion scores (MOS) is provided [45].
1 4 5
2 3
1 1
( ) ( )
2 1 exp( ( ))
f x x
x
α α α
α α
= − + +
+ − (15)
where the
{
α α α α α1, , , ,2 3 4 5}
are model parameters and canbe estimated for maximizing the perceptual and objective
scores’ correlations.
3- 1- Individual performance comparison
In order to evaluate the performance of the proposed metric, we investigated the results on the LIVE[39] database because it contains the most popular distortions during image acquisition and transmission. In order to achieve a better conception, the results of the proposed metric are compared with four state-of-the-art RR-IQA metrics (SPCRM-SCHARR [13], RRVSD [21], RRVIF [22] and SIRR [28]). these algorithms are based on the human visual system perception which RRVSD [21] , RRVIF[22] extract features in different directions. The SIRR[28] used salient features and therefor has the same strategy as the proposed method. Contrary to the proposed method, none of them extract salient regions in different scales and orientations. In addition proposed algorithm was compared with two main classic FR-IQA methods (MS-SSIM [6] and PSNR). The reference data length of the SPCRM-SCHARR method can be adjusted to different values from (image size)/32 to 16 and the quantity of reference data with values (image size)/32 and 32 are used in order to have a fair comparison. The reference data length of the RRVSD and RRVIF are 20 and 2, respectively. The reference data for the gray-scale image with a total of L pixels in SIRR[28] is 64
16
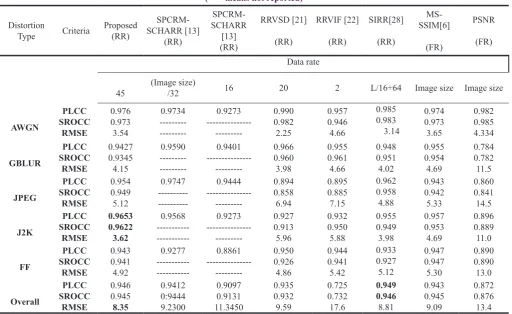
L+ . A successful RR-IQA metric expected to have a higher performance by using fewer amounts of reference data and computational cost, comparing to other RR-IQA metrics. The performance of the mentioned IQA methods on the LIVE database is shown in Table 1. According to the results, the proposed metric has a better performance against the JPEG 2000 compression distortion
Table 1. The performance of the proposed metric and different RR-IQA and FR-IQA on the LIVE database (--- means not reported)
Distortion
Type Criteria Proposed(RR)
SPCRM-SCHARR [13] (RR) SPCRM-SCHARR [13] (RR) RRVSD [21] (RR) RRVIF [22] (RR) SIRR[28] (RR) MS-SSIM[6] (FR) PSNR (FR) Data rate
45 (Image size)/32 16 20 2 L/16+64 Image size Image size
comparing to other IQA methods. Performance on the JPEG compression distortion shows that the proposed metric has the same performance in both SPCRM-SCHARR [13] with data rate equal to (Image size)/32 performs and SIRR [28] with L/16+64, but the data rate of the SPCRM-SCHARR [13] metric is not acceptable here. For other distortion types such as White Noise distortion, the performance of the proposed metric is comparable to other IQA metrics and better than SPCRM-SCHARR [13] algorithm. Therefore, the overall performance of the suggested metrics on the LIVE database is more desirable than other IQA metrics and similar to SIRR [28] metric. The supreme behavior of the presented algorithm can be explained by considering the blob detection behavior against different types of distortion. As the blob detector algorithm extracts features in different scales and orientations, the structural changes by the White Gaussian noise, JPEG and JPEG2000 compression are evaluated well. The reason is increasing the White Noise distortion level that leads to growing up the number of blobs due to the rising of local extremum in the luminance image. The sudden increase and decrease in the number of blobs and the effect of distortion on the image structure and the associated feature have caused the algorithm to react well against the White Noise distortion. In the Fast Fading and Gaussian blur distortion, the number of blobs decreases dramatically in high distortion levels. Due to this fact, these two types of distortions decrease the local luminance extremum. For these two distortion types, the Performance of the proposed metric is acceptable but not as good as the performance against the white noise and JPEG2000 compression distortions. By considering the data rate and performance on different distortions, the proposed method behaves more stable comparing to other IQA metrics. Furthermore, the results of the proposed method on different distortion types are nearly the same. Hence, the overall performance of the proposed metric outperforms the other state-of-the-art RR-IQA metrics and FR-IQA algorithms.
3- 2- Overall performance comparison
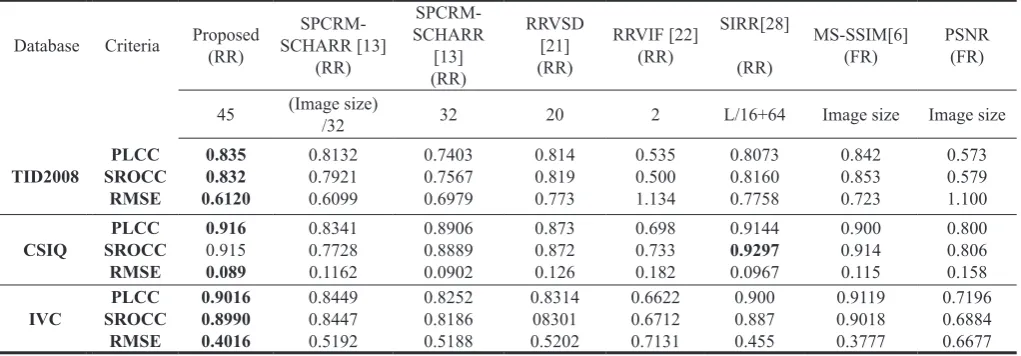
In order to further evaluate the performance of the proposed metric, the average PLCC, SROCC and RMSE results over three other databases are demonstrated in Table. 2 Considering the results of the proposed method on three different databases and comparing them with four RR-IQAs (SPCRM-SCHARR [13], RRVSD [21], RRVIF [22], and SIRR [28]) reveal that
the novel metric behaves better on three databases.
It is due to the good behavior of the blob detection algorithm on the extracting region of interest from distorted images. Overall performance of the suggested method on the CSIQ database is better than two FR-IQAs. It is worth pointing out the CSIQ database has more similarity to the LIVE database than two other mentioned databases. The results of the new algorithm on the other two databases are comparable with FR-IQAs and achieve better performances in some cases. The image quality score of the proposed method is based on three principal factors. First, the shape of the region of interest. Second, the luminance and chrominance of the image pixels and third, the structure of the image in the blob regions. Therefore, any change in the shape or pixels values of estimated regions leads to the change in the objective image quality score. In the high value of distortion, between two descending order of distortion values, there is a sudden change in all mentioned factors. It leads to a sudden change in the related objective quality score which is different from the subjective one. In the IVC database and TID2008 database, there are some situations which we can find this type of sudden changes. These situations happen more than two other databases and therefore, the performance of the novel algorithm on the TID2008 and IVC databases is not as good as on the CSIQ database.
3- 3- computation cost comparison
As mentioned before,a desirable RR-IQA algorithm should have a low computational cost. To evaluate the computational complexity of the proposed algorithm, we compare the computational cost of the proposed metric with mentioned RR-IQA methods. It consists of average running time for each image that includes image reading, feature extraction, and quality estimation from both sender and receiver sides. The implementation of the mentioned RR-IQA metrics is not optimized. The Specifications of our desktop computer hardware are Intel core-i5 3570 CPU 3.4GH and 4GB Ram. The windows 7 64Bit and MATLAB R2013 are our system software. The average runtimes to extract features of a 512×512 image for different methods are listed in Table 3. The results in Table 3 demonstrate that the proposed method has lower computation cost than the RRVSD and the SPCRM-SCHARR and more than the RRVIF and the SIRR metrics. \
Table 2. The results of applying the proposed metric on three different databases
Database Criteria Proposed(RR) SCHARR [13] SPCRM-(RR) SPCRM-SCHARR [13] (RR) RRVSD [21] (RR) RRVIF [22] (RR) SIRR[28] (RR) MS-SSIM[6]
(FR) PSNR(FR)
45 (Image size) /32 32 20 2 L/16+64 Image size Image size
TID2008 SROCCPLCC
RMSE 0.835 0.832 0.6120 0.8132 0.7921 0.6099 0.7403 0.7567 0.6979 0.814 0.819 0.773 0.535 0.500 1.134 0.8073 0.8160 0.7758 0.842 0.853 0.723 0.573 0.579 1.100
CSIQ SROCCPLCC
RMSE 0.916 0.915 0.089 0.8341 0.7728 0.1162 0.8906 0.8889 0.0902 0.873 0.872 0.126 0.698 0.733 0.182 0.9144 0.9297 0.0967 0.900 0.914 0.115 0.800 0.806 0.158
IVC SROCCPLCC
4- Conclusion
In this paper, a novel RR-IQA metric was introduced which is based on the saliency regions and texture description. A good RR-IQA metrics should use less data from the reference image and be able to evaluate the image quality in accordance with the human visual perception. In addition, the framework of the proposed method has only three steps. Therefore, it has a low computational cost due to its simplicity. Experimental results on the LIVE database show that the proposed metric performs well on the different types of distortions and in some cases, it behaves better than other IQA metrics. The novel RR-IQA is able to evaluate image quality without any training process and hence, unlike the RRVSD method, it can be applied to any new databases. Experimental results on different databases show that the proposed image quality evaluator acts well and approximately is similar in all cases. It could be concluded that the proposed metric shows a good stability on the different databases and therefore can be applied to a variety of applications. In the proposed metrics, we can achieve a good balance among the reference data rate, performance, and computational cost.
References
[1] K. Gu, G. Zhai, X. Yang, W. Zhang, An efficient color image quality metric with local-tuned-global model, IEEE International Conference on Image Processing (ICIP), (2014) 506-510.
[2] Z. Wang, A.C. Bovik, H.R. Sheikh, E.P. Simoncelli, Image quality assessment: from error visibility to structural similarity, IEEE transactions on image processing, 13(4) (2004) 600-612.
[3] X. Zhang, X. Feng, W. Wang, W. Xue, Edge Strength Similarity for Image Quality Assessment, IEEE Signal Processing Letters, 20(4) (2013) 319-322.
[4] J. Zhu, N. Wang, Image quality assessment by visual gradient similarity, IEEE Transactions on Image Processing, 21(3) (2012) 919-933.
[5] L. Zhang, X. Mou, D. Zhang, FSIM: A Feature Similarity Index for Image Quality Assessment, IEEE Transactions on Image Processing, 20(8) (2011) 2378-2386.
[6] Z. Wang, E.P. Simoncelli, A.C. Bovik, Multiscale structural similarity for image quality assessment, in: The Thrity-Seventh Asilomar Conference on Signals, Systems & Computers, 1392 (2003) 1398-1402.
[7] K. Gu, G. Zhai, W. Lin, X. Yang, W. Zhang, No-Reference Image Sharpness Assessment in Autoregressive Parameter Space, IEEE Transactions on Image Processing, 24(10) (2015) 3218-3231.
[8] K. Gu, G. Zhai, X. Yang, W. Zhang, Using Free Energy Principle For Blind Image Quality Assessment, IEEE Transactions on Multimedia, 17(1) (2015) 50-63.
[9] W. Hou, X. Gao, D. Tao, X. Li, Blind Image Quality Assessment via Deep Learning, IEEE Transactions on Neural Networks and Learning Systems, 26(6) (2015) 1275-1286.
[10] L. Liu, H. Dong, H. Huang, A.C. Bovik, No-reference image quality assessment in curvelet domain, Signal Processing: Image Communication, 29(4) (2014) 494-505.
[11] W. Xue, X. Mou, L. Zhang, A.C. Bovik, X. Feng, Blind Image Quality Assessment Using Joint Statistics of Gradient Magnitude and Laplacian Features, IEEE Transactions on Image Processing, 23(11) (2014) 4850-4862.
[12] K. Gu, G. Zhai, X. Yang, W. Zhang, A new reduced-reference image quality assessment using structural degradation model, IEEE International Symposium on Circuits and Systems (ISCAS2013) (2013) 1095-1098.
[13] D. Liu, Y. Xu, Y. Quan, P.L. Callet, Reduced reference image quality assessment using regularity of phase congruency, Signal Processing: Image Communication, 29(8) (2014) 844-855.
[14] R. Soundararajan, A.C. Bovik, RRED Indices: Reduced Reference Entropic Differencing for Image Quality Assessment, IEEE Transactions on Image Processing, 21(2) (2012) 517-526.
[15] D. Tao, X. Li, W. Lu, X. Gao, Reduced-Reference IQA in Contourlet Domain, IEEE Transactions on Systems, Man, and Cybernetics, Part B (Cybernetics), 39(6) (2009) 1623-1627.
[16] Z. Wang, A.C. Bovik, Reduced- and No-Reference Image Quality Assessment, IEEE Signal Processing Magazine, 28(6) (2011) 29-40.
[17] G. Zhai, X. Wu, X. Yang, W. Lin, W. Zhang, A Psychovisual Quality Metric in Free-Energy Principle, IEEE Transactions on Image Processing, 21(1) (2012) 41-52.
[18] Y. Zhang, J. Wu, G. Shi, X. Xie, Reduced-reference image quality assessment based on entropy differences in DCT domain, IEEE International Symposium on Circuits and Systems (ISCAS) (2015) 2796-2799.
[19] X. Gao, W. Lu, D. Tao, X. Li, Image Quality Assessment Based on Multiscale Geometric Analysis, IEEE Transactions on Image Processing, 18(7) (2009) 1409-1423.
[20] M. Narwaria, W. Lin, I.V. McLoughlin, S. Emmanuel, L.T. Chia, Fourier Transform-Based Scalable Image Quality Measure, IEEE Transactions on Image Processing, 21(8) (2012) 3364-3377.
[21] J. Wu, W. Lin, Y. Fang, L. Li, G. Shi, I.N. S, Visual structural degradation based reduced-reference image quality assessment, Signal Processing: Image Communication, 47 (2016) 16-27.
[22] J. Wu, W. Lin, G. Shi, A. Liu, Reduced-Reference Image Quality Assessment With Visual Information Fidelity, IEEE Transactions on Multimedia, 15(7) (2013) 1700-1705.
[23] M. Carnec, P.L. Callet, D. Barba, An image quality assessment method based on perception of structural Table 3. Average running time for one image (tested on LIVE database)
Proposed SPCRM-SCHARR [13] RRVSD [21] RRVIF [22] SIRR[28]
information, International Conference on Image Processing (Cat. No.03CH37429), (2003) III-185-188 vol.182.
[24] M. Carnec, P.L. Callet, D. Barba, Visual features for image quality assessment with reduced reference, IEEE International Conference on Image Processing, 1 (2005) 421-424.
[25] S. Mahmoudpour, P. Schelkens, Reduced-reference quality assessment of multiply-distorted images based on structural and uncertainty information degradation, Journal of Visual Communication and Image Representation, 57 (2018) 125-137.
[26] Y. Liu, G. Zhai, K. Gu, X. Liu, D. Zhao, W. Gao, Reduced-reference image quality assessment in free-energy principle and sparse representation, IEEE Transactions on Multimedia, 20(2) (2018) 379-391.
[27] Y. Zhang, T.D. Phan, D.M. Chandler, Reduced-reference image quality assessment based on distortion families of local perceived sharpness, Signal Processing: Image Communication, 55 (2017) 130-145.
[28] X. Min, K. Gu, G. Zhai, M. Hu, X. Yang, Saliency-induced reduced-reference quality index for natural scene and screen content images, Signal Processing, 145 (2018) 127-136.
[29] W. Xue, X. Mou, Reduced reference image quality assessment based on Weibull statistics, Second International Workshop on Quality of Multimedia Experience (QoMEX) (2010) 1-6.
[30] J. Wu, Y. Liu, G. Shi, W. Lin, Saliency change based reduced reference image quality assessment, Visual Communications and Image Processing (VCIP), (2017) IEEE, 1-4.
[31] E.S. Mikhailova, N.Y. Gerasimenko, M.A. Krylova, I.V. Izyurov, A.V. Slavutskaya, Mechanisms of orientation sensitivity of human visual system: Part II. Neural patterns of early processing of information about line orientation, Human Physiology, 41(3) (2015) 229-241.
[32] T. Lindeberg, Scale-Space Theory in Computer Vision, Kluwer Academic Publishers, 1994.
[33] L. Zhang, Y. Shen, H. Li, VSI: A Visual Saliency-Induced Index for Perceptual Image Quality Assessment, IEEE Transactions on Image Processing, 23(10) (2014) 4270-4281.
[34] P. Rosin, A simple method for detecting salient regions, 2009.
[35] S. Alvarez, A. Salvatella, M. Vanrell, X. Otazu, Low-dimensional and comprehensive color texture description, Computer Vision and Image Understanding, 116(1) (2012) 54-67.
[36] P. Soille, Morphological Image Analysis-Principles and Applications, 2003.
[37] D.J. Mannion, J.S. McDonald, C.W. Clifford, Orientation anisotropies in human visual cortex, J Neurophysiol, 103(6) (2010) 3465-3471.
[38] C. Blakemore, F.W. Campbell, On the existence of neurones in the human visual system selectively sensitive to the orientation and size of retinal images, The Journal of Physiology, 203(1) (1969) 237-260.231.
[39] Z.W. H.R. Sheikh, L. Cormack and A.C. Bovik, LIVE Image Quality Assessment Database.
[40] E. E, E. A, - Visual saliency estimation by nonlinearly integrating features using region, J Vis, 13(4) (2013) 11.
[41] W. Förstner, B. Moonen, A Metric for Covariance Matrices, in: E.W. Grafarend, F.W. Krumm, V.S. Schwarze (Eds.) Geodesy-The Challenge of the 3rd Millennium, Springer Berlin Heidelberg, Berlin, Heidelberg, (2003) 299-309.
[42] N. Ponomarenko, V. Lukin, A. Zelensky, K. Egiazarian, M. Carli, F. Battisti, TID2008 - A Database for Evaluation of Full-Reference Visual Quality Assessment Metrics, 2009.
[43] E. C. Larson and D. M. Chandler, Categorical image quality (CSIQ) database, in, March 2010.
[44] F.A. Patrick Le Callet, Subjective quality assessment IRCCyN/IVC database, in.
[45] Final report from the video quality experts group on the validation of objective models of video quality assessment ii, in: v.Q.E.G. (VQEG) (Ed.), 2003.
Pleasecitethisarticleusing:
E. Kalatehjari , F. Yaghmaee, Reduced-Reference Image Quality Assessment Based on Saliency Region Extraction,
AUT J. Elec. Eng., 51(1) (2019) 83-92.