R
ESEARCHA
RTICLEPhysicochemical properties of new peanut (
Arachis hypogaea
L.)
varieties
Hamdy A. Zahran
1,*and Hesham Z. Tawfeuk
21
Fats and Oils Department, Food Industries and Nutrition Division, National Research Centre, 12622 Dokki, Cairo, Egypt
2
Food Science and Technology Department, Faculty of Agriculture and Natural Resources, Aswan University, Aswan, Egypt
Received 20 August 2018–Accepted 28 March 2019
Abstract – Peanuts (Arachis hypogaea L.) are one of the major oilseed crops of the world and are an important source of protein in many countries. In this study, some nutrients and characteristics of the seeds’ oil extracted from four peanut (Arachis hypogaeaL.) varieties: Line 27r (Israel), Line 9 (Malawi), Line 4 (Brazil) and Line 18 (Israel) cultivated, forfirst time, in Upper Egypt were subjected to the comparative assessment with control NC variety (USA). Peanut seeds are a rich source of oil content (50.45 to 52.12 g 100 g1dry weight“DW”). The physicochemical properties of extracted oil were investigated in this study. The obtained data showed that the ratios of saturated fatty acids ranged from 14.24 to 17.23%, and the amounts of unsaturated fatty acids ranged from 82.77 to 85.76%. Significant variations (p0.05) of oil content, saponification value, oleic/linoleic (O/L), and oil characteristics were found. Line 9 was found to be high in oil content, while Line 27r was said to have a high O/L ratio (3.22%) and proportion of unsaturated fatty acids (85.76%).
Keywords:peanuts / peanut oil / physicochemical properties / oil yield / fatty acids
Résumé – Propriétés physicochimiques de nouvelles variétés d’arachides (Arachis hypogaea L.). Les arachides (Arachis hypogaea L.) sont l’une des principales cultures oléagineuses du monde et une source importante de protéines alimentaires dans de nombreux pays. Dans cette étude, certains éléments nutritifs et caractéristiques de l’huile de graines extraits de quatre variétés d’arachides (Arachis hypogaea L.)–la lignée 27r (Israël), la lignée 9 (Malawi), les lignées 4 (Brésil) et les lignées 18 (Israël)–, cultivées, pour la première fois en Haute-Égypte, ont été soumis à une évaluation comparative avec la variété de contrôle NC (USA). Les graines d’arachides constituent une source riche en huile (50,45 à 52,12 g/100 g de poids sec). Les propriétés physicochimiques de l’huile extraite ont été étudiées. Les données obtenues ont montré que les rapports d’acides gras saturés s’étalaient de 14,24 à 17,23 % et que les quantités d’acides gras insaturés allaient de 82,77 à 85,76 %. Des variations significatives (p0,05) de la teneur en huile, de l’indice de saponification, des caractéristiques oléique/linoléique (O/L) et de l’huile ont été trouvées. La teneur en huile de la lignée 9 était élevée, tandis que la lignée 27r était dite avoir un rapport O/L (3,22 %) et une proportion d’acides gras insaturés (85,76 %) élevés.
Mots clés :arachides / huile d’arachide / propriétés physicochimiques / production d’huile / acides gras
1 Introduction
Peanuts (Arachis hypogaeaL.) are known as groundnuts and are related to theLeguminosaefamily. It is grown for oil extraction and also as a food product (Pasupuletiet al., 2013). More than a third of the peanut varieties grown on a global
scale are used as food (Dhamsaniyaet al., 2012). Peanuts are considered an important source of oil, folate, antioxidants, protein, and essential fatty acids (linoleic) (Sebeiet al., 2013). Hence, consumers and industryfields have a growing interest in peanuts (Zhaoet al., 2012). Peanuts are ranked fourth in oilseed crops in the world after soybeans, rapeseed, and cotton. In 2015, peanuts made up 8.7% of the total production of oilseed by contributing 45 million tons of world production. It is also an important oilseed crop for the production of vegetable oils (Arioglu, 2014). About 2/3 of the world’s total *Correspondence:zahran18@itu.edu.tr;
hazahran@hotmail.com
https://doi.org/10.1051/ocl/2019018
Oilseeds & fats Crops and Lipids
OCL
Available online at:peanut production is used to produce oil and the remaining 1/3 is used in food products (Variath and Janila, 2017). In Egypt, there is a great shortage in edible oils so that almost 90% of the consumption needs are currently imported (Zaheret al., 2017). Peanut seeds contain about 44 to 56% oil, 22 to 30% protein, and 9.5 to 19.0% carbohydrate as dry weight (Gulluogluet al., 2016). In addition, it is a good source of minerals (phosphorus, calcium, magnesium, and potassium) and vitamins (E, K, and B group). Fatty acid composition plays a main role in nutritional and storage qualities of peanuts (Shasidhar et al., 2017). Peanut oil contains both saturated (SFA) and unsaturated (UFA) fatty acids (Andersen and Gorbet, 2002). The amount of SFA and UFA fatty acids in peanut oil varies from about 11 to 17% and from 81 to 94%, respectively. Oleic acid (C18:1) content in peanut genotypes can vary from 21 to 85% and linoleic acid (C18:2) from 2 to 43%. Shad et al. (2012) investigated the physicochemical characteristics of the oil and found the specific gravity (0.915 to 0.918), the acid value (3.96 to 4.95 mg g1), the saponification value (226.40 to 246.56 mg g1
), and the unsaponifiable matter (3.20 to 4.20 g 100 g1
). The main fatty acids existing as acylglycerols in peanut oils are palmitic (C16:0), oleic (C18:1), and linoleic (C18:2) acids. Typically, stearic (C18:0), arachidic (C20:0), arachidonic (C20:1), behenic (C22:0), and lignoceric (C24:0) acids exist in minor proportions, while a trace of linolenic fatty acid (C18:3) can be found. These fatty acids represented around 90% of the total fatty acids. The presence of high percentage values of C20:0 and C22:0 in other oils like olive oil could be related to adulteration with peanut oil (Carrín and Carelli, 2010).
The ratio of saturated to unsaturated fatty acids in both crude oils and fats is more important to healthy nutrition (Zahran and Soliman, 2018). According to the American Heart Association (AHA) recommendations and National Health Service (NHS) UK guidelines, between 25 and 35% of your total daily calories should consist of fat. They indicate that the average adult can eat up to 70 g of fat a day, of which no more than 20 g should be saturated and 50 g unsaturated fats. The quality of peanut oil was determined by the ratio of oleic to linoleic acid and iodine value. In addition, the percent of unsaturated fatty acids and stability of peanut oil was determined using iodine value. High-oleic peanuts have a longer shelf-life than low-oleic peanuts and have the best flavor and stability than that of low-oleic peanuts (Chaiyadee
et al., 2013;Gulluogluet al., 2016). Peanut oil contains a high percentage of antioxidants in addition to a high proportion of polyunsaturated fatty acids, and this is desirable because it reduces the amount of cholesterol in the blood as well as low-density lipoprotein content, which may reduce the risk of coronary heart disease (Winet al., 2011).
This study was carried out to determine some nutrients physical and chemical properties, as well as fatty acid profile of peanut oil extracted from new varieties cultivated in Upper Egypt compared to control NC (USA) to find out which varieties are of good quality and are suitable for the Egyptian environment.
2 Materials and methods
2.1 Materials
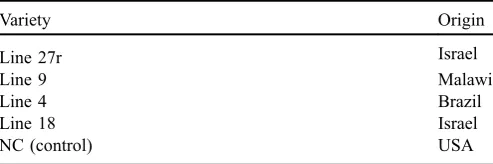
Five genotypes (Tab. 1) of peanuts were grown in Toshka Station, Desert Research Centre, Aswan, Egypt during the summer season of 2017. Peanut varieties namely, Line 27r (Israel), Line 9 (Malawi), Line 4 (Brazil), Line 18 (Israel) and NC (USA) are shown inTable 1. All seeds were brought from the Department of Crop and Soil Science at NC State University, North Carolina, USA and were recommended for cultivation in the arid zone, and irrigated regions of Egypt. The seeds and pod shells were separated manually. The mature and healthy seeds were ground and stored at 4 ± 0.05°C in glass containers for the first day until analysis. All solvents and chemicals were in HPLC grade and purchased from Merck, Darmstadt (Germany). Authentic standards of FAMEs were obtained from Sigma-Aldrich GmbH, Steinheim, Germany.
2.2 Methods
2.2.1 Chemical analysis
Four peanut genotypes and a control group were analyzed for moisture, protein (% N6.25), ash, fat, andfiber, according to methods described in AOAC (1995). Total carbohydrates were calculated by difference (1) based on dry weight:
Total carbohydratesð%Þ¼½100ðproteinþf atþashÞ: ð1Þ
2.2.2 Oil Content and Physicochemical properties of peanut oil
Soxhletapparatus using n-hexane as the solvent was used for the extraction of the oil. The specific gravity of the oil was determined by using pycnometer, and its specific gravity was calculated by the following formula(2):
Specif ic gravity¼density of oil=density of water: ð2Þ
The acid, peroxide, saponification, iodine values, and unsaponifiable matter were determined according to standard methods (AOAC, 1995).
2.2.3 Fatty acid composition
The fatty acid composition was determined by the conversion of oil to fatty acid methyl esters prepared by adding 1.0 mL of n-hexane to 15 mg of oil followed by 1.0 mL of sodium methoxide (0.4 mol), according to the method of Nzikouet al. (2009)with some modifications. The mixtures were vortexed for 30 seconds and were allowed to settle for 15 minutes. The upper phase containing the FAMEs was recovered and analyzed by gas chromatography (GC-FID). FAMEs were analyzed on a Perkin Elmer (model 8700),fitted Table 1. The origin of the used genotypes.
Variety Origin
Line 27r Israel
Line 9 Malawi
Line 4 Brazil
Line 18 Israel
with a non-bonded biscyanopropyle siloxane stationary phase, polar capillary column SP-2340 (60 m0.25 mm), 0.2mm film thickness and a flame ionization detector. Nitrogen (oxygen-free) was used as a carrier gas at a flow rate of 3.5 mL min1. Other conditions were as follows: initial oven temperature, 130°C; ramp rate, 4°C/min; final temperature, 220°C; injector temperature, 260°C; detector temperature, 270°C; temperature hold, 2 minutes before the run and 17 minutes after the run. A sample volume of 1.0mL was injected. FAMEs were identified by comparing their relative and absolute retention times to those authentic standards of FAMEs. All of the quantifications were done by a built-in data-handling program provided by the manufacturer of the gas chromatograph (Perkin Elmer). The fatty acid composition was reported as a relative percentage of the total peak area.
2.2.4 Statistical analysis
The extracted peanut oil sample analyses were conducted in triplicate. The results presented are the mean and standard deviation of the obtained values. The values of the means were statistically analyzed by SPSS computer software (version 17.0). The calculation occurred by analysis of variance one-way ANOVA and followed by TUKEY honestly test, according toSteelet al.(1997).
3 Results and discussion
3.1 Approximate analysis of peanuts varieties
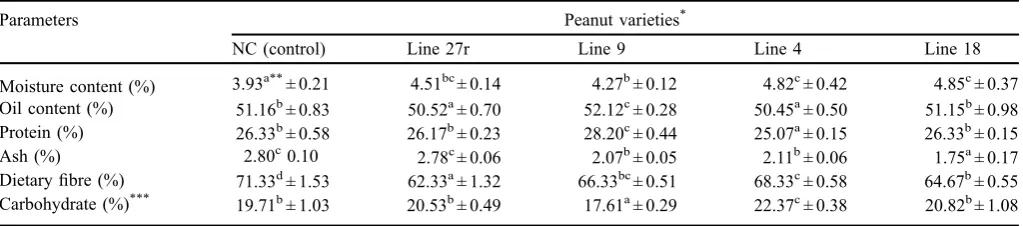
The proximate analysis of the new peanut genotypes and control varieties are shown inTable 2. The obtained results displayed no difference among all the new peanut genotype varieties in moisture content as compared with control: the moisture content ranged from 3.93 to 4.85%. It was noticed that Line 4 and Line 27 have the same value of oil content (50.45 and 50.52%, respectively), which was less than the NC (51.16%); however, line 9 has the highest value of oil content (52.12%). The Line 9 variety was characterized by its higher protein content (28.20%) than that of the NC (control), and Line 18 variety recorded the same value of 26.33%, followed by the Line 27r variety (26.17%) and,finally, the Line 4 variety (25.07%), respectively. The varieties Line 27r, Line 9, and Line 4 showed no significant (p0.05) difference content in
ash (2.78, 2.07, and 2.11%, respectively) as compared with the control (2.80%). The fiber content of the control sample increased significantly to the highest level (71.33%) and decreased to the lowest level (62.33%) in the Line 27r variety. Finally, the carbohydrate content calculated using the difference, and the results clarified that Line 9 variety recorded the lowest level (17.61%), while the sample of Line 4 variety recorded the highest level (22.37%). These results are approached with that obtained byEl-Badrawy et al. (2007), Megat-Rusydi et al. (2011),Eshun et al. (2013)and Sibt-e-Abbaset al.(2015).
3.2 Physicochemical properties of different peanut oil varieties
The results obtained from the study are presented in Tables 3and4.Table 3shows the values of the oil properties measured from the extracted oil from the different peanut varieties. The fatty acid contents of the extracted oil were presented in (Tab. 4).
3.2.1 Oil yields
The content of crude oil in the peanut varieties ranged from 50.45 to 52.12% of DW. A little significant variation in the peanut oil content was observed among thefive varieties. Line 9 variety contained the highest content of oil followed by NC (control), Line 18, and Line 27r. Line 4 had the lowest oil contents. In the different studies byHassanet al.(2005),Isleib
et al.(2008)andGulluogluet al.(2016), it was mentioned that the content of peanut kernel oil ranged from 35 to 56%, according to the genotype and growth factors. Oil percent of peanut species was affected by genotype, seed maturity, growth conditions, geographical area, growing season, and climate status.
3.2.2 Specific gravity
The specific gravity of peanut oil samples ranged from 0.881 to 0.901 (Tab. 3). The obtained data showed that there was no significant difference in all peanut samples. The specific gravity of peanut oil was less than water, and the variance between the oil samples was very small (Shadet al., 2012).
Table 2. The proximate analysis of peanuts varieties (on dry matter basis).
Parameters Peanut varieties*
NC (control) Line 27r Line 9 Line 4 Line 18
Moisture content (%) 3.93a**± 0.21 4.51bc± 0.14 4.27b± 0.12 4.82c± 0.42 4.85c± 0.37 Oil content (%) 51.16b± 0.83 50.52a± 0.70 52.12c± 0.28 50.45a± 0.50 51.15b± 0.98 Protein (%) 26.33b± 0.58 26.17b± 0.23 28.20c± 0.44 25.07a± 0.15 26.33b± 0.15 Ash (%) 2.80c0.10 2.78c± 0.06 2.07b± 0.05 2.11b± 0.06 1.75a± 0.17 Dietaryfibre (%) 71.33d± 1.53 62.33a± 1.32 66.33bc± 0.51 68.33c± 0.58 64.67b± 0.55 Carbohydrate (%)*** 19.71b± 1.03 20.53b± 0.49 17.61a± 0.29 22.37c± 0.38 20.82b± 1.08
*
All values are averages of the triplicate analysis.
**Values in the same row followed by different letters are statistically different at the 95% confidence level.
3.2.3 Refractive index
The recorded refractive indices (RI) of peanut oil extracted from different varieties did not significantly vary. The values of RI obtained from the peanut oil samples are similar to those of a wide range of vegetable oils (Aryaet al., 1969). The higher measurements of the characteristics reported for the crude oils revealed the necessity to purify the oils. In addition, the high values of oil RI also showed that the oil samples contain long chain fatty acids with a large number of carbon atoms (Bello and Olawore, 2012; Agomuoet al., 2017).
3.2.4 Acidity (free fatty acid percent)
Free fatty acid percent (FFA%) can catalyze oxidative decay of oils by enzymatic and or chemical hydrolysis to form off volatile components. FFA% is an indication of lipase efficacy (Gulluoglu et al., 2016). The FFA% has been calculated according to the molecular weight of the predomi-nant acid. Free fatty acid pointed to the possible hydrolytic retrogression of the oil, and the FFA% was employed to verify
the quality and edibility of the oils. According to data illustrated by Aniołowskaet al.(2016), the Polish Directive from the Minister of Health from 25 September 2012, the acceptable level of free fatty acids in a frying medium cannot be higher than 2.5 mg KOH g1 of fat. The free fatty acid percent of the peanut oil samples was within acceptable levels of vegetable edible oils and ranged from 0.33 to 0.42% (Tab. 3). The data revealed that there was little significant variation between the peanut samples.
3.2.5 Peroxide value (PV)
Peroxide value is an indicator of peroxidation, and, therefore, the high peroxide value of the oil is a hint to a weak oil resistance to peroxidation during storage and a signal to a deterioration level (Mohammed and Hamza, 2008;Adebayo
et al., 2012). The peroxide number of different varieties of peanut oil has significantly the highest value of 13.05 mEq. O2kg1 for Line 27r variety, while the lowest value of 5.58 mEq.O2kg1was found for Line 18 variety (Tab. 3). The Table 3. Physicochemical properties of oil extracted from different peanut verities.
Properties Peanut oil samples*
NC (control) Line 27r Line 9 Line 4 Line 18
Oil yield (%) 51.16b**± 0.83 50.52a0.70 52.12c± 0.28 50.45a± 0.50 51.15b0.98 Specific gravity 0.881a± 0.03 0.901c± 0.01 0.885a± 0.02 0.892b± 0.02 0.884a± 0.01 Refractive index 1.4624a± 0.001 1.4631c± 0.001 1.4628b± 0.001 1.4629bc± 0.001 1.4627b± 0.001 Acidity (%) 0.35a± 0.02 0.40b± 0.06 0.42b± 0.04 0.39b± 0.01 0.33a± 0.03 Peroxide value (mEq.O2kg1) 8.86b± 0.67 13.05c± 1.64 8.06b0.80 7.26b± 1.50 5.58a± 0.81
Iodine value (g 100g1) 90.90c± 3.31 86.71a2.21 89.03bc± 2.11 88.33b± 3.20 89.70c± 2.33 Saponification value (mg g1) 189.41a± 4.10 194.75c± 2.33 191.92b± 1.80 191.24b± 3.71 191.32b± 2.61
Unsaponifiable matter (%) 1.52c± 0.08 1.26b± 0.05 1.13ab± 0.10 1.07a± 0.11 0.98a± 0.31
*
All values are averages of the triplicate analysis.
**Values in the same row followed by different letters are statistically different at the 95% confidence level.
Table 4. Fatty acid composition of oil extracted from different peanut verities.
Fatty acids Area (%)*
NC (control) Line 27r Line 9 Line 4 Line 18
Palmitic acid (C16:0) 15.00 c**
± 0.25 12.01a± 0.17 14.96c± 0.45 14.36bc± 0.34 14.78c± 0.88 Oleic acid (C18:1) 55.47a± 1.34 62.93c± 2.55 56.02a± 1.09 59.98b± 1.74 57.41ab± 0.47
Linoleic acid (C18:2) 24.01c± 0.33 19.56a± 1.01 23.33c± 0.57 21.65b± 0.49 22.53b± 0.11
Linolenic acid (C18:3) 1.31b± 0.02 1.34b± 0.11 1.33b± 0.07 1.30b± 0.06 1.25a± 0.03
Arachidic acid (C20:0) 0.80 a
± 0.02 0.97b± 0.05 0.86a± 0.01 Nd*** 0.85a± 0.01 Arachidonic acid (C20:1) 1.98bc± 0.24 1.93b± 0.35 2.25c± 0.13 1.77a± 0.11 1.88ab± 0.21
Behenic acid (C22:0) 1.43 c
± 0.05 1.26b± 0.11 1.25b± 0.12 0.94a± 0.11 1.30bc± 0.17
P
of Saturated fatty acids (%) 17.23c± 1.02 14.24a± 0.98 17.07c± 1.11 15.30b± 0.05 16.93bc± 0.31
P
of Unsaturated fatty acids (%) 82.77a± 1.05 85.76c± 0.84 82.93a± 0.78 84.70b± 0.55 83.07a± 0.13
O/L****ratio (%) 2.31 3.22 2.40 2.77 2.55
*
All values are averages of the triplicate analysis.
**
Values in the same row followed by different letters are statistically different at the 95% confidence level.
***
Nd = Not detected.
****
peroxide value of all varieties was in acceptable values reported by theCodex Alimentarius Commission (1999). The acceptable levels are up to 10 mEq.O2kg1of oil for refined oils and up to 15 mEq.O2kg1of oil for cold pressed and virgin oils. However, the Line 27r variety was higher than the acceptable level. This may be due to the high proportion of unsaturated fatty acids (85.76%) of this variety compared to other varieties. From the results, it was noticeable that Line 4 and Line 18 have lower PV than the control NC.
3.2.6 Iodine value (IV)
The data inTable 3showed that the iodine value of peanut varieties ranged from 86.71 to 90.90 g 100 g1 oil in all varieties. The highest iodine value was found in NC (control) variety and the lowest in Line 27r. The iodine number was used to define the degree of unsaturation and stability of peanut oil samples. High-oleic peanut has a longer shelf life than low-oleic peanuts and has the same goodflavor and stability of low-oleic peanuts.Escobedoet al.(2015)mentioned that the O/L ratio and iodine value in peanut varieties grown in Mexico varied between 1.8 to 2.1% and 88.6 to 105.4 g 100 g1, respectively.
3.2.7 Saponification value (SV)
Saponification values of peanut oil (Tab. 3) were found the highest (194.75 mg g1) for the Line 27r variety and lowest (189.41 mg g1) for NC (control) variety. The saponification number was in the acceptable range of most vegetable edible oils. The saponification number of 200 mg g1
indicates a high percentage of fatty acids of low molecular weight and carbon chain length. This indicates that the oil may not have a potential for use in soap making and in cosmetics production. This property makes them useful as sources of essential fatty acids required in the human body (Akanniet al., 2005;Elabd
et al., 2017).
3.2.8 Unsaponifiable matter (USM)
The bioactive compounds from USM such as polyphenols, phytosterols, tocopherols, and vitamins (soluble in fat) have a potential effect as antioxidants and antimicrobials (Mohamed
et al., 2018).Estiasihet al.(2014)reported that USM of palm fatty acid distillate decreased total cholesterol, LDL choles-terol, and triglyceride and increased HDL cholesterol level in hypercholesterolemic rats. The unsaponifiable matter content of peanut oil samples ranged from 0.98 to 1.52%. The highest value of unsaponifiable matter was found in NC (control) variety (1.52%) followed by Line 27r, Line 9, Line 4, and Line 18 (1.26, 1.13, 1.07, and 0.98%, respectively). The unsapo-nifiable matter percent significantly varied in all the varieties.
3.3 Fatty acid composition
3.3.1 Saturated fatty acid (SFA)
The variances among the peanut varieties were statistically significant (at levelp0.05) for saturated fatty acids, such as palmitic (C16:0), arachidic (C20:0), and behenic (C22:0) acids in all varieties. The ranges of fatty acids differ from 12.01 to
15.00% of palmitic acid (C16:0), 0.80 to 0.97% of arachidic acid (C20:0), and 0.94 to 1.30% of behenic acid (C22:0) in all varieties (Tab. 4). Statistically significant variances among peanut varieties were observed for saturated fatty acids in all peanut varieties under study. The saturated fatty acid percent in peanut oil was strongly affected for determined by the genotype (Isleib et al., 2008; Castro and Leite, 2018). The similar results were supported by the data reported byHassan and Ahmed (2012),Önemli (2012),Mzimbiriet al.(2014)and Escobedoet al.(2015).Hassanet al.(2005)mentioned that the significant difference for saturated fatty acids between peanut cultivars was a characteristic due to the diversity of the genotypes.
3.3.2 Unsaturated fatty acids (UFA)
PUFA to SFA mean ratio recommended by the British Department of Health is more than 0.45, and WHO/FAO experts have reported guidelines for a balanced diet in which the proposed ratio of PUFA/SFA is above 0.4 (Woodet al., 2008). Statistically significant variances at levelp0.05 were found between peanut species for the major unsaturated fatty acids, such as oleic (C18:1) and linoleic acid (C18:2) percentages in all varieties. According to different species, the oleic (C18:1) and linoleic acids (C18:2) percentage ranged from 55.47 to 62.93% and from 19.56 to 24.01%, respectively (Tab. 4). In this investigation, a variation among the peanut species was for oleic acid (C18:1) and linoleic acid (C18:2) percent.Andersen and Gorbet (2002)illustrated that oleic acid (C18:1) percent in peanut genotypes ranged from 21 to 85% and from 2 to 43% in linoleic acid (C18:2).Escobedo et al.
(2015) reported that peanut oil is rich in oleic (C18:1) and linoleic acids (C18:2). The composition of peanut oil is affected by several sets of factors that consist of genetic factors, environmental conditions, and interactions between environmental and genetic factors (Andersen and Gorbet, 2002;Isleibet al., 2008;Chaiyadeeet al., 2013).
4 Conclusion
From the obtained data, it could be concluded that the different peanut cultivars maybe are suitable for Egypt’s environmental conditions, after conducting some agricultural studies. Among the five varieties, Line 9 had the highest amount of oil content (52.12%) in comparison with the other varieties. Between thefive studied cultivars, the oil extracted from Line 27r showed comparatively high O/L ratio (3.22%) and a low iodine value. Among the present peanut cultivars, it could be concluded that Line 27r be the preferable choice for researchers, food scientists, and biochemists, as well as, manufacturers interested in food and nutrition. In addition, the obtained data may be useful for nutritionists and nut consumers when it comes to choosing the best foods and food products.
References
Adebayo SE, Orhevba BA, Adeoye PA, Musa JJ, Fase OJ. 2012. Solvent extraction and characterization of oil from African star apple (Chrysophyllum albidum) seeds.Acad Res Int3(2): 178. Agomuo E, Amadi P, Ogunka-Nnoka C, Amadi B, Ifeanacho M,
Njoku U. 2017. Characterization of oils fromDuranta repensleaf and seed.OCL24(6): A601.
Akanni MS, Adekunle SA, Oluyemi EA. 2005. Physicochemical properties of some non-conventional oilseeds.J Food Tech3(2): 177–181.
Alimentarius C. 1999. Codex standard for named vegetable oils. Codex Stan210: 1–13.
Andersen PC, Gorbet DW. 2002. Influence of year and planting date on fatty acid chemistry of high oleic acid and normal peanut genotypes.J Agric Food Chem50: 1298–1305.
Aniołowska M, Zahran H, Kita A. 2016. The effect of pan frying on thermooxidative stability of refined rapeseed oil and professional blend.J Food Sci Tech53(1): 712–720.
AOAC. 1995. Official methods of analysis. Washington: Association of Official Analytical Chemists.
Arioglu HH. 2014. The oil crops growing and breeding. The Publication of University of Cukurova, Faculty of Agriculture, Faculty number: 220, Book Number: A-70, Adana-Turkey, p. 204.
Arya SS, Ramanujam S, Vijayaraghavan PK. 1969. Refractive index as an objective method for evaluation of rancidity in edible oils and fats.J Am Oil Chem Soc46(1): 28–30.
Bello MO, Olawore NO. 2012. Potentials of two uncultivated plants in nutrition and industrial development.Adv Food Energy Secur 2:10–16.
Carrín ME, Carelli AA. 2010. Peanut oil: Compositional data.Euro J Lipid Sci Tech112(7): 697–707.
Castro C, Leite RMVBC. 2018. Main aspects of sunflower production in Brazil.OCL25(1): D104.
Chaiyadee S, Jogloy S, Songsri P,et al.2013. Soil moisture affects fatty acids and oil quality parameters in peanut.Int J Plant Prod7 (1): 81–96.
Dhamsaniya NK, Patel NC, Dabhi MN. 2012. Selection of groundnut variety for making a good quality peanut butter.J Food Sci Tech 49(1): 115–118.
Elabd EMY, Zahran HA, Abdalla AM. 2017. A comparative study of the effects of three Moringa species on obesity-induced oxidative stress state in liver tissue.Int J Pharma Bio Sci 8: 572–584.
El-Badrawy EEY, El-Zainy ARM, Shalaby AO, El-Sayed NY. 2007. Effect of microwave roasting on chemical composition of peanut seeds and comparing it with the ordinary roasting process. Proceedings of Annual Conference Credit and Accreditation. Vol. 11., pp. 939–956, Mansoura University, Egypt.
Escobedo RV, Luna PH, Torres ICJ, Mopreno AO, Ramirez MCR. 2015. Physicochemical properties and fatty acid profile of eight peanut varieties grown in Mexico. CyTA J Food 13: 300–304.
Eshun G, Amankwah EA, Barimah J. 2013. Nutrients content and lipid characterization of seed pastes of four selected peanut (Arachis hypogaeaL.) varieties from Ghana. Afr J Food Sci7 (10): 375–381.
Estiasih T, Ahmadi K, Widyaningsih TD,et al.2014. The effect of unsaponifiable fraction from palm fatty acid distillate on lipid profile of hypercholesterolaemia rats.J Food Nutr Res2: 1029–1036.
Gulluoglu L, Bakal H, Onat B, El Sabagh A, Arioglu H. 2016. Characterization of peanut (Arachis hypogaea L.) seed oil and fatty acids composition under different growing season under Mediterranean environment.J Exp Biol Agric Sci4(5S): 564–571. Hassan F, Ahmed M. 2012. Oil and fatty acid composition of peanut
cultivars grown in Pakistan.Pak J Bot44(2): 627–630. Hassan SW, Umar RA, Ebbo AA, Matazu IK. 2005. Phytochemical,
antibacterial and toxicity studies of Parkinsonia aculeate L. (Fabaceae).Niger J Biochem Mol Biol20(2): 89–97.
Isleib TG, Tilman BL, Patte HE, Sanders TH, Hendrix KW, Dean LO. 2008. Genotype-by-environment interaction for seed composition traits of breeding lines in the uniform peanut performance test. Peanut Sci35: 130–138.
Megat-Rusydi MR, Noraliza CW, Azrina A, Zulkhairi A. 2011. Nutritional changes in germinated legumes and rice varieties.Int Food Res J18(2): 705–713.
Mohamed FA, Salama HH, El-Sayed SM, El-Sayed, HS, Zahran HA. 2018. Utilization of natural antimicrobial and antioxidant of Moringa oleiferaleaves extract in manufacture of cream cheese.J Biol Sci18(2): 92–106.
Mohammed MI, Hamza ZU. 2008. Physicochemical properties of oil extracts fromSesamum IndicumL. seeds grown in Jigawa state Nigeria.J Appl Sci Environ Manag12(2): 99–101.
Mzimbiri R, Shi AM, Liu H, Wang Q. 2014. A Review: Peanut fatty acids determination using hyper spectroscopy imagine and its significance on food quality and safety.Food Sci Qual Man28: 90–97.
Nzikou JM, Matos L, Mbemba F, et al. 2009. Characteristics and composition ofJatropha curcasoils, variety Congo-Brazzaville. Res J Appl Sci, Eng Tech1(3): 154–159.
Önemli F. 2012. Impact of climate change on oil fatty acid composition of peanut (Arachis hypogeal L.) in three market classes.Chil J Agric Res72: 383–488.
Pasupuleti J, Nigam SN, Pandey MK, Nagesh P, Varshney RK. 2013. Groundnut improvement: Use of genetic and genomic tools.Front Plant Sci4: 23.
Sebei K, Gnouma A, Herchi W, Sakouhi F, Boukhchina S. 2013. Lipids, proteins, phenolic composition, antioxidant and antibac-terial activities of seeds of peanuts (Arachis hypogaea L.) cultivated in Tunisia.Biol Res46(3): 257–263.
Shad MA, Pervez H, Zafar ZI, Nawaz H, Khan H (2012) Physicochemical properties, fatty acid profile and antioxidant activity of peanut oil.Pak J Bot44(1): 435–440.
Shasidhar Y, Vishwakarma MK, Pandey MK,et al.2017. Molecular mapping of oil content and fatty acids using dense genetic maps in groundnut (Arachis hypogaeaL.).Front Plant Sci8: 794. Sibt-e-Abbas M, Butt MS, Sultan MT, Sharif MK, Ahmad AN,
Batool R. 2015. Nutritional and functional properties of protein isolates extracted from defatted peanutflour.Int Food Res J22 (4): 1533.
Steel RGD, Torrie JH, Dickey DA. 1997. Principles and procedures of statistics: A biometrical approach, 3rd Edition. New York, USA: McGraw Hill.
Variath MT, Janila P. 2017. Economic and academic importance of peanut. In: The peanut genome. Cham: Springer, pp. 7–26. Win MM, Abdul-Hamid A, Baharin BS, Anwar F, Sabu MC, Pak-Dek
MS. 2011. Phenolic compounds and antioxidant activity of peanut’s skin, hull, raw kernel and roasted kernelflour.Pak J Bot 43(3): 1635–1642.
Zaher F, Gad MS, Aly SM, Hamed SF, Abo-Elwafa GA, Zahran HA. 2017. Catalytic cracking of vegetable oils for producing biofuel. Egy J Chem60(2): 291–300.
Zahran HA, Soliman HM. 2018. UPLC-Q-TOF/MS screening of bio-active compounds extracted from olive mill solid wastes and their
effect on oxidative stability of purslane seed oil.Curr Sci Int7(2): 307–319.
Zhao X, Chen J, Du F. 2012. Potential use of peanut by-products in food processing: A Review. J Food Sci Tech 49(5): 521–529.