Investigating the relationship among complexity, range, and strength of
grammatical knowledge of EFL students
Hamed Zandi
(University of Tehran & Institute for Advanced Studies in Basic Sciences (IASBS), Iran) [email protected]
(Received: 2013/12/03, Accepted: 2014/03/12)
Abstract
Assessment of grammatical knowledge is a rather neglected area of research in the field with many open questions (Purpura, 2004). The present research incorporates recent proposals about the nature of grammatical development to create a framework consisting of dimensions of complexity, range and strength, and studies which dimension(s) can best predict the state of grammatical knowledge of EFL students. To this end, the specifications of a test of grammatical knowledge were drafted and reviewed by a group of trained reviewers. The specifications were revised and the test was administered to 158 English learners with mixed proficiency levels. The items were analyzed using classical test theory and Rasch model. The results of stepwise regression indicate that the model that best predicts grammatical knowledge of lower ability leaners includes range and strength, while for the higher level strength and complexity are the best predictors.
Keywords: dimensions of grammatical knowledge, grammatical complexity, grammatical range, grammatical strength
Introduction
An examination of the major models of language proposed since Oller’s (1979) unitary factor of language proficiency shows that the field of language teaching has moved towards a more componentially diverse view of language proficiency. Scholars such as Canale and Swain (1980), Canale (1983), Oller (1983), Bachman (1990), Celce-Murcia, Dörnyei, and Thurrell (1995) Bachman and Palmer (1996) and more recently Purpura (2004) have built on the each other’s previous works and tried to define and redefine these components. Perhaps the most comprehensive treatment of grammar in the testing context is the model proposed in Purpura (2004).
After describing his model, Purpura suggests that assessment of grammatical knowledge is still in need of more research with regard to how the construct can be defined and measured.
grammatical knowledge can be valuable for developing the specifications of grammar tests in general and diagnostic tests in particularly. It allows a more detailed feedback to teachers, test-takers, and other stake-holders about learners’ development of grammatical knowledge.
The construct of grammatical knowledge
As regards the models of language, there are two general perspectives to describe linguistic phenomena (Purpura, 2004): a) syntactocentric perspective, where syntax is the central feature to be observed and analyzed, such as traditional grammar, structural linguistics, and transformational-generative grammar b) communication perspective of language, where the observational and analytic emphasis is on meaningful language use, such as corpus linguistics, and systemic-functional linguistics. The basic difference between the two perspectives is that communication-based perspectives of language emphasize that language is more than form and linguistic forms do not have a fixed meaning in their use. Therefore, grammaticality becomes synonymous with appropriacy, naturalness, and acceptability.
Purpura’s (2004) conceptualization of grammatical knowledge seems roughly to conform to Hymes’s knowledge of the possible, which in turn can be linked to locutionary meaning in Autsin’s (1962) speech act theory. Compared to Hymes’ (2001) formulation, syntactocenteric perspectives focus on the knowledge of the possible form, while the communication perspectives focus on the semantic feasibility, pragmatic appropriacy, and attested naturalness of exploited forms during language use.
Proposing a framework to test grammatical knowledge, Purpura (2004) distinguishes between the grammatical knowledge, grammatical ability, and grammatical performance.
Grammatical knowledge refers to a set of informational structures related to grammatical form and meaning available for use in long-term memory (Purpura, 2004). According to this model of grammatical knowledge, knowledge of words and structures involve two dimensions: form and meaning. In this respect, the two terms grammatical knowledge and lexico-grammatical knowledge are interchangeable. This view resonates well with that of Bardovi-Harlig (1995, 2001) who notes that in the process of SLA learners make connections among forms with meanings and use and they need to be able to “distinguish among semantically neighboring forms” (Bardovi-Harlig, 2001, p. 218).
Therefore, in grammar assessment “the primary assessment goal is to determine whether learners are able to use forms to get their basic point across accurately and meaningfully” (Purpura, 2004, p. 274). It should be noted that as far as grammatical knowledge is concerned, Purpura (2004) defines grammatical meaning as instances of language in which what is said is what is meant and intended. For example, sometimes, people are able to produce accurate grammatical forms but these forms do not reflect the meaning they really intend to communicate (e.g., I am interesting instead of I am interested).
meaning alone.
However, there exits some concerns vis-à-vis measuring the construct of grammatical knowledge. As an instance, whether grammar should be tested implicitly or explicitly needs to be addressed. According to Alderson (2005) implicit testing of grammar is justified because grammar is at the heart of the language and is implicated in all of the skills. Thus, if one does not know the syntactic forms they will not be able to read, write, listen, and speak. By testing the skills one can implicitly test grammar.
Explicit testing of grammar is so deeply rooted in language testing that despite the arguments for more implicit testing of grammar they are still popular. Explicit testing of grammar brings with itself a promising corollary: such tests can be easily bent for diagnostic purposes. Also, if two test-takers know a grammatical structure, their knowledge may not be identical. Knowledge of grammar is not an
all or nothing phenomenon but can vary
along a number of dimensions. Identification and measurement of those dimensions has the potential to help with portraying a more complete picture of learner’s profile of strengths and weaknesses.
A framework for investigating complexity, range, and strength of grammatical knowledge
Complexity is perhaps the most systematically studied dimension in the literature whereas range has always been traditionally used to prepare grammar tests. These dimensions can facilitate studying different aspect of the knowledge in language learners. However, dimensions of grammatical knowledge are not limited to these two.
Measuring complexity
It is generally understood that a simple clause has only a subject, verb, and object
or complement. Also, by definition a simple phrase (e.g., a noun phrase) has a determiner and a head noun, or a prepositional phrase has minimally a preposition as its head followed by a noun, a pronoun, or a gerund. To make complex grammar, these simple patterns should be modified or something should be added together.
However, it seems that the mainstream view of complexity in not constant and is evolving. Biber and Gray (2010) argue that the notion of complexity has changed in the past couple of centuries: carrying out a historical corpus analysis, they concluded that whereas the 19th century prose made frequent use of casuals embedding, contemporary academic writing uses more phrasal modifiers embedded in noun phrases as tools to elaborate grammatically simple patterns. Furthermore, the spoken and written language seem to be complex in different ways. Biber, Gary, and Poonpon (2011) show that clausal subordinations are more common in conversation than academic writing. In academic writing complex noun phrase constituents rather than clause constituents and complex phrases rather than clauses are more common.
According to Rimmer (2006), the complexity component is multifaceted and includes syntactic, psycholinguistic, markedness, and at times can be related to the frequency component. However, as he suggests, the notion of complexity, which is usually based on tradition and intuition, may not be very reliable. A related notion to complexity is grammatical difficulty. For DeKeyser (2005) it appears that some factors account for the difficulty: complexity of form, complexity of meaning, and complexity of the form-meaning relationship, frequency, and also complexity of processing.
measuring syntactic complexity. After reviewing several measures of syntactic complexity, they argue certain measures are more revealing for specific proficiency groups; for beginning levels coordination index, for intermediate levels mean number of clauses per t-unit, and for advanced levels mean number of words per clause are recommended.
The results of the study by Biber, Gary, and Poonpon (2011) suggest that after learning the simple patterns in grammar, L1 learners go through progressive stages of grammatical complexity:
from finite dependent clauses functioning as constituents in
other clauses, through
intermediate stages of nonfinite dependent clauses and phrases functioning as constituents in other clauses, and finally to the last stage requiring dense use of phrasal (nonclausal) dependent
structures that function as
constituents in noun phrases. (p. 29-30)
As it appears, complexity is not a single unified construct, therefore, a single measure may not adequately represent it (see also Ortega 2003; Rimmer, 2006, 2008; Ellis and Yuan, 2005; Robbinson, 2007; Ravid and Berman, 2010). Yet, obviously it would not be feasible to address grammatical complexity at length in one study. This study focuses on one area of complexity. Wolfe-Quintero, Inagaki, and Kim (1998) provide an extensive survey of research on L2 writing development and conclude that clauses per t-unit (C/T) and dependent clauses per independent clause (DC/C) are the best complexity measures of the late 90s. Biber, Gary, and Poonpon (2011) maintain that many linguists from different theoretical backgrounds consider dependent clauses as one of the most important types of grammatical
complexity. Thus, this study has limited itself to studying relative clauses and conditional clauses as hallmarks of syntactic complexity. Complexity is operationalized by tallying the scores on the complex items on the test regardless of their format or spec.
Measuring range (variety)
For practicality purposes the study focuses on range (a component of variety), keeping frequency of structures aside from the equation since enough corpus data is not available at present. Range can be operationalized by using a list of grammatical categories similar to the one used for DIALANG project (Alderson, 2005) as it is both comprehensive and practical for test design purposes. Range, then, is defined as the number and type of categories for which test-takers show a degree of knowledge of grammar as measured by a correct answer to an item on the test. For example, one of the items on the list is concerned with verb inflection. According to Bardovi-Halig there are a few reasons the subsystem of tense and aspect is of interest for SAL studies: study of time and aspect is central to most ESL and EFL curricula, many language programs require mastery of certain tense and aspects for advancement from one level to another, and tense and aspect play a central role in grammatically focused teaching materials. Also, many important English tests in Iran such as those administered by the National Organization or Educational Measurement such as TOLIMO, and Ph.D. entrance exams such as UTEPT have items testing tense and aspect.
Measuring strength
Although there is some research on the construct of strength of vocabulary knowledge (Laufer & Goldestein, 2004; Laufer, Elder, Hill, & Congdon, 2004), it seems that such a construct has not been explicitly proposed for grammatical knowledge. Measuring the strength dimension can complement description of the profile of the grammatical knowledge of language learners. As an instance, two learners’ (Learner A and B) range of grammatical knowledge can include a number of tense and aspects, they could have also learned how to make relative clauses. However, this description does not provide information about these learners’ degree of the control over those structures. Learner A might be able to recognize the correct choice in a multiple-choice (MC) question, but fail to find the mistake on an editing item. On the other hand, Learner B may be able to perform well on both item formats. Therefore, it could be concluded that learner B’s knowledge of that structure may be stronger. For the purposes of the current research, strength of grammatical knowledge is defined as the extent to which a test-taker can answer correctly a variety of items requiring different types of cognitive processing, all measuring the knowledge of the same grammatical structure. Strength in this study is operationalized as a correct answer to all the three item formats of MC, editing, and translation, measuring the same structure but in different formats.
The present study
Although many testing researchers have attempted to measure various aspects of language ability, measurement of grammatical knowledge has largely been under-theorized (Purpura, 2004). Purpura (2004) reminds that there is a glaring paucity of information on assessing grammar and research on the validity of inferences made upon them; more specifically he deplores lack of consensus
on:
(1) what constitutes
grammatical knowledge, (2) what type of assessment tasks might best allow teachers and testers to infer that grammatical knowledge has been acquired and (3) how to design tasks that elicit grammatical knowledge from students for some specific assessment purpose, while at the same time providing reliable
and valid measures of
performance. (p. 4)
While lack of research may be due to a change of trend towards more integrative, performance based assessment, lack of adequate research about different dimensions of grammatical knowledge, especially in diagnostic and placement language tests, could lead to underrepresentation of the construct and threaten the validity of the inferences made based on those tests. As a result, grammatical assessment studies that have imitated the specifications of grammar section of pre-2005 TOEFL with only MC type item formats may have risked construct underrepresentation, in case they have made claims relating to a test-taker's profile of weaknesses and strengths with regard to knowledge of grammar.
at different levels of proficiency is different.
A more comprehensive, theoretical model of grammatical knowledge, such as the one used in this study, which includes components of range, complexity, and strength of grammatical knowledge, has not been represented in the underlying constructs of tests measuring grammatical knowledge. This study attempts to explore the relationship among different dimensions of grammatical knowledge and whether and how grammatical knowledge develops along those dimensions, hence the research questions:
1) Does the test of complexity, range, and strength of grammatical knowledge produce reliable scores?
2) Which of the predictors of complexity, range, and strength of grammatical knowledge can best predict the knowledge of EFL students with lower overall grammatical knowledge?
3) Which of the predictors of complexity, range, and strength of grammatical knowledge can best predict the knowledge of EFL students with higher overall grammatical knowledge?
Method
Participants
The participants of the main study were 250 male and female non-English major EFL students studying English at various English institutes and/or universities in Iran. Judging by the class levels and the estimation of their teachers, their proficiency level ranged between elementary to upper intermediate. After a preliminary screening and scoring of the test papers, some participants were excluded from the final analysis for partial completion of the test. Thus, data from 92 participants was discarded and data of 158 participants remained for the main
analysis.
Instruments
Test of grammatical knowledge
The test included a number of grammatical categories from a list similar to DIALANG project (Alderson, 2005). The specifications for the test were prepared following the model suggested in Davidson and Lynch (2002). They included detailed information about how three types of items (Multiple choice, editing, and translation) should be written. Further, they provided several sample items and indicated how the test was supposed to be assembled and administered. Three item types were included on the test on the grounds that although multiple-choice questions are commonly employed for testing language knowledge, in the recently proposed systematic approach to item writing (Shin, 2012) and elsewhere in the literature (e.g., Brown & Hudson, 1998) using various item formats are more desirable. The reason, as Buck (2001) argues, is that “ all items have their particular strengths and weaknesses and tend to engage different skills. By using a variety of different task types, the test is far more likely to provide a balanced assessment” (153).
The following are examples of items on the test:
Translation from L1 to L2
.تسا دیفس میدیرخ ام هک ینییشام
/The car that we bought is white./
Editing the sentence by changing a word or phrase.
The letter it Jack received was from the company.
MC
a. whom b. who c. which d. whose
In order to review the test specifications and evaluate the quality of the items, two Ph.D. holders with expertise in language testing and five native and non-native speakers of English who were also TESOL students and had the experience of teaching grammar were recruited. The feedback and comments from the reviewers were voice recorded, transcribed, analyzed. Afterwards, the specifications and the test items were revised and the grammar test was prepared. The test, which comprised of 89 items, was piloted twice on two groups of participants (N = 40, N = 33), who were similar to the ones in the main study.
To analyze the item statistics, classical test theory (CTT) was employed. Based on the results, the faulty items were revised and piloted once again. Consequently, the main test was prepared and administered to 158 participants. Rasch Model was used to analyze and calibrate the items on the main test.
Data Collection and scoring
The data was collected over five months in several administrations of the test. To ensure consistency between different test administrations, a set of guidelines were developed and the proctors were instructed to follow uniform procedures. Each administration of the test took about one hour and a half and the participants who finished the test before the end of the exam time were allowed to leave the session.
In the present study, range of grammatical knowledge is calculated when a test-taker provides a correct response to at least one of the three items having the same spec but different item formats. Thus, tallying the number of grammatical categories a test-taker knows yields the range score. Strength of grammatical knowledge is calculated by tallying the number of grammatical structures when the test-taker
provides correct answers to all the three items, having the same spec but different formats. In other words, a test-taker who has answered all the three formats pertaining to a particular spec correctly is deemed to have a strong command of that grammatical structure. Complexity of grammatical knowledge is calculated by tallying the number of correct answers on the complex items on the test, regardless of their format or spec.
Results and discussion
Reliability of the test. As CTT statistics were used to analyze two pilot studies, it was expected that the items on the test already met the standards of CTT. The mean test score was 55.16 and the standard deviation was 16.32. Further, the measure enjoys a high reliability index (Cronbach's Alpha = 0.95). In order to enrich the validity argument, CTT and Rasch Model statistical procedures were employed for ascertaining quality of items that were included in the test. Data was analyzed both by Winsteps version 3.70.0, a Rasch model based software, developed by Linacre (2010). As regards the sample size, DeMars (2010) suggests that studies with sample sizes as small as 100 or 200 can use Rasch Model. According to Linacre (1994) a sample size of 150 would yield item calibrations that are stable within logits in 99% confidence interval in Rasch model.
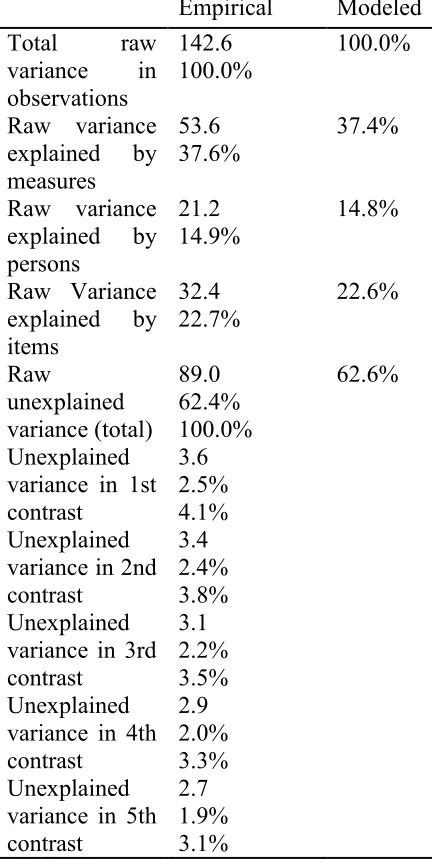
As regards the assumption of unidimensionality, as Table 1 indicates, Rasch dimension explains 37.6% of the variance in the data from the performance of the participants on the test and the largest secondary dimension explains only 4.1% of the variance. As the variance explained by the second dimension is negligible in comparison to the variance explained by the first dimension, the measure could be considered unidimensional.
statistics at the approximate range of .75 to 1.3 are acceptable, according to Lincare (2010) they should ideally be in the range of .7 to 1.3. However, Linacre (2002) suggests that items with fit statistics as low as .5 or as high as 1.5 are still reasonably productive for practical measurement purposes. Analysis for fit statistics indicated that the majority of the items were within the range of .75 to 1.3. No item had a misfit (i.e., an infit index above 1.3).
Table 1: Table of Standardized Residual Variance (in Eigenvalue Units) for Testing the Unidimensionality Assumption of the Data of the Main Test
Empirical Modeled Total raw
variance in observations
142.6 100.0%
100.0%
Raw variance explained by measures
53.6 37.6%
37.4%
Raw variance explained by persons
21.2 14.9%
14.8%
Raw Variance explained by items
32.4 22.7%
22.6%
Raw
unexplained
variance (total)
89.0 62.4% 100.0%
62.6%
Unexplained variance in 1st contrast
3.6 2.5% 4.1% Unexplained
variance in 2nd contrast
3.4 2.4% 3.8% Unexplained
variance in 3rd contrast
3.1 2.2% 3.5% Unexplained
variance in 4th contrast
2.9 2.0% 3.3% Unexplained
variance in 5th contrast
2.7 1.9% 3.1%
According to McNammara (1996), items with an infit above of 1.3 are either poorly written items or do not measure the same construct as the rest of items. Therefore, all the items on the test can be considered to be well written and all seem to test the same construct. There were two items, with infit indexes of .68, and two with infit of .70 and .74. These items’ infit is only slightly below .75, that means the information provided by these items could be gained by data from other items; in other words, overfiting items are redundant (McNamara, 1996). Therefore, the more redundant the items the greater their distance from .75. However, the few overfiting items on the test seem to be only marginally below McNammara’s (1996) criterion and almost at the range proposed by Linacer (2010) and certainly reasonably productive for measurement purposes as suggested by Linacre (2002).
As regards outfit statistics, there were seven marginally overfiting items and one underfitting item. Outfit statistics show the sensitivity of the items to the ability of the test-taker, that is, the greater the difference between the ability level and the difficulty of the item the greater the deviation of outfit from one. However, according to Linacre (2002), misfitting items with regard to their outfit statistics are less of a threat to measurement: “This is more sensitive to responses to items with difficulty far from a person, and vice-versa. For example, outfit reports overfit for imputed responses, underfit for lucky guesses and careless mistakes” (Linacre, 2002 p.878). Since all of these items showed particularly good infit statistics and the outfits were well within 0.5 to 1.5 range of Linacre (2002) they were considered productive for measurement purposes.
Further scrutiny showed that the correlation between two pairs on the list was moderate (r = .44) and the rest of correlations were weak (i.e., less than r = 0.35). Therefore, it was safe to assume that the whole test, to a very large extent, met the criteria of local independence of items.
Data analysis showed that the items covered a wide range of difficulty from -4.3 to +3.7 logits. However, test information curve indicated that the test was more reliably informative for the ability levels approximately between -2 to +2 logits, that is, the ability estimates for test-takers at the extreme levels of ability had a larger margin of error due to the fact that there were not as many very difficult or very easy items on the test. Since the majority of the test-takers self-identified themselves as being lower intermediate, the test reported mostly weakness for a beginner EFL test-taker and mostly strength for an upper-intermediate, while it reported a balanced profile of weaknesses and strengths for lower-intermediate students. This is entirely congruent with the expectations based on which the test was designed.
The discussion above addresses a validity concern reflected in first question of this research about the reliability of the scores. It appears that the measure can be considered reasonably reliable and the majority of items on the test meet the statistical criteria specified in the literature on CTT and Rasch model.
Investigating the consistency of
relationship
To examine the relationship among complexity, range, and strength and how the relationship among these dimensions changes as learner’s grammatical knowledge develops, two sets of analyses were conducted after dividing the participants into a higher (HG) and a
lower group (LG). The total scores for the
participants on each subset of translation,
editing, and MC was calculated in standardized z scores and aggregated to create a composite total score for the test. The students with at least half a standard deviation above the mean were labeled as
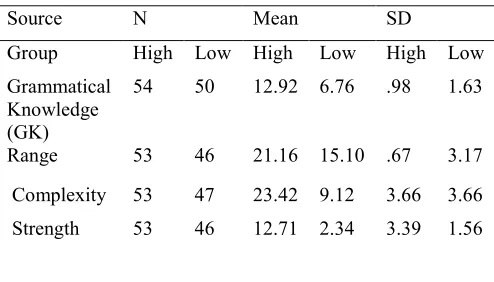
High and those with more than half a standard deviation below the mean were considered Low. Table 2 shows the descriptive statistics for the dimensions of Grammatical Knowledge (GK) for the Higher and the Lower group of EFL learners. In order to discover the extent to which the three predictors of complexity, range, and strength were related to the criterion (i.e., GK) and to each other, a correlation analysis was followed by a regression analysis. Theoretically, all of the predictors were expected to be correlated with the criterion, because regression analysis is based on the correlations among variables. Therefore, first, the relationship among all the predictors of GK and the actual GK of the participants was studied separately for the lower and higher group using Pearson product-moment correlation.
Table 2: Means and standard deviations on Diagnostic Grammatical Knowledge Test and the dimensions of GK for the Higher and the Lower group of EFL learners
Source N Mean SD
Group High Low High Low High Low Grammatical
Knowledge (GK)
54 50 12.92 6.76 .98 1.63
Range 53 46 21.16 15.10 .67 3.17
Complexity 53 47 23.42 9.12 3.66 3.66 Strength 53 46 12.71 2.34 3.39 1.56
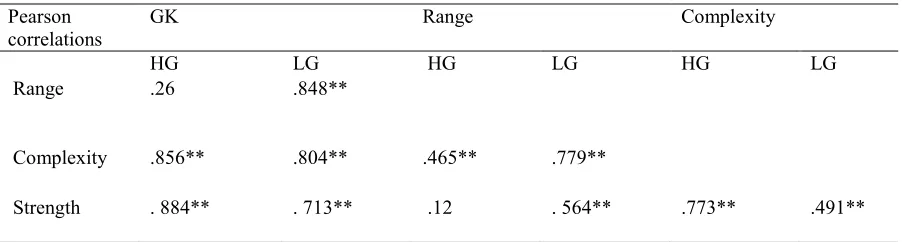
0.05 for the LG.For the HG all the correlations were significant except for two: between GK and range (r = .26, p > 0.05) and between range and strength (r = 0.12, p > 0.05). The correlation values between the other variables revealed significant and rather strong relationships across the higher and lower groups. These results suggest that for lower proficiency learners all three dimensions of knowledge
show moderate to strong relationship amongst themselves and with GK. However, at higher levels, the importance of range seems to have decreased and other dimensions could possibly better describe grammatical knowledge of more advanced students.
Table 3: Correlation matrix of the scores on the dimensions of GK for the groups of EFL Learners: Higher Group (n = 53), and Lower Group (n = 46)
Pearson correlations
GK Range Complexity
HG LG HG LG HG LG
Range .26 .848**
Complexity .856** .804** .465** .779**
Strength . 884** . 713** .12 . 564** .773** .491**
In order to provide more evidence for this argument, a stepwise multiple regression model was developed to identify the most economical model to describe the state of grammatical knowledge at two high and low proficiency levels.
In other words, the results of the correlation analysis (Table 3) indicated that most of variables were highly correlated. This was the motivation to consider the possibility of identifying a smaller set of variables that would be as efficient as the total set of factors. To find the extent to which complexity, range, and strength dimensions of grammatical knowledge can explain the greatest amount of variance in EFL students’ knowledge of grammar, stepwise multiple linear regression analysis, as one of the strongest statistical analyses used for predictive purposes (Brace, Kemp & Sneglar, 2000), was conducted separately for each group to investigate whether the model of GK in two groups is different.
This model was employed to examine the
relationship among the criterion (i.e., participants’ actual GK measured by their responses to the instrument) and the three predictors and to identify a smaller set of predictors of grammatical knowledge that can predict the same amount of variation among language users of lower and higher proficiency.
The result of the analysis for the lower group
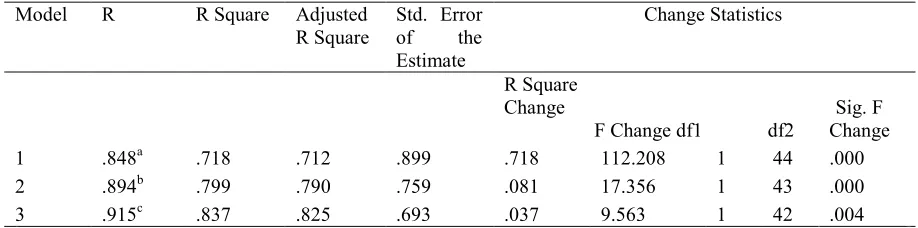
Results of stepwise regression for the LG are presented in Table 4. Examination of the results indicated that out of seven theoretically possible models, three models were more plausible. Notably, among three models, the first one included only dimension of range.
(R2 change = 0.081). Adding a third predictor (i.e., complexity, in the third model, improved it by 3.7 % [R2 change = 0.037]). These findings seems to endorse the argument that for lower level learners the role of range of grammatical knowledge is more prominent, in comparison to the HG (discussed below), as their interlanguage has not become
complex and they still may have partial control on their knowledge and cannot correctly employ it in different contextual and cognitive settings (i.e., they cannot demonstrate the similar amount of control in attempting different item formats measuring the same structure).
Table 4: Stepwise regression model summary of the predictors of GK for the LG
Model R R Square Adjusted
R Square Std. Error of the Estimate
Change Statistics
R Square
Change Sig. F F Change df1 df2 Change
1 .848a .718 .712 .899 .718 112.208 1 44 .000
2 .894b .799 .790 .759 .081 17.356 1 43 .000
3 .915c .837 .825 .693 .037 9.563 1 42 .004
a. Predictors: (Constant), Range; b. Predictors: (Constant), Range; strength; c. Predictors: (Constant), Range; Strength; Complexity; d. Dependent Variable GK
Although range alone explained 72% of variation in predicting grammatical knowledge and the contribution of the other variables was rather small, these Models were significant at P = 0.000 level (Table 5). By calculating the coefficients of stepwise regression, it was found that the assumption of lack of collinearity among predictors is met. When some of the independent variables are entirely predicted by the other variables, collinearity exists. For this reason, independent variables are examined for tolerance value, a statistic that indicates collinearity among predictors. This value ranges from 0 to 1; the closer the value is to 0, the stronger the relationship is between the predictor in question and the rest of the predictors. In fact, existence of the predictors whose tolerance value is below 0.001 is a cause for concern. If the tolerance value of a predictor is below 0.001, it should be removed from the analysis. Moreover, the threat of collinearity among the predictors was not alarming, that is, tolerance values were all above 0.001 which means that the relationships are not collinear, hence the
dependability of the regression.
The result of the analysis for the higher group
The stepwise regression preformed for the HG point to the inclusion of two plausible models out of seven conceivable ones. Unlike the findings for the lower group, range was excluded from either of the suggested models. Table 6 provides the information regarding the explanatory power of each of the two models: the first model had a large value of adjusted R2 = 0.77, meaning the predictor of strength alone could explain 77 % of variability in the criterion. When complexity was added to the second model, it improved the previous one by 7.9% (R2 = 0.079).
Table 5: ANOVA for the significance of the proposed models for the LG
Model Sum of
Squares Df Mean Square F Sig.
1 Regression 88.698 1 88.698 112.208 .000a
Residual 34.781 44 .790
Total 123.479 45
2 Regression 98.699 2 49.350 85.637 .000b
Residual 24.779 43 .576
Total 123.479 45
3 Regression 103.295 3 34.432 71.647 .000c
Residual 20.184 42 .481
Total 123.479 45
a. Predictors: (Constant), Range
b. Predictors: (Constant) Range; Strength
c. Predictors: (Constant) Range; Strength; Complexity
Table 6: Stepwise Regression Model Summary for the HG
Model R R
Square Adjusted R Square Std. Error of the Estimate
Change Statistics
R Square
Change F Change
df1 df2 Sig. F Change
1 .884a .782 .777 .46307 .782 182.570 1 51 .000
2 .928b .861 .855 .37347 .079 28.409 1 50 .000
a. Predictors: (Constant), Strength
b. Predictors: (Constant), Strength, Complexity c. Dependent Variable: GK
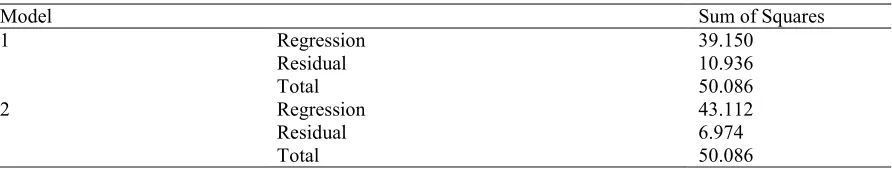
Table 7: ANOVA results for the significance of the proposed models for the HG
Model Sum of Squares Df Mean Square F Sig.
1 Regression 39.150 1 39.150 182.570 .000a
Residual 10.936 51 .214
Total 50.086 52
2 Regression 43.112 2 21.556 154.548 .000b
Residual 6.974 50 .139
Total 50.086 52
a. Predictors: (Constant), Strength
b. Predictors: (Constant), Strength Complexity
One-predictor models
By comparing the results of stepwise regression for the higher and the lower group, we can decide on the set of predictors that are more informative for assessment purposes. This comparison reveals that the one-predictor models may not be the most informative ones for assessing grammatical knowledge of high and low ability EFL learners. Nevertheless, data suggests that the best predictor of grammatical knowledge of for LG is range and for the HG is Strength.
Two-predictor models
A closer look at the two-predictor models shows that while for the LG range and strength have been included in the model, for the HG strength and complexity have been selected. It can be inferred that strength can be the common dimension for both of the two-predictor models. Further, a two-predictor model can best explain the variability in HG learner’s knowledge; this model explains 7.9% more of variance in GK of high participants respectively. According to this finding, after strength, the dimension of complexity seems to be the second important predictor of grammatical knowledge for the HG. This might be due to the fact that complex structures are usually the ones that are more difficult; hence they are acquired in later stages. In other words, the reason for the identification of variables for high and low might be related to proficiency level of the participants; it can be argued that proficiency and exposure to language may play a determining role in the development of a strong and complex grammar.
Three-predictor models
The only three-predictor model was proposed for the LG and included range, strength, and complexity. The addition of complexity to the two-parameter model improved it by 3.7% and provided the model with the most explanatory power among the three. This raises some questions about the role of complexity in
the grammatical knowledge of the EFL learners with lower proficiency: whether it is economical to develop a set of items measuring complexity for lower level learners? However, such a decision is related to the purpose of the test. For a diagnostic test of grammar, inclusion of all the three dimensions seems necessary as it allows comparison between stages of development in learner’s knowledge.
For the LG the role of the range dimension seems to be more prominent; they also show degrees of ability with regard to other dimensions, which helps with portraying a more comprehensive picture of their weaknesses and strengths. Likewise, for learners of higher ability, dimension of range may not be the most informative. Nevertheless, it depicts that the learner has made a great deal of progress along that dimension; this piece of information can be quite motivating if provided to the learners in an assessment for learning context.
Conclusions
This paper analyzed a test of grammatical knowledge, the specifications of which included three item formats, to measure three the dimensions of grammatical knowledge. It found that all the three dimensions tended to correlate with each other and could be used to describe the state of EFL learners’ grammatical knowledge. However, for lower levels the role of the range dimension seemed more conspicuous and for learners with higher proficiency the role of strength was more evident.
formats, it may be justified to use different item formats for measuring the same structure because it can increase chances of detection of existence of knowledge by at least answering one of three items correctly.
It can also guarantee that a learner has a stronger knowledge of a certain structure and that their answers are not based on chance. The findings imply that a multidimensional model of grammar can help with inferences about test-takers' grammatical knowledge for a variety of assessment purposes. Specification of grammar tests can consider the potential of incorporating a wider variety of item formats to enable a more comprehensive assessment of the grammatical knowledge of EFL students.
The results of such an assessment can be used to provide more detailed feedback to students, which is a requirement in the context of assessment for learning (Assessment Reform group 2002, Black, Harrison, Lee, Marshall, & Wiliam 2004; Wiliam, 2011) and advocated by numerous language testers (e.g., Spolsky 1990; Shohamy 1992; Huhta 2008; Jang 2009).
Further research is suggested to employ the framework for grammatical knowledge proposed in this study as it can offer a means of measuring the increase in complexity, range, and strength of second language grammar as learners’ language proficiency develops. Arguably, it has the potential to help researchers to systematically study development of grammar along different dimensions in various sociolinguistic contexts such as EFL or ESL. Moreover, learning gains can be measured where the focus of instruction is not grammar— for example, grammar of the learners can be measured after a reading course to find any improvements in the complexity, range, and strength of grammatical knowledge.
References
Alderson, J. C. (2005). Diagnosing foreign language proficiency: the interface between learning and assessment.
London: Continuum.
Assessment Reform Group (2002).
Assessment for learning: 10
principles. Retrieved November
2012 from
http://assessmentreformgroup.files wordpress.com/2012/01/10principl es_english.pdf. Cambridge: University of Cambridge, School of Education.
Austin, J. L. (1962) How to do things with
words. Cambridge: Harvard
University Press.
Bachman, L. F. (1990). Fundamental
considerations in language testing.
Oxford: Oxford University Press. Bachman, L. F. & Palmer, A. S. (1996).
Language testing in practice.
Oxford: Oxford University Press. Bardovi-Harlig, K. (1995). The interaction
of pedagogy and natural sequences in the acquisition of tense and aspect. In Fred R. Eckman (Eds)
Second language acquisition:
theory and pedagogy (pp.
151-168). Mahwah, N.J.: L. Erlbaum Associates.
Bardovi-Harlig, K. (2001). Another Piece of the Puzzle: The Emergence of the Present Perfect. In R. Ellis (Ed.) Form-focused instruction and
second language learning (pp.
215-264). Malden, MA: Blackwell Publishers.
Biber, D., & Gray, B. (2010). Challenging stereotypes about academic writing: Complexity, elaboration, explicitness. Journal of English
For Academic Purposes, 9(1),
2-20.
Biber, D., Gray, B., & Poonpon, K. (2011). Should we use characteristics of conversation to measure grammatical complexity
in L2 writing
45, 5-35.
Black, P., Harrison, C., Lee, C., Marshall, B., & Wiliam, D. (2004). Working inside the black box: Assessment for learning in the classroom. Phi
Delta Kappan, 86(1), 8–21.
Brace, N., Kemp, R. & Snelgar, R. (2000).
SPSS for psychologists: a guide to
data analysis using SPSS for windows (versions, 8, 9, and 10).
Houndmills: MACMILAN PRESS LTD.
Brown J.D. and Hudson, T.D. (1998). The alternatives in language assessment. TEOSL Quarterly, 32
653-75.
Buck, G. (2001). Assessing listening.
Cambridge. UK: Cambridge
University Press.
Canale, M. (1983). On some dimensions of language proficiency. In Oller, J. W. (Eds.), Issues in language
testing research (pp. 333-342).
Rowley, MA: Newbury House. Canale, M. and Swain, M. (1980).
Theoretical bases of communicative approaches to second language teaching and testing. Applied Linguistics, 1(1), 1–47.
Celce-Murcia, M., Dörnyei, Z. and Thurrell, S. (1995). Communicative competence: a pedagogically motivated model with content specifications. Issues in Applied Linguistics, 2, 5–35. Davidson, F., & Lynch, B. K. (2002).
Testcraft: A teacher’s guide to writing and using language test
specification. New Haven: Yale
University Press.
DeKeyser, R. (2005). What makes learning second-language grammar difficult? A review of issues.
Language Learning, 55, 1–25.
DeMars, C. (2010). Item Response Theory.
Oxford University Press: Oxford. Ellis, R. & Yuan, F. (2005). The effects of
careful within-task planning on oral and written task performance.
In R. Ellis (Ed.), Planning and task performance in a second language
(pp. 167-192). Amsterdam: John Benjamins.
Huhta, A. (2008). Diagnostic and formative assessment. In B. Spolsky & F. M. Hult (Eds.), The
handbook of educational
linguistics (pp. 469-482). Oxford:
Blackwell Publishing Ltd.
Hymes, D. (2001). On communicative competence. In A. Durati (Ed.),
Linguistic anthropology a reader
(pp. 53-73). Oxford: Balckwell Publishers Inc.
Jang, E. E. (2009). Cognitive diagnostic assessment of L2 reading comprehension ability: Validity arguments for applying Fusion Model to Language assessment.
Language Testing, 26(1), 31-73. Laufer, B. & Goldestein, Z. (2004).
Testing vocabulary knowledge: size strength and computer adaptiveness. Language Learning, 54(3), 399- 436.
Laufer, B. Elder, C. Hill, K. & Congdon, P. (2004). Size and strength: do we need both to measure vocabulary knowledge? Language testing, 21,
202-226.
Linacre, J. M. (1994). Sample Size and Item Calibration Stability. Rasch
Measurement Transactions, 7(4),
328.
Linacre, J. M. (2002). What do infit and outfit, mean-square and standardized mean? Rasch
Measurement Transactions, 16 (2),
878.
Linacre, J. M. (2010). A User's Guide to
WINSTEPS®. Retrieved May 2,
2010 from
http://www.winsteps.com/.Linacre, J.M. (2010b) Winsteps® (Version 3.70.0) [Computer Software]. Beaverton, Oregon:Winsteps.com. McNamara, T. F. (1996). Measuring
second language performance.
Norris, J. M. & Ortega, L. (2009). Towards an Organic Approach to Investigating CAF in Instructed SLA: The Case of Complexity.
Applied Linguistics, 30, 555-578. Oller, J. W. (1979). Language tests at
school. London: Longman.
Oller, J. W. (1983) A consensus for the 80s. In Oller, J. W. (Ed.), Issues in
language testing research (pp.
351–356). Rowley, MA: Newbury House.
Ortega, L. (2003). Syntactic complexity measures and their relationship to L2 proficiency: research synthesis of college-level L2 writing.
Applied Linguistics, 24, 492–518. Purpura, J. (2004). Assessing grammar.
Cambridge: Cambridge University Press.
Ravid, D., & Berman, R. A. (2010). Developing noun phrase complexity at school age: A text-embedded cross-linguistic analysis.
First Language, 30, 3–26.
Rimmer, W. (2006). Measuring grammatical complexity: the Gordian knot. Language Testing,
23, 497- 519.
Rimmer, W. (2008). Putting grammatical complexity in context. Literacy,
42(1), 29-35.
Robinson, P. (2007). Task complexity, theory of mind, and intentional
reasoning: Effects on L2 speech production, interaction, uptake and perceptions of task difficulty.
International Review of Applied Linguistics,45, 237–57.
Shin, D. (2012). Item writing and writers. In G, Fulcher and F, Davidson (Eds.), Routledge handbook of
language testing (pp. 237-248).
London: Routledge.
Shohamy, E. (1992). Beyond proficiency testing: A diagnostic feedback testing model for assessing foreign language learning. The Modern
Language Learning, 76, 513-521.
Spolsky, B. (1990). Social aspects of individual assessment. In J de Jong & D. K. Stevenson (Eds.),
Individualizing the assessment of language abilities (pp. 3-15). Widdowson, H. G. (2003). Defining issues
in English language teaching.
Oxford: Oxford University Press. Wiliam, D. (2011). What is assessment for
learning? Studies in Educational Evaluation,37, 3-14.
Wolfe-Quintero, K., Inagaki, S., & Kim, H-Y. (1998). Second language development in writing: Measures of fluency, accuracy, and complexity (Technical Report No. 17).
Honolulu, HI: Second Language Teaching & Curriculum Center,