Sex-specificdifferencesinwhitematter
microvascularintegrityafter
ischaemicstroke
Mark R Etherton ,1 Ona Wu,1,2,3 Pedro Cougo,1,4 Svetlana Lorenzano,1,5 Hua Li,3
Lisa Cloonan,1 Mark J R J Bouts,1,2,6 Arne Lauer,1,7 Ken Arai,3 Eng H Lo,1,3
Steve K Feske,8 Karen L Furie,9 Natalia S Rost1
For numbered affiliations see end of article.
Correspondence to Dr Mark R Etherton; metherton@ partners. org To cite: Etherton MR, Wu O, Cougo P, et al. Sex- specific differences in white matter microvascular integrity after ischaemic stroke. Stroke & Vascular Neurology 2019;4: e000268. doi:10.1136/svn-2019-000268
Received 22 July 2019 Revised 7 August 2019 Accepted 12 August 2019 Published Online First 3 September 2019
© Author(s) (or their employer(s)) 2019. Re- use permitted under CC BY- NC. No commercial re- use. See rights and permissions. Published by BMJ.
AbsTrACT
background and purpose Functional outcomes after ischaemic stroke are worse in women, despite adjusting for differences in comorbidities and treatment approaches. White matter microvascular integrity represents one risk factor for poor long- term functional outcomes after ischaemic stroke. The aim of the study is to characterise sex- specific differences in microvascular integrity in individuals with acute ischaemic stroke.
Methods A retrospective analysis of subjects with acute ischaemic stroke and brain MRI with diffusion- weighted (DWI) and dynamic- susceptibility contrast- enhanced (DSC) perfusion- weighted imaging obtained within 9 hours of last known well was performed. In the hemisphere contralateral to the acute infarct, normal- appearing white matter (NAWM) microvascular integrity was measured using the K2 coefficient and apparent diffusion coefficient (ADC) values. Regression analyses for predictors of K2 coefficient, DWI volume and good outcome (90- day modified Rankin scale (mRS) score <2) were performed.
results 105 men and 79 women met inclusion criteria for analysis. Despite no difference in age, women had increased NAWM K2 coefficient (1027.4 vs 692.7×10
–6/s; p=0.006). In women, atrial fibrillation (β=583.6; p=0.04) and increasing NAWM ADC (β=4.4; p=0.02) were associated with increased NAWM K2 coefficient. In multivariable regression analysis, the
K2 coefficient was an independent predictor of DWI volume in women (β=0.007; p=0.01) but not men.
Conclusions In women with acute ischaemic stroke, increased NAWM K2 coefficient is associated with increased infarct volume and chronic white matter structural integrity. Prospective studies investigating sex- specific differences in white matter microvascular integrity are needed.
InTroduCTIon
Sex disparities in acute ischaemic stroke (AIS) outcomes represent an important clinical issue. Compared with men, women have worse func-tional outcomes.1 2 Women are known to be
older at the time of stroke,3 have higher rates
of antecedent disability and atrial fibrillation,2
and lower rates of treatment with thrombo-lytic therapy.4 Even after adjusting for these
differences, however, functional outcomes are worse in women.5 Understanding the factors
that contribute to this sex disparity in stroke
outcomes represents an opportunity to improve patient care and stroke outcomes.
The decreased structural integrity of cerebral white matter and increased blood–brain barrier (BBB) permeability are factors that negatively affect poststroke outcomes.6–9 Evidence of
cere-bral microvascular dysfunction can be detected on T2- weighted MRI as white matter hyperin-tensities (WMH), enhanced BBB permeability on perfusion- weighted imaging (PWI), or measured in normal- appearing white matter (NAWM) as loss of microstructural integrity on diffusion- tensor imaging (DTI), and reflected as an increase in the apparent diffusion coef-ficient (ADC) values.7 10 Both increased
diffu-sivity and BBB permeability have been linked to poor outcomes after AIS,6–8 with a potential sex-
specific contribution.11 We have also reported
a novel association between increasing NAWM
K2 coefficient, as a potential surrogate of BBB permeability, and worse functional outcomes after AIS.7 Two important findings were
observed in that analysis: (1) increased NAWM
K2 coefficient in women compared with men and (2) increased matrix metalloproteinase-2 (MMP-2) levels, as a measure of acute BBB disruption,12 were associated with worse long-
term outcomes. The underlying aetiology of these sex- specific differences in BBB permea-bility and influences on ischaemic tissue and functional outcomes, however, was unclear.
In this study, we evaluated sex- specific clin-ical and radiographic variables associated with NAWM K2 coefficient and their impact on infarct volume and 90- day functional outcomes after AIS.
MeThods
standard protocol approvals, registrations and patient consents
This study and the use of human partici-pants was approved by the local Institutional Review Board. Written informed consent was obtained from all participating subjects or their surrogates.
on September 18, 2020 by guest. Protected by copyright.
subjects and inclusion/exclusion criteria
We performed a retrospective analysis of a prospective biomarker cohort study of consecutive adult AIS subjects admitted between February 2007 and 2011 (National Institutes of Health Specialized Program of Translational Research in Acute Stroke).13 14
All subjects presenting to two academic medical centres within 9 hours of the last known well (LKW) and with signs and symptoms of AIS were screened for eligibility. To be eligible for inclusion in this study, subjects were required to undergo brain MRI within 9 hours from LKW containing diffusion- weighted imaging (DWI), dynamic- susceptibility contrast (DSC) perfusion- weighted MRI, and fluid- attenuated inversion recovery (FLAIR) MRI sequences; have a confirmed acute infarct on DWI; and have plasma MMP-2 levels collected at the time of study enrollment. We excluded patients with artefactual MMP-2 recordings and those with acute infarcts in both hemispheres.
Clinical assessments
Age, medical history and antecedent medications were obtained from the subject or their surrogates or other-wise from the review of the medical record at the time of admission. Admission systolic and diastolic blood pressures were acquired from the first documented vital signs. Treatment with intravenous alteplase was recorded. Tobacco use was dichotomised as current or past use versus never. Alcohol use was defined and dichotomised as current versus none. Anticoagulant use was defined as prehospital use of lovenox or coumadin.
Imaging analysis MRI protocol
The majority of MRIs were performed on a 1.5T General Electric Signa HDx scanner with the following acqui-sition parameters. DTI: repetition time (TR)/echo time (TE)=5000/85.3 ms, 220 mm field- of- view, 5 mm slice thickness with 1 mm gap, in- plane resolution of 0.86×0.86 mm2 (128×128 acquisition matrix up- sampled to 256×256), three 0 s/mm2 (b- zero) and 1000 s/mm2 in 25 directions. FLAIR: TR/TE/TI=10 002/145/2200 ms, 220 mm field- of- view, 5 mm slice thickness with 1 mm gap, and in- plane resolution of 0.86×0.86 mm2. For 10 subjects, FLAIR scans were acquired at a separate time from the original DWI and DSC sequences due to an unavailable or unusable FLAIR scan on the original MRI. DSC: 80 acqui-sitions, TR/TE=1500/40 ms, 220 mm field- of- view, 5 mm slice thickness with 1 mm gap, 1.72×1.72 mm2 in- plane resolution. DSC sequences were acquired using bolus tracking of a single dose of gadolinium- based contrast agent (0.1 mmol/kg) administered with a power injector. Motion and eddy current distortions were corrected in all DTI datasets and the ADC maps were then derived from the high- b- value and low- b- value DTI sequences.15
To estimate BBB permeability, the K2 coefficient (/s) was mathematically derived from the concentration- time curves using the Boxerman- Weisskoff model.16 In brief,
the effective transverse relaxation rate due to the contrast agent, a parameter representing the per voxel concentra-tion of contrast agent, is represented as:
∆ ¯R∗2 (
t)≈ K1· ∆R¯∗2 (
t)− K2
ˆ 1
0 ¯ ∆R∗
2 (
t′)dt′
A least- squares fit to this equation can subsequently be used to solve for the K2 coefficient on a voxelwise basis.
Mean transit time (MTT) maps were calculated from deconvolved DSC data converted to concentration changes over time using a tracer arrival timing- insensitive technique.17 18
Volumetric lesion mapping
The DWI and MTT lesions were outlined using an inten-sity threshold- based method. All DWI lesions were cross- referenced to ADC maps to exclude subacute and chronic infarcts as well as infarcts involving the bilateral cerebral hemispheres. The acute infarct volume and ipsilateral perfusion deficit, assessed on DWI sequences (DWIv) and MTT maps (MTTv), respectively, were calculated semiautomatically using MRIcro software (University of Nottingham School of Psychology, Nottingham, UK; www. mricro. com).
WMH lesions in the hemisphere contralateral to the acute infarct were outlined in a semi- automated manner using MRIcro software as described previously.11 19 All
images were analysed by trained research staff that were blinded to all outcome data.
NAWM segmentation and analysis
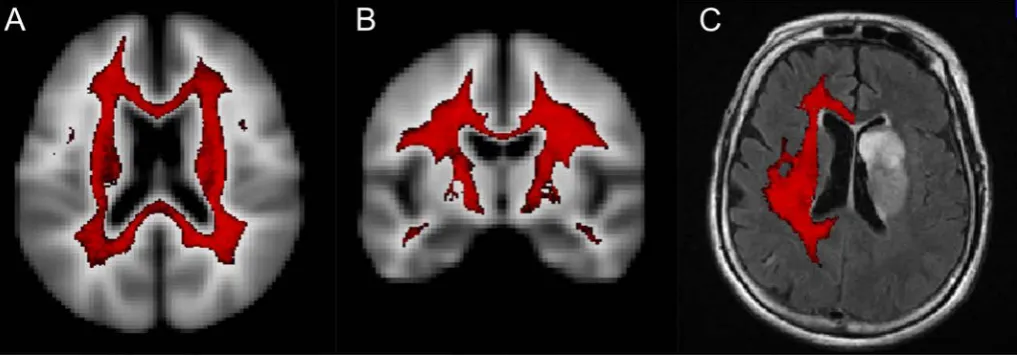
NAWM segmentation in the contralateral hemisphere was performed as described previously (figure 1).7 The mean
ADC and K2 coefficients were measured in contralateral NAWM as defined by the probabilistic mask.
Stroke and outcomes assessment
All subjects were evaluated at the time of admission by a trained neurologist and stroke severity was deter-mined using the National Institutes of Health Stroke Scale (NIHSS). Stroke subtype was categorised according to the Causative Classification of Stroke System (CCS) score.20 Haemorrhagic transformation was defined as
the presence of any petechial or parenchymal haema-toma on follow- up CT or MRI (obtained within 48 hours of LKW). Functional outcome at 90 days was measured using the mRS score, which was obtained either through an in- person or validated telephone- based interview.21
Good functional outcome was defined as a 90- day mRS score of <2.
statistical analysis
WMH volume (WMHv) and DWI volume (DWIv) were normalised to the intracranial area.22 Univariable
anal-ysis was performed using linear regression to deter-mine factors associated with K2 coefficient and DWIv and logistic regression to evaluate factors associated with good functional outcome. Variables that displayed an association, a priori set at p<0.05, in univariable anal-ysis were inserted into a backward stepwise elimination
on September 18, 2020 by guest. Protected by copyright.
Figure 1 NAWM segmentation. (A) Axial and (B) coronal views of probabilistic white matter mask with threshold of >95% probability white matter (red) superimposed on the International Consortium for Brain Mapping 425 atlas. (C) Representative image of final contralesional normal- appearing white matter mask (red) overlaid on FLAIR image.
multivariable regression model. To minimise influences of collinearity, WMHv and NAWM ADC, as markers of global structural integrity, were input into separate multi-variable regression models when significant in univari-able analysis. Admission NIHSS was excluded from multi-variable regression models for DWIv and good outcomes due to the known strong association between NIHSS and DWIv.23 24 Statistical significance was set at a p value
of<0.05.
resulTs
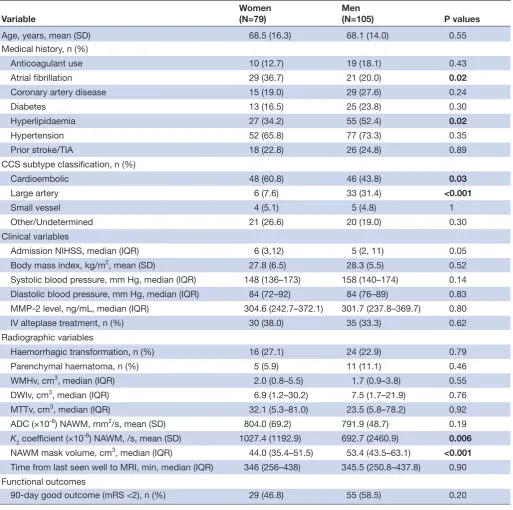
A total of 105 men and 79 women met inclusion criteria for analysis in this study. The baseline demographics are shown in table 1. Women were more likely to have atrial fibrillation and cardioembolic strokes. Men had a greater incidence of hyperlipidaemia and strokes attributed to large- artery atheroembolism. Treatment rates with intra-venous alteplase were similar between men and women and only one patient in the cohort underwent intra- arterial therapy. There was no difference in WMHv, DWIv, MTT volume or NAWM ADC between men and women. Women, however, had significantly greater NAWM K2 coefficient (table 1).
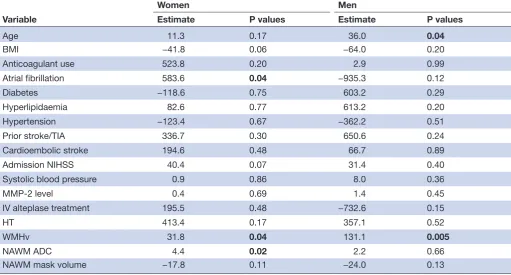
In women, WMHv, NAWM ADC and atrial fibrillation were associated with greater NAWM K2 coefficient in univariable linear regression analysis (table 2). In multi-variable analyses, increasing NAWM ADC was associated with increased NAWM K2 coefficient in women, whereas WMHv was not (table 3). In contrast, in men, WMHv and age were associated with NAWM K2 coefficient in univariable linear regression but only WMHv remained an independent predictor in the multivariable analysis (table 3). In the entire cohort, we observed no associa-tion between strokes attributed to large- artery athero-embolism (β=75.0; p=0.84) or cardioembolism (β=163.1; p=0.58) and the NAWM K2 coefficient.
In both men and women, the admission NIHSS was a significant predictor of DWIv in univariable
analysis (table 4). In women, administration of intra-venous alteplase, haemorrhagic transformation and increasing NAWM K2 coefficient were independently associated with DWIv. In comparison, in men, only atrial fibrillation was associated with increased DWIv. Subse-quent linear regression analysis including sex, NAWM K2 coefficient and an interaction term (male sex • NAWM K2 coefficient) showed that NAWM K2 coefficient (β=0.006; p=0.037) and the interaction term (β=−0.007; p=0.027) were independent predictors of DWIv for the entire cohort.
In multivariable logistic regression analysis, increasing NAWM ADC was an independent predictor of the decreased likelihood of good outcome for both sexes (table 5).
dIsCussIon
We report that the NAWM K2 coefficient, as a measure of microvascular integrity, is significantly increased in women compared with men with AIS. In addition, in women we observe sex- specific relationships: NAWM K2 coefficient is independently associated with NAWM ADC values and a predictor of infarct volume. These findings suggest that increased NAWM K2 coefficient in women, as a surrogate of BBB dysfunction, is associated with increased infarct size, which predisposes to worse long- term outcomes after stroke.
Our finding of sex- specific differences in NAWM K2 coefficient, as a putative measure of BBB dysfunction, is of clinical interest. We have previously reported an asso-ciation between NAWM structural integrity (fractional anisotropy) and sex- specific functional outcomes.11
Together, these observations offer some insight into the potential factors contributing to the disparity in stroke outcomes between sexes as they suggest that sex- specific differences in NAWM microvascular integrity predispose to worse outcomes in women. There are several potential explanations for the observed sex- specific differences in
on September 18, 2020 by guest. Protected by copyright.
Table 1 Comparison of admission and clinical variables in men and women with AIS
Variable
Women (N=79)
Men
(N=105) P values
Age, years, mean (SD) 68.5 (16.3) 68.1 (14.0) 0.55
Medical history, n (%)
Anticoagulant use 10 (12.7) 19 (18.1) 0.43
Atrial fibrillation 29 (36.7) 21 (20.0) 0.02
Coronary artery disease 15 (19.0) 29 (27.6) 0.24
Diabetes 13 (16.5) 25 (23.8) 0.30
Hyperlipidaemia 27 (34.2) 55 (52.4) 0.02
Hypertension 52 (65.8) 77 (73.3) 0.35
Prior stroke/TIA 18 (22.8) 26 (24.8) 0.89
CCS subtype classification, n (%)
Cardioembolic 48 (60.8) 46 (43.8) 0.03
Large artery 6 (7.6) 33 (31.4) <0.001
Small vessel 4 (5.1) 5 (4.8) 1
Other/Undetermined 21 (26.6) 20 (19.0) 0.30
Clinical variables
Admission NIHSS, median (IQR) 6 (3,12) 5 (2, 11) 0.05
Body mass index, kg/m2, mean (SD) 27.8 (6.5) 28.3 (5.5) 0.52 Systolic blood pressure, mm Hg, median (IQR) 148 (136–173) 158 (140–174) 0.14 Diastolic blood pressure, mm Hg, median (IQR) 84 (72–92) 84 (76–89) 0.83 MMP-2 level, ng/mL, median (IQR) 304.6 (242.7–372.1) 301.7 (237.8–369.7) 0.80
IV alteplase treatment, n (%) 30 (38.0) 35 (33.3) 0.62
Radiographic variables
Haemorrhagic transformation, n (%) 16 (27.1) 24 (22.9) 0.79
Parenchymal haematoma, n (%) 5 (5.9) 11 (11.1) 0.46
WMHv, cm3, median (IQR) 2.0 (0.8–5.5) 1.7 (0.9–3.8) 0.55 DWIv, cm3, median (IQR) 6.9 (1.2–30.2) 7.5 (1.7–21.9) 0.76 MTTv, cm3, median (IQR) 32.1 (5.3–81.0) 23.5 (5.8–78.2) 0.92 ADC (×10-6) NAWM, mm2/s, mean (SD) 804.0 (69.2) 791.9 (48.7) 0.19 K2 coefficient (×10-6) NAWM, /s, mean (SD) 1027.4 (1192.9) 692.7 (2460.9) 0.006 NAWM mask volume, cm3, median (IQR) 44.0 (35.4–51.5) 53.4 (43.5–63.1) <0.001 Time from last seen well to MRI, min, median (IQR) 346 (256–438) 345.5 (250.8–437.8) 0.90 Functional outcomes
90- day good outcome (mRS <2), n (%) 29 (46.8) 55 (58.5) 0.20
Bold values indicate P value < 0.05.
ADC, apparent diffusion coefficient; AIS, acute ischaemic stroke; CCS, causative classification system; DWIv, diffusion- weighted imaging volume; IQR, interquartile range; IV, intravenous; MMP, matrix metalloproteinaise; MTTv, mean transit time volume; NAWM, normal- appearing white matter; NIHSS, National Institutes of Health Stroke Scale; TIA, transient ischemic attack; WMHv, white matter hyperintensity volume.
NAWM K2 coefficient. First, we observed no substantial difference in age, hypertension, diabetes, anticoagulant use, intravenous alteplase treatment, rate of haemorrhagic transformation, WMHv or stroke severity in women. A relationship between NAWM BBB permeability and white matter structural integrity has been reported in individ-uals with cerebral small- vessel disease.25–27 In our acute
cohort, however, we observed no difference in strokes attributed to small- vessel occlusive disease between sexes.
We also observed no difference in baseline MMP-2 levels between sexes, a molecule thought to play a role in BBB remodelling.7 Another study showed that diastolic blood
pressure and blood glucose were independently associ-ated with BBB permeability abnormalities,28 however, we
observed no differences in admission blood pressure or rates of hypertension between sexes. Another hypothesis is the potential hormonal dysregulation of the BBB in women. Different murine models of oestrogen depletion
on September 18, 2020 by guest. Protected by copyright.
Table 2 Univariable analysis of sex- specific associations with NAWM K2 coefficient
Variable
Women Men
Estimate P values Estimate P values
Age 11.3 0.17 36.0 0.04
BMI −41.8 0.06 −64.0 0.20
Anticoagulant use 523.8 0.20 2.9 0.99
Atrial fibrillation 583.6 0.04 −935.3 0.12
Diabetes −118.6 0.75 603.2 0.29
Hyperlipidaemia 82.6 0.77 613.2 0.20
Hypertension −123.4 0.67 −362.2 0.51
Prior stroke/TIA 336.7 0.30 650.6 0.24
Cardioembolic stroke 194.6 0.48 66.7 0.89
Admission NIHSS 40.4 0.07 31.4 0.40
Systolic blood pressure 0.9 0.86 8.0 0.36
MMP-2 level 0.4 0.69 1.4 0.45
IV alteplase treatment 195.5 0.48 −732.6 0.15
HT 413.4 0.17 357.1 0.52
WMHv 31.8 0.04 131.1 0.005
NAWM ADC 4.4 0.02 2.2 0.66
NAWM mask volume −17.8 0.11 −24.0 0.13
Bold values indicate P value < 0.05.
ADC, apparent diffusion coefficient; BMI, body mass index; HT, haemorrhagic transformation; IV, intravenous; MMP, matrix metalloproteinase; NAWM, normal- appearing white matter; NIHSS, National Institutes of Health Stroke Scale; TIA, transient ischemic attack; WMHv, white matter hyperintensity volume.
Table 3 Multivariable backward stepwise elimination linear regression analysis for sex- specific predictors of NAWM K2 coefficient
Model Variables Estimate P values
Women 1 Atrial fibrillation – –
NAWM ADC 4.4 0.02
2 Atrial fibrillation 468.5 0.10
WMHv 25.1 0.11
Men 1 Age 27.3 0.11
WMHv 115.7 0.01
Bold values indicate P value < 0.05.
ADC, apparent diffusion coefficient; NAWM, normal- appearing white matter; WMHv, white matter hyperintensity volume.
have shown an association with increased BBB permea-bility.29 30 These observations could suggest that in our
female patient population, which is likely predominantly postmenopausal based on age, relative oestrogen defi-ciency contributes to increased NAWM K2 coefficient. Future studies investigating the association between menopausal status and BBB permeability could therefore be informative.
We also demonstrate an association between increasing white matter structural injury and alterations in NAWM BBB permeability. In both men and women, increased WMH burden is associated with NAWM K2 coefficient.
These findings support the hypothesis that early micro-vascular dysfunction in NAWM, causing BBB leakage, precedes white matter damage and WMH development. Corroborating this hypothesis, in patients with the small- vessel disease, increased BBB permeability is associated with WMH burden and hypertension.31 We go on to show
in women that NAWM ADC, a marker of altered water mobility, is associated with increased BBB permeability. These findings suggest that there may be sex- specific differences in the early relationship between NAWM BBB permeability and abnormal water mobility or structural integrity, which represents a risk factor for incident stroke and poor outcomes.8 27 32
In women, NAWM K2 coefficient is associated with
larger acute infarct volume. This occurred despite no difference between groups in age, intravenous alteplase administration, small- vessel occlusive stroke subtype, WMH burden and rates of haemorrhagic transforma-tion. One interpretation of these results is that increased NAWM K2 coefficient predisposes, or is a surrogate, for larger acute infarct volume. In support of this hypoth-esis, prior work in patients with AIS has shown that the K2
coefficient of the DWI lesion is inversely associated with rates of reperfusion post alteplase,33 and positively asso-ciated with the DWI volume and severity of intracranial haemorrhage postendovascular thrombectomy.34 Based
on what has been shown previously on the relationship of increasing BBB permeability and poor functional
on September 18, 2020 by guest. Protected by copyright.
Table 4 Sex- specific associations with acute infarct volume
Variable
Women Men
Univariable Multivariable Univariable
Estimate P values Estimate P values Estimate P values
Age −0.1 0.60 0.3 0.20
BMI −0.55 0.25 −0.84 0.21
Anticoagulant use −4.5 0.61 −6.5 0.45
Atrial fibrillation −1.2 0.84 20.8 0.01
Diabetes −11.8 0.14 −3.6 0.64
Hyperlipidaemia 0.6 0.92 −6.4 0.34
Hypertension −5.7 0.36 12.8 0.09
Prior stroke/TIA 6.1 0.38 13.7 0.07
Cardioembolic stroke 1.8 0.76 −1.1 0.87
Admission NIHSS 2.7 <0.001 3.0 <0.001
Systolic blood pressure −0.1 0.48 0.02 0.85
IV alteplase treatment 13.3 0.03 12.6 0.03 7.8 0.27
HT 20.6 0.005 16.9 0.01 13.0 0.11
WMHv 0.3 0.43 0.13 0.84
NAWM ADC 0.02 0.66 0.08 0.24
NAWM K2 0.006 0.01 0.007 0.01 −0.001 0.50
NAWM mask volume 0.15 0.54 −0.1 0.78
Multivariable Regression Equation.
Women: DWIv=β0+β1·(IV alteplase) +β2·(HT) +β3·(NAWMK2) Men:NA.
Bold values indicate P value < 0.05.
ADC, apparent diffusion coefficient; BMI, body mass index; DWIv, diffusion- weighted imaging lesion volume; HT, haemorrhagic
transformation; IV, intravenous; NA, not applicable; NAWM, normal- appearing white matter; NIHSS, National Institutes of Health Stroke Scale; TIA, transient ischemic attack; WMHv, white matter hyperintensity volume.
outcomes after AIS,7 8 35 our findings are promising and
hypothesis generating for a role of microvascular integ-rity in the sex- dispainteg-rity of stroke outcomes.
There are several limitations of this study that warrant consideration. First, this was a retrospective analysis of a hospital- based biomarker study of AIS subjects who underwent a clinical MRI with PWI within 9 hours from LKW. Non- isotropic voxels were used for analysis of diffusivity anisotropy, which could raise the possibility of partial volume effects as confounders of the MRI measurements.36 This was also an analysis of clinical
MRIs performed on patients with acute stroke where differences in patient head orientation, for example, could introduce registration errors of the automated NAWM mask. By automatically applying the same prob-abilistic white matter mask to each subject, however, this approach reduces human bias from manually placed region- of- interests. An automated approach for selecting NAWM regions- of- interest is therefore a clinically feasible method for measuring global NAWM microstructural and microvascular integrity in patients with AIS.
The interpretation of changes in the K2 coefficient also warrants discussion as this approach is relatively new for measuring BBB permeability in AIS subjects. At the
individual voxel level the K2 coefficient is a representa-tion of the contriburepresenta-tion of the T1 leakage effects due to contrast agent kinetics and the T2* leakage effects due to the tissue microstructure.37 38 For these reasons, the K
2
coefficient may reflect differences in other microvascular and tissue microstructural properties. The measurement of K2 in the acute setting is also likely a dynamic process with possible global influence from the acute ischaemic event.39 As compared with dynamic contrast- enhanced
(DCE) MRI and Ktrans, the measurement of NAWM K2 coefficient might have reduced sensitivity in the setting of delayed bolus arrival. However, by restricting our analyses to the hemisphere contralateral to the acute infarct we attempted to account for this limitation. We also cannot exclude the possibility that AIS can influence blood regulation and BBB permeability on remote sites or that differences in contralateral NAWM K2 reflect differences in reactivity in the acute setting. A DSC- based approach has, however, previously been shown to be feasible for characterising BBB disruption in AIS33 34 and there are
distinct advantages of the DSC technique for this popu-lation. DCE- MRI has a long acquisition time, which limits its feasibility for studying AIS subjects. In contrast, DSC image acquisition takes 1–2 min. Several prior reports
on September 18, 2020 by guest. Protected by copyright.
Table 5 Sex- specific associations with good outcomes
Variable
Women Men
Univariable Multivariable Univariable Multivariable
Estimate P values Estimate P values Estimate P values Estimate P values
Age −0.01 0.40 −0.05 0.006
BMI 0.07 0.18 0.04 0.31
Anticoagulant use 0.5 0.56 0.3 0.57
Atrial fibrillation −0.1 0.88 −1.0 0.06
Diabetes −1.1 0.20 0.03 0.95
Hyperlipidaemia 0.1 0.92 −0.4 0.34
Hypertension 0.7 0.17 −1.0 0.06
Prior stroke/TIA −1.2 0.10 −0.7 0.16
Cardioembolic stroke 0.1 0.88 0.1 0.80
Admission NIHSS −0.3 <0.001 −0.2 <0.001
Systolic blood pressure −0.01 0.93 −0.01 0.44
IV alteplase treatment −0.5 0.36 −1.4 0.002 −1.3 0.01
HT 0.02 0.97 −0.6 0.20
WMHv −0.1 0.07 −0.2 0.02
DWIv −0.03 0.04 −0.03 0.05 −0.04 0.006 −0.04 0.01
NAWM ADC −0.01 0.03 −0.01 0.04 −0.02 0.0007 −0.02 0.003
NAWM K2 −0.0004 0.06 −0.0001 0.42
Multivariable Regression Equation.
Women:Good outcome=β0+β1·DWIv+β2·(NAW ADC)
Men:Good outcome=β0+β1·DWIv+β2·(NAW ADC) +β3·(IV alteplase) +β4·(Age) Bold values indicate P value < 0.05.
ADC, apparent diffusion coefficient; BMI, body mass index; DWIv, diffusion- weighted imaging lesion volume; HT, haemorrhagic
transformation; IV, intravenous; NAWM, normal- appearing white matter; TIA, transient ischemic attack; WMHv, white matter hyperintensity volume.
have also demonstrated a strong correlation between K2 and Ktrans.38 40 Lastly, although we show sex- specific
differ-ences in NAWM K2 coefficient and the relationship with infarct volume, the aetiology of this observation is less clear. Future stroke studies applying DSC- MRI to charac-terise sex- specific differences in BBB permeability, strati-fied for comorbidities, are therefore necessary.
ConClusIons
Despite no differences in age and stroke severity, the NAWM K2 coefficient is increased in women with AIS and associated with infarct volume. These observations suggest that sex- specific differences in microvascular integrity may contribute to the sex disparity in poststroke outcomes.
Author affiliations
1Department of Neurology, Massachusetts General Hospital and Harvard Medical
School, Boston, Massachusetts, USA
2Martinos Center for Biomedical Imaging, Massachusetts General Hospital,
Charlestown, MA, United States
3Department of Radiology, Massachusetts General Hospital and Harvard Medical
School, Boston, MA, United States
4Medical School of Ribeirao Preto, University of Sao Paulo, Sao Paulo, Brazil
5Department of Human Neurosciences, Sapienza University of Rome, Rome, Italy 6Institute of Psychology, Leiden University, Leiden, Netherlands
7Department of Neuroradiology, Goethe- Universitat Frankfurt am Main, Frankfurt,
Germany
8Department of Neurology, Brigham and Women’s Hospital and Harvard Medical
School, Boston, MA, United States
9Department of Neurology, Warren Alpert Medical School of Brown University,
Providence, Rhode Island, USA
Contributors MRE: designed and conceptualised study; analysed the data; data acquisition; drafted the manuscript for intellectual content. OW: designed and conceptualised study; analysed the data; data acquisition; revised the manuscript for intellectual content. PC, SL, HL, LC, MJRJB, AL, KA and EHL: data acquisition; revised manuscript for intellectual content. SKF and KLF: designed and conceptualised study; revised manuscript for intellectual content. NSR: designed and conceptualised study; analysed data; revised manuscript for intellectual content.
Funding This work was supported by the National Institutes of Health NINDS Specialized Program of Transitional Research in Acute Stroke grant P50- NS051343; R01NS082285; R01NS086905; R01NS059775. Mark Etherton is supported in part by AHA – 17CPOST33680102. Ona Wu is supported in part by NIH- NINDS P50NS051343, R01NS059775, R01NS063925, R01NS082285 and R01NS086905. Pedro Cougo, Svetlana Lorenzano, Hua Li, Steven Feske, and Karen Furie were supported by NIH 5P50NS051343. Natalia S. Rost is supported in part by NIH- NINDS R01NS082285 and R01NS086905.
Competing interests None declared. Patient consent for publication Not required.
on September 18, 2020 by guest. Protected by copyright.
Provenance and peer review Not commissioned; externally peer reviewed. data availability statement Data are available upon reasonable request. open access This is an open access article distributed in accordance with the Creative Commons Attribution Non Commercial (CC BY- NC 4.0) license, which permits others to distribute, remix, adapt, build upon this work non- commercially, and license their derivative works on different terms, provided the original work is properly cited, appropriate credit is given, any changes made indicated, and the use is non- commercial. See: http:// creativecommons. org/ licenses/ by- nc/ 4. 0/.
orCId id
Mark R Etherton http:// orcid. org/ 0000- 0002- 4739- 2449
RefeRences
1. Appelros P, Stegmayr B, Terent A. Sex differences in stroke
epidemiology: a systematic review. Stroke 2009;40:1082–90.
2. Phan HT, Blizzard CL, Reeves MJ, et al. Sex differences in long-
term mortality after stroke in the INSTRUCT (International stroke
outcomes sTudy): a meta- analysis of individual participant data. Circ
Cardiovasc Qual Outcomes 2017;10.
3. Gall SL, Donnan G, Dewey HM, et al. Sex differences in presentation,
severity, and management of stroke in a population- based study.
Neurology 2010;74:975–81.
4. Lisabeth LD, Brown DL, Morgenstern LB. Barriers to intravenous tissue plasminogen activator for acute stroke therapy in women.
Gend Med 2006;3:270–8.
5. Reeves MJ, Bushnell CD, Howard G, et al. Sex differences in stroke:
epidemiology, clinical presentation, medical care, and outcomes.
Lancet Neurol 2008;7:915–26.
6. Etherton MR, Wu O, Cougo P, et al. Integrity of normal- appearing
white matter and functional outcomes after acute ischemic stroke.
Neurology 2017;88:1701–8.
7. Rost NS, Cougo P, Lorenzano S, et al. Diffuse microvascular
dysfunction and loss of white matter integrity predict poor outcomes
in patients with acute ischemic stroke. J Cereb Blood Flow Metab
2018;38:75–86.
8. Wardlaw JM, Doubal FN, Valdes- Hernandez M, et al. Blood- Brain
barrier permeability and long- term clinical and imaging outcomes in
cerebral small vessel disease. Stroke 2013;44:525–7.
9. Arsava EM, Rahman R, Rosand J, et al. Severity of leukoaraiosis
correlates with clinical outcome after ischemic stroke. Neurology
2009;72:1403–10.
10. Wardlaw JM, Smith EE, Biessels GJ, et al. Neuroimaging standards
for research into small vessel disease and its contribution to ageing
and neurodegeneration. Lancet Neurol 2013;12:822–38.
11. Etherton MR, Wu O, Cougo P, et al. Structural integrity of normal
appearing white matter and sex- specific outcomes after acute
ischemic stroke. Stroke 2017;48:3387–9.
12. Rosenberg GA, Estrada EY, Dencoff JE. Matrix metalloproteinases and TIMPs are associated with blood- brain barrier opening after
reperfusion in rat brain. Stroke 1998;29:2189–95.
13. Corbin ZA, Rost NS, Lorenzano S, et al. White matter hyperintensity
volume correlates with matrix metalloproteinase-2 in acute ischemic
stroke. J Stroke Cerebrovasc Dis 2014;23:1300–6.
14. Lorenzano S, Rost NS, Khan M, et al. Oxidative stress biomarkers
of brain damage: hyperacute plasma F2- isoprostane predicts infarct
growth in stroke. Stroke 2018;49:630–7.
15. Sorensen AG, Wu O, Copen WA, et al. Human acute cerebral
ischemia: detection of changes in water diffusion anisotropy by using
MR imaging. Radiology 1999;212:785–92.
16. Boxerman JL, Schmainda KM, Weisskoff RM. Relative cerebral blood volume maps corrected for contrast agent extravasation significantly correlate with glioma tumor grade, whereas uncorrected maps do
not. AJNR Am J Neuroradiol 2006;27:859–67.
17. Wu O, Ostergaard L, Weisskoff RM, et al. Tracer arrival timing-
insensitive technique for estimating flow in Mr perfusion- weighted imaging using singular value decomposition with a block- circulant
deconvolution matrix. Magn Reson Med 2003;50:164–74.
18. Copen WA, Deipolyi AR, Schaefer PW, et al. Exposing hidden
truncation- related errors in acute stroke perfusion imaging. AJNR Am
J Neuroradiol 2015;36:638–45.
19. Rost NS, Sadaghiani S, Biffi A, et al. Setting a gold standard for quantification of leukoaraiosis burden in patients with ischemic
stroke: the Atherosclerosis risk in Communities study. J Neurosci
Methods 2014;221:196–201.
20. Ay H, Benner T, Arsava EM, et al. A computerized algorithm for
etiologic classification of ischemic stroke: the causative classification
of stroke system. Stroke 2007;38:2979–84.
21. Bruno A, Shah N, Lin C, et al. Improving modified Rankin scale
assessment with a simplified questionnaire. Stroke 2010;41:1048–50.
22. Ferguson KJ, Wardlaw JM, Edmond CL, et al. Intracranial area: a
validated method for estimating intracranial volume. J Neuroimaging
2005;15:76–8.
23. Tong DC, Yenari MA, Albers GW, et al. Correlation of perfusion- and
diffusion- weighted MRI with NIHSS score in acute (. Neurology
1998;50:864–70.
24. Lovblad KO, Baird AE, Schlaug G, et al. Ischemic lesion volumes
in acute stroke by diffusion- weighted magnetic resonance imaging
correlate with clinical outcome. Ann Neurol 1997;42:164–70.
25. Topakian R, Barrick TR, Howe FA, et al. Blood- Brain barrier
permeability is increased in normal- appearing white matter in
patients with lacunar stroke and leucoaraiosis. J Neurol Neurosurg
Psychiatry 2010;81:192–7.
26. Arba F, Leigh R, Inzitari D, et al. Blood- Brain barrier leakage increases with small vessel disease in acute ischemic stroke.
Neurology 2017;89:2143–50.
27. Wardlaw JM, Doubal F, Armitage P, et al. Lacunar stroke is
associated with diffuse blood- brain barrier dysfunction. Ann Neurol
2009;65:194–202.
28. Bang OY, Saver JL, Alger JR, et al. Patterns and predictors of blood-
brain barrier permeability derangements in acute ischemic stroke.
Stroke 2009;40:454–61.
29. Wilson AC, Clemente L, Liu T, et al. Reproductive hormones regulate
the selective permeability of the blood- brain barrier. Biochim Biophys
Acta 1782;2008:401–7.
30. Maggioli E, McArthur S, Mauro C, et al. Estrogen protects
the blood- brain barrier from inflammation- induced disruption
and increased lymphocyte trafficking. Brain Behav Immun
2016;51:212–22.
31. Munoz Maniega S, Chappell FM, Valdes Hernandez MC, et al.
Integrity of normal- appearing white matter: influence of age, visible lesion burden and hypertension in patients with small- vessel disease.
J Cereb Blood Flow Metab 2017;37:644–56.
32. Farrall AJ, Wardlaw JM. Blood- Brain barrier: ageing and microvascular disease- systematic review and meta- analysis.
Neurobiol Aging 2009;30:337–52.
33. Simpkins AN, Dias C, Leigh R. National Institutes of health natural history of stroke I. Identification of reversible disruption of the
human blood- brain barrier following acute ischemia. Stroke
2016;47:2405–8.
34. Leigh R, Christensen S, Campbell BC, et al. Pretreatment blood- brain
barrier disruption and post- endovascular intracranial hemorrhage.
Neurology 2016;87:263–9.
35. Liu C, Yan S, Zhang R, et al. Increased blood- brain barrier permeability in contralateral hemisphere predicts worse outcome in
acute ischemic stroke after reperfusion therapy. J Neurointerv Surg
2018.
36. Vos SB, Jones DK, Viergever MA, et al. Partial volume effect as a
hidden covariate in DTI analyses. NeuroImage 2011;55:1566–76.
37. Liu HL, YY W, Yang WS, et al. Is Weisskoff model valid for the
correction of contrast agent extravasation with combined T1 and
T2* effects in dynamic susceptibility contrast MRI? Med Phys
2011;38:802–9.
38. Skinner JT, Moots PL, Ayers GD, et al. On the use of DSC- MRI
for measuring vascular permeability. AJNR Am J Neuroradiol
2016;37:80–7.
39. Villringer K, Sanz Cuesta BE, Ostwaldt AC, et al. Dce- Mri blood-
brain barrier assessment in acute ischemic stroke. Neurology
2017;88:433–40.
40. Bonekamp D, Deike K, Wiestler B, et al. Association of overall
survival in patients with newly diagnosed glioblastoma with contrast- enhanced perfusion MRI: Comparison of intraindividually matched
T1 - and T2 (*) -based bolus techniques. J Magn Reson Imaging
2015;42:87–96.
on September 18, 2020 by guest. Protected by copyright.