* Corresponding author: Seyedeh Zahra Jalilzadeh, E-mail: [email protected]
Islamic Republic of Iran Broadcasting University, Tehran, Iran.
Received October 5, 2013; Revised December 17, 2013; Accepted December 24, 2013
This paper is available on-line at http://ijoh.tums.ac.ir
ABSTRACT
Acoustic experimental data of IRIB (Islamic Republic of Iran Broadcasting) server room was taken to measure the acoustic noise characteristics of frequency and Sound Pressure Level (SPL). The purposes of this paper are measuring the noise pollution and its evaluation through the regulations. The measurements were taken in two stages. The first one was taken at 10 points by Sound Investigator 2260 using ISO 3741: 1999(E) standard. The results indicate that IRIB server room is an acoustic noise polluted according to Iranian National Building Regulations. Measured data and its frequency analysis show that the high sound energy belongs to low frequencies in the server room. This is confirmed by the next stage of measurement. It was an hour long non-stop noise measurement in the server room to investigate noise exposure level by customers and employees. The Equivalent instant noise level on A-weighting network was 75 dBA. The results are valid for all of data centres, although this study is involved with a special case study. Two main factors are important in server room noise pollution scenario; the amount of sound absorbance in the space and environmental noise characteristics. Most surfaces in server rooms are hard and have low absorbance coefficient, therefore, the intensity of travelling sound increases. On the other hand, the main noise sources in any server room are fans which work usually on a narrowband with a fundamental frequency. So as the main features of server room acoustic noise are the same, the presented results can be generalized to any server room.
Keywords:Data Centers; Acoustic Noise; Noise Criteria; Measurement
INTRODUCTION
Data Centers play an important role in every organization or company to provide various services. They host a large number of racks, servers and computers that require various fans to keep their systems cool. When all fans run together at one time, the ambient noise inevitably increases. As there is no acoustic absorbent surface such as furniture or panels in the space, the sounds are not absorbed and the intensity
Fig 1. A server room using different structure of cooling systems. Fig 2. IRIB data centre perspective
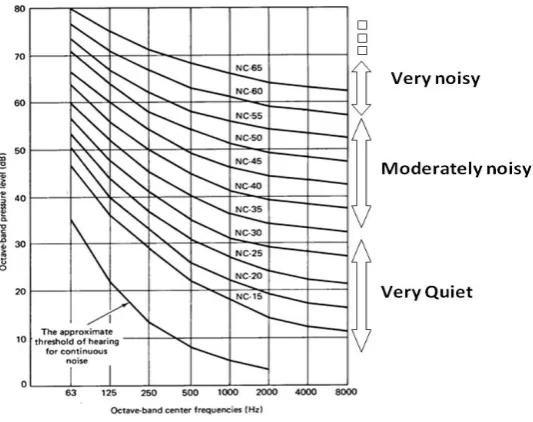
Fig 3. Standard level of NC [6]
a lower Sound Pressure Level than regulations. These problems are called disturbance, intrusion and annoyance [ 1].
The main noise sources in server rooms are cooling fans within servers and HVAC (Heating, Ventilation and Air Conditioning) equipments. In this survey, we try to investigate server room acoustic noise to clarify its features by experimental data and analyzing. So, IRIB’s data centre server room is regarded as a sample area. Islamic Republic of Iran Broadcasting (IRIB) Data Centre has a Room-Based cooling system [ 2] server room. It means that, there are some air conditioners and fans in racks to control room temperature. Fig 1 shows the different structures of cooling system in server rooms.
Acoustic noise survey involves measuring noise level in selected locations in a certain noisy area and measuring is usually done by a Sound Level Meter (SLM) in different times according to acoustic standards. Here, the survey method is based on engineering method which is recommended whenever a
more accurate assessment of the background noise level is required. Measurements were done in two sections. First one is evaluation of noise with the Noise Criteria (NC) of IRIB server room and the second one is noise frequency analyzing and comparing it to standards. The results are useful to control method as well because they are based on frequency analysis. So, designing an Active Noise Control system is pursued by authors to control noise pollution in later steps. The second section of experiments relates to an hour non-stop ambient noise measurement to investigate the noise level by customers and employees in the server room.
MATERIALS AND METHOD
acoustic noise with different characteristics; frequency and Sound Pressure Level (SPL).
There are various instruments and techniques to determine the environment’s acoustic noise characteristics and its exposure. The selection of technique depends on the workplace noise and the information which the researcher needs. Some researchers have done their experiments based on Sound Pressure Level measurements [ 3] and some of them use the reverberation time (RT) or EDT to investigate the acoustic noise of environment as Dr. Sommerfeldt et al. have done [ 4] in a certain server room. We measured the linear equivalent noise level and on A-weighted level in server room using ISO 3741: 1999(E) standard [ 5] at different locations and then analysed the captured data.
Noise Criteria (NC)
The NC curves are familiar for acousticians and audio- engineers. As can be seen in Fig 3, these curves
Factories 40-65
survey to measure the Sound Pressure Level. It can display the frequency analysis in one and 1/3-octave spectra. The investigator 2260 is shown in Fig 5. Measuring is based on ISO 3741: 1999(E) standard.
IRIB server room’s NC is obtained by measuring the SPL at 10 points regarding the room volume (211.296m3 ). Physical restrictions to set up the equipment are another limitation to access all of the central points (Fig 4). The time of measurements is random as the activities of instruments do not obey any discipline, although, it is supposed that measuring is done when most of servers are active.
According to standards, the height of measuring microphone must be 1.2 or 1.5 meter above the floor. Kipping this in mind, measurements are done for different heights of microphone. The elevation angel of investigator’s microphone is 45º relative to normal vector on floor surface. Fig 6 demonstrates the measurements of IRIB server room ambient noise using 2260 Investigator. After gathering the measured data, it comes to analyze them by soft wars. Using the average of SPL over the points, the total NC of server room is calculated to be 67 dB [ 9]. The measured data are shown in terms of every point in the results section.
ent.
Fig 6. Measurement by 2260 Investigator in IRIB data centre server room Fig 7. Frequency response of weighting filters [ 10]
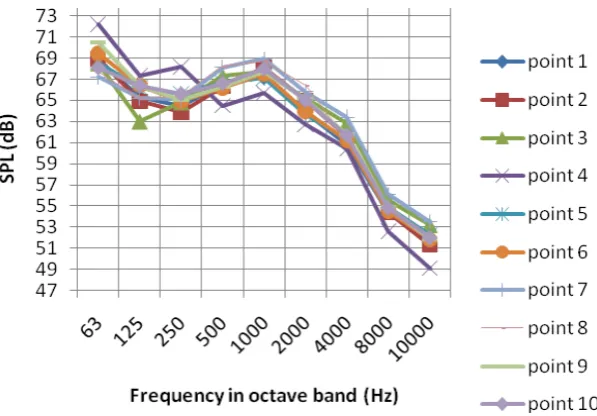
Fig 8. Measured data at certain points in IRIB server room
The results of measurements for one non stopping hour are presented in this section. The results of measurements are shown in Table 2. In acoustic measurements, the time of measuring is 15 -30 minutes in day and similar period of time at nights but in this survey, as the most working time is in days, so the measurement is done only over several days. Also regarding the IPC1, the length of any measurements may be differ
A-weighting
The human hearing system’s sensitivity is not the same for every frequency. It means that, we hear some sounds louder than the others with similar levels but different frequency [ 10]. Due to the different perception of sounds by ear, variant filters are regarded in measuring equipments. The filters are called dB (A), dB
1
- International Pollution Control-EPA
(B) and dB(C). Fig 7 shows the frequency response of mentioned filters. Because of similarity of dB (A) response to hearing system one, this filter is more useful in acoustics especially to state a human perception of sound. Here, the initial measurements are based on linear Sound Pressure Level without using any filter. In later steps, it is done by a lateral program in MATLAB [ 11] to conversion of octave band frequencies’ level on dB to dBA and obtains the total equivalent level.
RESULTS
Measured data at 10 locations in IRIB server room to determine the NC, are drawn in Fig 8. It states that in all of the measuring locations, the low frequencies are more powerful than high frequencies.
Fig 9. Averaged equivalent level of noise in IRIB data center
Fig 10. Frequency analysis of IRIB data centre by Adobe Audition
polluted (workplace) based on Iranian National Building Regulations [ 13] so working in this place is not a pleasant for its employees. Fig 9 is the average equivalent sound pressure level on 10 selected points in IRIB server room.
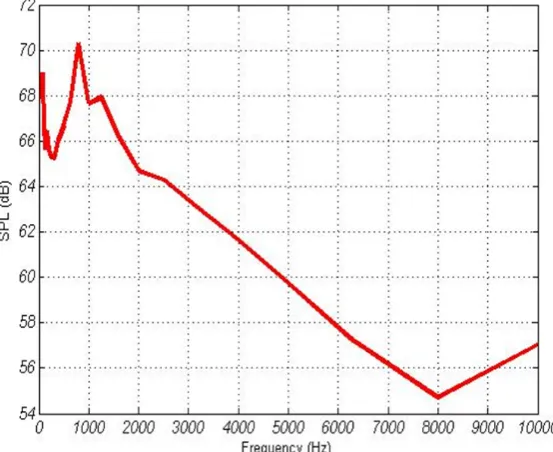
Both Fig 8 and Fig 9 verify that the maximum sound energy belongs to lower frequencies especially 500 to 2000 Hz band-width. Therefore, employees exit from the server room with a hum in their ear. This kind of pollution can lead to Temporary Threshold Shifting (TTS) and if it continues for a long period of time without using any hearing aids equipment, serious health problems should be expected. According to measured data, acoustic noise with 800 Hz frequency is the maximum in SPL. It is confirmed by the frequency analysis of the recorded sound in server room by Adobe
Audition [ 14] (Fig 10). Attenuation of peak frequency proved effective in noise reduction in the space. Therefore, reduction of low frequencies in server rooms helps to attenuate their noise pollution. The frequency spectrum also shows that the environmental noise in server room is stationary.
Fig 11 shows the A-weighted level of IRIB server room acoustic noise. In fact, this curve shows what the hearing system does in the server room. Accordingly, what we hear low frequencies louder than high frequencies.
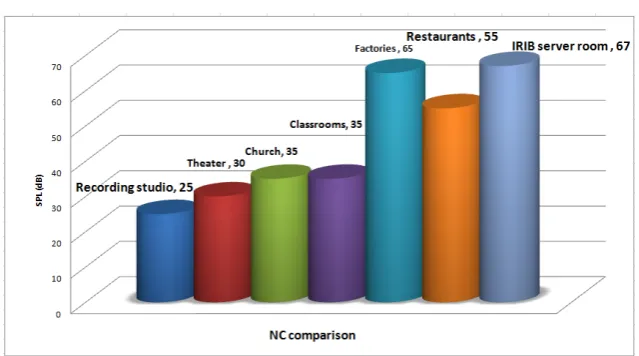
Fig 12 shows the comparison between IRIB server room’s NC and other places whose NC is presented [ 6].
Fig 11. A-weighted Equivalent level of IRIB data center’s noise
Fig 12. Comparison between IRIB data server room NC and other places
bothered by this problem grows to several employees. Table.2 shows the results in one non-stop hour measurement.
As stated before, the initial measurement data are in linear dB SPL. These values convert to dBA by using the value correction (converting from dB to dB (A)) which is shown in the fourth column of Table 2.
According to 18th topic of Iranian National Building Regulations, which is about Sound Insulation, IRIB server room is a noise polluted workplace. The maximum allowable noise level is 45dBA based on this standard for room computers, while, the instant equivalent noise level is 75 dBA in IRIB Data Center. According to the [ 15], the allowable time to work in this place is expressed as
t = 8 / 2(L - 45)/5
The equivalent averaged noise level of IRIB server room is 71.83 dBA in one hour length. It means that the equivalent exposure noise level for one hour is about
71.83 on dBA, although, the time length is reported is more than one hour.
So, the daily noise exposure can be estimated according to ISO/DIS 9612(1995) [ 16] as it is expressed in [ 15]
,8 , 10 log ( /10 0)
Aeq h Aeq T
L L T T
Where T is the sample and T0 is the reference time which is usually supposed to be eight hours.
Using the averaged noise level in one hour length, the
total noise exposure is
,8 71.83 10 log (1 / 8)10 62.79 Aeq h
L dBA
It means that, the daily noise exposure of a worker in Data Center is 62.79 dBA.
naturally. So using an active noise reduction method can be useful supplementary in this area.
CONCLUSION
Measured Equivalent noise levels in IRIB data centre server room varied from 53 dB to 72 dB. The environmental noise is stationary not impulsive. Measurements show that, the maximum sound energy belongs to low frequencies especially from 500 to 2000 Hz frequencies. The results underline the importance of hearing protection for employees in the server room for a long time as the Noise Criteria of this workplace is 67 dB. The noise level was found to vary gradually along the room’s space. It means that the total SPL of ambient noise in every location in server room is almost identical.
ACKNOWLEDGEMENTS
Our appreciations go to Dr Monazzam Esmaeil pour and people who have willingly helped us out with their abilities. The authors declare that there is no conflict of interests.
REFERENCES
1. Nasiri P. Noise Pollution. In: Textbook of Public Health. published by Iran Ministry of Health and Medical Education,
sources using sound pressure – precision methods for reverberation rooms. International Standard Organization ISO 3741. 1999.
6. Leo L.Beranek.Revised Criteria for noise in building. Noise Control 1957; 3(1).
7. Recommended Noise Criterion. Available from: http://www.engineeringtoolbox.com/nc-noise-criterion-d_725.html.
8. B&K. 2260 INVESTIGATOR. Brüel & Kjær manufacture Report.
9. Online Noise Criteria (NC) Calculator. Available from: http://www.engineeringtoolbox.com/nc-noise-criterion-d_517.html.
10. Daniel R.R. The SCIENCE and APPLICATIONS of ACOUSTICS. 2nd ed, Springer publishing Co., New York, 2006.
11. MATLAB R2009a help. The Mathworks, Inc., 2009.
12. Hemond C.J. Engineering Acoustics and Noise Control. 1st ed, Prentice Hall publishing Co, New Jersey, USA, 1983.
13. MRUD, Iranian National Buliding Regulation (Persian). Ministry of Road & Urban Development document. 2009.
Available from: http://nezammohandesi.ir/Portals/0/Pdf/Mogharrat-Melli/18.pdf
14. Adobe Audition CS5.5 help. The Adobe Systems, Inc, 2011.
15. WHO. STRATEGIES FOR NOISE SURVEYS. World Health Organization. Available from: http://www.who.int/occupational_health/publications/noise7.pdf
![Table 1. Standard level of NC for different places [7]](https://thumb-us.123doks.com/thumbv2/123dok_us/10098050.1996649/3.595.88.245.504.719/table-standard-level-nc-different-places.webp)