Journal of Endocrinology, Metabolism and Diabetes of South Africa is co-published by NISC (Pty) Ltd, Medpharm Publications, and Informa UK Limited (trading as the Taylor & Francis Group)
JEMDSA
ISSN 1608-9677 EISSN 2220-1009 © 2018 The Author(s)
RESEARCH
Journal of Endocrinology, Metabolism and Diabetes of South Africa 2018; 23(1):1–8https://doi.org/10.1080/16089677.2017.1385966 Open Access article distributed under the terms of the Creative Commons License [CC BY-NC 3.0]
http://creativecommons.org/licenses/by-nc/3.0
Incidence of hypoglycaemia among insulin-treated patients with type 1 or
type 2 diabetes mellitus: South African cohort of International Operations
Hypoglycaemia Assessment Tool (IO HAT) study
Mahomed AK Omara* , Adri Kokb, Duma Khutsoanec, Shaifali Joshid, Michael Ramaboeae, Makepisi Lesiba Isaac Mashitishof, Verushka Chettyg, Levi John Koopmang, Louise Johnsonhon behalf of the IO HAT investigator group
a Department of Diabetes and Endocrinology, University of KwaZulu Natal, Durban, South Africa b Specialist Physician, Alberton, South Africa
c Physician, Medi-Clinic, Bloemfontein, South Africa d General Physician, Brooklyn, South Africa
e Physician, Louis Pasteur Hospital, Pretoria, South Africa f Physician, Legae Medi Clinic, Mabopane, South Africa g Novo Nordisk A/S, Johannesburg, South Africa h Physician, Montana Hospital, Pretoria, South Africa
*Corresponding author, email: musso@mweb.co.za
Objectives: To assess the incidence and rates of hypoglycaemia in patients with type 1 diabetes mellitus (T1DM) or type 2 diabetes mellitus (T2DM) in the South African cohort of the International Operations Hypoglycaemia Assessment Tool (IO HAT) study.
Methods: Patients diagnosed with either T1DM or T2DM, aged ≥ 18 years and treated with insulin for > 12 months, completed self-assessment questionnaires to record demography, treatment information and hypoglycaemia during a 6-month retrospective and 4-week prospective periods (ClinicalTrials.gov: NCT02306681).
Results: In T1DM 76.2% (95% confidence interval [CI] 69.1%, 82.3%) of patients reported hypoglycaemia in the retrospective period and 98.2% (95% CI 94.7%, 99.6%) in the prospective period. The corresponding figures for patients with T2DM were 52.2% (95% CI 48.6%, 55.9%) and 90.1% (95% CI 87.7%, 92.3%), respectively. Rates of any and severe hypoglycaemia, respectively were T1DM 90.7 events per patient year (PPY) (95% CI 85.5, 96.1) and 8.8 events PPY (95% CI 7.2, 10.6) and T2DM 45.7 events PPY (95% CI 43.9, 47.5) and 8.9 events PPY (95% CI 8.1, 9.8) during the prospective period. The rates of hypoglycaemia were independent of glycated haemoglobin levels.
Conclusions: This is the first patient dataset of self-reported hypoglycaemia in South Africa; results showed that hypoglycaemia is under-reported.
Keywords: diabetes, hypoglycaemia, hypoglycaemic, insulin, South Africa
Introduction
Insulin is the mainstay of treatment for patients diagnosed with type 1 diabetes mellitus (T1DM) and is often used as an adjunct to oral antidiabetic agents in patients with type 2 diabetes mellitus (T2DM). Achieving optimum glycaemic control in insulin-treated patients with DM is commonly offset by resultant hypoglycaemia.1 A report of a workgroup of the American Diabetes Association (ADA) and the endocrine society defines hypoglycaemia in patients with DM as abnormally low plasma glucose concentrations that can expose the patient to potential harm.1 Symptoms and signs include tachycardia, tremor, sweating, nausea, extreme hunger, numbness, tingling, mood changes, irritability, confusion, slurred speech, loss of consciousness, weakness, cardiac dysfunction and seizures or death.2 These symptoms manifest progressively according to the severity of the hypoglycaemia.
The ACCORD and ADVANCE studies concluded that there was no evidence to suggest any of the deaths reported were caused directly by hypoglycaemia, although patients who experienced severe hypoglycaemia did have significantly higher mortality rates.3,4 The basis of increased fatal and non-fatal adverse events among patients with severe hypoglycaemia is unclear. However, it is postulated that hypoglycaemia may be a surrogate measure
of overall morbidity and disease burden.5 In fact, two studies have documented a 3.4- to 4-fold increased risk of death due to severe hypoglycaemia.5,6
Recent guidelines on diabetes treatment focused on the need for individualised glycated haemoglobin (HbA1c) targets to balance reductions in hyperglycaemia with the potential risks of hypoglycaemia.7 Hence, HbA
1c level is considered as one of the
key factors in individualising treatment regimens in diabetes patients.
In a study conducted in Cape Town, patient decision and health systems in South Africa were identified as potential barriers in initiating insulin therapy.8 Furthermore, a fear of hypoglycaemia is one of the important reasons for the avoidance and delay in initiation of insulin therapy.9
Very few studies on hypoglycaemia have thus far been reported in South Africa.10 Due to the lack of data on the incidence of hypoglycaemia in South Africa the problem may be grossly underestimated.
The page number in the footer is not for bibliographic referencing www.tandfonline.com/oemd 7
RESEARCH
Creative Commons License [CC BY-NC 3.0]http://creativecommons.org/licenses/by-nc/3.0
Incidence of hypoglycaemia among insulin-treated patients with type 1 or
type 2 diabetes mellitus: South African cohort of International Operations
Hypoglycaemia Assessment Tool (IO HAT) study
Mahomed AK Omara* , Adri Kokb, Duma Khutsoanec, Shaifali Joshid, Michael Ramaboeae, Makepisi Lesiba Isaac Mashitishof, Verushka Chettyg, Levi John Koopmang, Louise Johnsonhon behalf of the IO HAT investigator group
a Department of Diabetes and Endocrinology, University of KwaZulu Natal, Durban, South Africa b Specialist Physician, Alberton, South Africa
c Physician, Medi-Clinic, Bloemfontein, South Africa d General Physician, Brooklyn, South Africa
e Physician, Louis Pasteur Hospital, Pretoria, South Africa f Physician, Legae Medi Clinic, Mabopane, South Africa g Novo Nordisk A/S, Johannesburg, South Africa h Physician, Montana Hospital, Pretoria, South Africa
*Corresponding author, email: musso@mweb.co.za
Objectives: To assess the incidence and rates of hypoglycaemia in patients with type 1 diabetes mellitus (T1DM) or type 2 diabetes mellitus (T2DM) in the South African cohort of the International Operations Hypoglycaemia Assessment Tool (IO HAT) study.
Methods: Patients diagnosed with either T1DM or T2DM, aged ≥ 18 years and treated with insulin for > 12 months, completed self-assessment questionnaires to record demography, treatment information and hypoglycaemia during a 6-month retrospective and 4-week prospective periods (ClinicalTrials.gov: NCT02306681).
Results: In T1DM 76.2% (95% confidence interval [CI] 69.1%, 82.3%) of patients reported hypoglycaemia in the retrospective period and 98.2% (95% CI 94.7%, 99.6%) in the prospective period. The corresponding figures for patients with T2DM were 52.2% (95% CI 48.6%, 55.9%) and 90.1% (95% CI 87.7%, 92.3%), respectively. Rates of any and severe hypoglycaemia, respectively were T1DM 90.7 events per patient year (PPY) (95% CI 85.5, 96.1) and 8.8 events PPY (95% CI 7.2, 10.6) and T2DM 45.7 events PPY (95% CI 43.9, 47.5) and 8.9 events PPY (95% CI 8.1, 9.8) during the prospective period. The rates of hypoglycaemia were independent of glycated haemoglobin levels.
Conclusions: This is the first patient dataset of self-reported hypoglycaemia in South Africa; results showed that hypoglycaemia is under-reported.
Keywords: diabetes, hypoglycaemia, hypoglycaemic, insulin, South Africa
Introduction
Insulin is the mainstay of treatment for patients diagnosed with type 1 diabetes mellitus (T1DM) and is often used as an adjunct to oral antidiabetic agents in patients with type 2 diabetes mellitus (T2DM). Achieving optimum glycaemic control in insulin-treated patients with DM is commonly offset by resultant hypoglycaemia.1 A report of a workgroup of the American Diabetes Association (ADA) and the endocrine society defines hypoglycaemia in patients with DM as abnormally low plasma glucose concentrations that can expose the patient to potential harm.1 Symptoms and signs include tachycardia, tremor, sweating, nausea, extreme hunger, numbness, tingling, mood changes, irritability, confusion, slurred speech, loss of consciousness, weakness, cardiac dysfunction and seizures or death.2 These symptoms manifest progressively according to the severity of the hypoglycaemia.
The ACCORD and ADVANCE studies concluded that there was no evidence to suggest any of the deaths reported were caused directly by hypoglycaemia, although patients who experienced severe hypoglycaemia did have significantly higher mortality rates.3,4 The basis of increased fatal and non-fatal adverse events among patients with severe hypoglycaemia is unclear. However, it is postulated that hypoglycaemia may be a surrogate measure
of overall morbidity and disease burden.5 In fact, two studies have documented a 3.4- to 4-fold increased risk of death due to severe hypoglycaemia.5,6
Recent guidelines on diabetes treatment focused on the need for individualised glycated haemoglobin (HbA1c) targets to balance reductions in hyperglycaemia with the potential risks of hypoglycaemia.7 Hence, HbA
1c level is considered as one of the
key factors in individualising treatment regimens in diabetes patients.
In a study conducted in Cape Town, patient decision and health systems in South Africa were identified as potential barriers in initiating insulin therapy.8 Furthermore, a fear of hypoglycaemia is one of the important reasons for the avoidance and delay in initiation of insulin therapy.9
Very few studies on hypoglycaemia have thus far been reported in South Africa.10 Due to the lack of data on the incidence of hypoglycaemia in South Africa the problem may be grossly underestimated.
The non-interventional International Operations Hypoglycaemia Assessment Tool (IO HAT) study was designed to study the
prevalence of hypoglycaemia in insulin-treated DM in Bangladesh, Colombia, Egypt, Indonesia, Philippines, Singapore, South Africa, Turkey and United Arab Emirates.11 The aim of this sub-analysis was to assess the incidence and rates of hypoglycaemia in insulin-treated patients with T1DM or T2DM in the South African cohort.
Study design and methods
Study design
This was a non-interventional, multicentre, six-month retrospective and four-week prospective study of hypoglycaemic events using a two-part self-assessment questionnaire (SAQ1 and SAQ2) and patient diary (PD) for 28 days (Figure 1).
All patients in the South African cohort of the IO HAT study who responded to SAQ1 were included in this sub-analysis. Data on hypoglycaemia were collected from patients recruited between December 15, 2014 and May 14, 2015 across 31 sites in South Africa.
Eligible patients were enrolled consecutively during their routine clinic appointment with their healthcare provider to avoid selection bias. The study was approved by local ethics committees and health authorities and carried out in accordance with Good Pharmaco-epidemiological Practice and the Declaration of Helsinki: Ethical Principles for Medical Research Involving Human Patients.12,13
Study population
South African male or female patients aged ≥ 18 years at baseline with T1DM or T2DM treated with insulin for more than 12 months, ambulatory, and having signed an informed consent form were included in the study. Patients who had other issues such as illiteracy or inability to complete a written questionnaire were excluded from the study. No specific treatments were recommended or provided to the patients for their participation in the study.
Self-assessment of hypoglycaemia
SAQ1 was used to record baseline demographics, treatment information, hypoglycaemia unawareness, and perceptions of hypoglycaemia, the history of severe hypoglycaemia over the last six months, and any/nocturnal hypoglycaemia over the last four weeks and returned at baseline. SAQ2 was used to evaluate the history of severe and symptomatic hypoglycaemia, healthcare utilisation over the following four weeks after study entry and returned at the end of the study. To assist recall, the patients were advised to record the hypoglycaemic episodes in the PD provided to them. To avoid recall bias, the values in the PD were used to calculate incidence of hypoglycaemia in the four weeks after baseline in case the patient recorded fewer hypoglycaemic episodes in SAQ2.
Differences in reported hypoglycaemia in the retrospective and prospective periods were used to estimate under-reporting.
Patient knowledge of hypoglycaemia was evaluated by assessing if their understanding was consistent with the ADA definition of hypoglycaemia.1 It was important to assess if they knew what hypoglycaemia was before they read the introduction provided in the informed consent form. Specific questioning to determine if they had symptoms when they had low blood sugar levels assessed hypoglycaemia awareness. The response ‘usually’ denoted impaired awareness, and ‘occasionally’ or ‘never’ denoted severely impaired awareness (unawareness).14 Patients rated fear of hypoglycaemia on a scale of 0 (not afraid at all) to 10 (absolutely terrified).
Study objectives
The primary endpoint of this sub-analysis was to determine the percentage of patients experiencing at least one hypoglycaemic episode in the four-week prospective periods among insulin-treated patients with T1DM or T2DM. Difference in rates of any and nocturnal hypoglycaemia were compared between the four weeks before baseline and the four weeks after baseline; and rates of severe hypoglycaemia during the six-month
Figure 1: IO HAT study design. Severe hypoglycaemia: an event requiring assistance of another person to actively administer carbohydrate, glucagon, or other resuscitative actions. Non-severe hypoglycaemia: documented symptomatic (symptoms and blood glucose measurement ≤ 3.9 mmol/L [70 mg/dL]) and probable symptomatic (symptoms only) hypoglycaemia.
The page number in the footer is not for bibliographic referencing www.tandfonline.com/oemd 8
Incidence of hypoglycaemia among insulin-treated patients with type 1 or type 2 diabetes mellitus 3
retrospective and four-week prospective periods. Secondary endpoints included the relationship between hypoglycaemia and HbA1c levels, duration of diabetes, type of insulin therapy, patient’s knowledge of hypoglycaemia, fear of hypoglycaemia, patient actions as a result of hypoglycaemia, hypoglycaemia unawareness as a factor and the impact of hypoglycaemia on healthcare utilisation.
Categorisation of hypoglycaemia
Categories of hypoglycaemia recorded in SAQ1, SAQ2, and the PD confirmed that a hypoglycaemic episode was defined as blood glucose (BG) < 3.1 mmol/l not requiring assistance of another person and a severe hypoglycaemic episode as any hypoglycaemic event requiring assistance of another person to administer carbohydrate, glucagon or other resuscitative actions and/or hospitalisation.1 Nocturnal hypoglycaemia is any event occurring between midnight and six o’clock in the morning. A combined measure of any hypoglycaemic episode is the sum of all individual hypoglycaemic events of any category and this was calculated based on PD, SAQ1, and SAQ2 entries.
Statistical analysis
For the primary endpoint, the percentage of patients who experienced at least one hypoglycaemic episode in the four-week prospective periods among insulin-treated patients with T1DM or T2DM was calculated together with 95% confidence interval (CI), with the percentage presumed to predict a binomial distribution. Incidence rates of hypoglycaemia were reported as events per patient-year (PPY), calculated as the total number of events divided by total follow-up time in patient-years together with 95% CI.
Statistical tests were two-sided and regarded as exploratory, with the criterion for statistical significance set at p < 0.05. No adjustments were made for multiple comparisons. No imputation of missing data was performed, as the majority of analyses were descriptive in nature. Baseline refers to data collected using the SAQ1; follow-up refers to data collected using the SAQ2 and, where applicable, the PD.
Results
Demographic and clinical characteristics of study
subjects
A total of 915 patients were enrolled from study sites in South Africa (T1DM, n = 173; T2DM, n = 742) and completed SAQ1. Of these, 864 patients (T1DM, n = 168; T2DM, n = 696) completed SAQ2 and 812 patients (T1DM, n = 160; T2DM, n = 652) completed the PD in the prospective period.
Descriptive baseline characteristics of the South African cohort are shown in Table 1.
Primary endpoints
Any hypoglycaemic episode
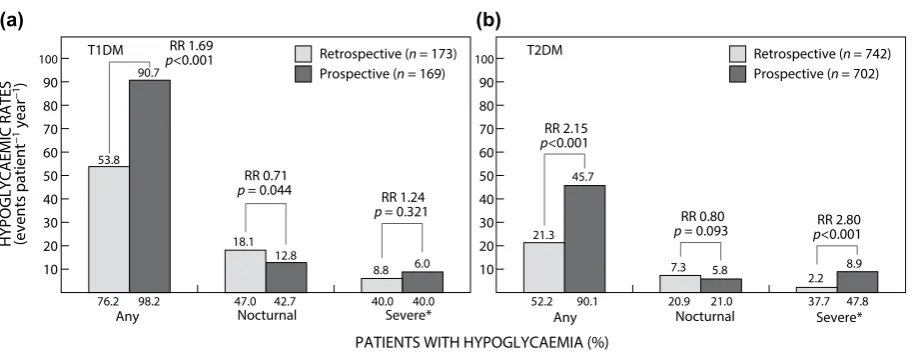
During the prospective period a higher percentage of patients (T1DM 98.2% [95% CI 94.7%, 99.6%]; T2DM 90.1% [95% CI 87.7%, 92.3%]) reported at least one hypoglycaemic event compared with patients (T1DM 76.2% [95% CI 69.1%, 82.3%]; T2DM 52.2% [95% CI 48.6%, 55.9%]) in the retrospective period. In patients with T1DM, the rates for any hypoglycaemia increased from 53.8 events PPY (95% CI 49.9, 57.9) in the four-week retrospective period, to 90.7 events PPY (95% CI 85.5, 96.1) in the four-week prospective period. In patients with T2DM, the rates for any
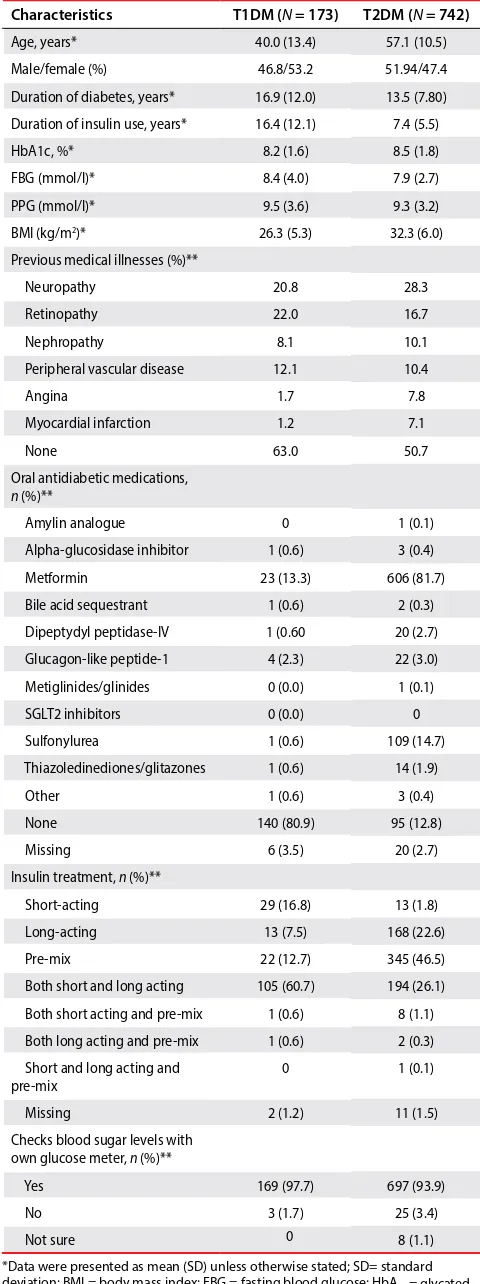
Table 1: Patient demographic characteristics
*Data were presented as mean (SD) unless otherwise stated; SD= standard deviation; BMI = body mass index; FBG = fasting blood glucose; HbA1c = glycated
haemoglobin; PPG = postprandial glucose; N = total number of patients participating; **percentages based on number of patients with evaluable data;
n = number of subjects in the data subset who responded to the set of questions; SGLT2 = sodium-glucose co-transporter-2; T1DM = type 1 diabetes mellitus; T2DM = type 2 diabetes mellitus.
Characteristics T1DM (N = 173) T2DM (N = 742)
Age, years* 40.0 (13.4) 57.1 (10.5)
Male/female (%) 46.8/53.2 51.94/47.4
Duration of diabetes, years* 16.9 (12.0) 13.5 (7.80)
Duration of insulin use, years* 16.4 (12.1) 7.4 (5.5)
HbA1c, %* 8.2 (1.6) 8.5 (1.8)
FBG (mmol/l)* 8.4 (4.0) 7.9 (2.7)
PPG (mmol/l)* 9.5 (3.6) 9.3 (3.2)
BMI (kg/m2)* 26.3 (5.3) 32.3 (6.0)
Previous medical illnesses (%)**
Neuropathy 20.8 28.3
Retinopathy 22.0 16.7
Nephropathy 8.1 10.1
Peripheral vascular disease 12.1 10.4
Angina 1.7 7.8
Myocardial infarction 1.2 7.1
None 63.0 50.7
Oral antidiabetic medications, n (%)**
Amylin analogue 0 1 (0.1)
Alpha-glucosidase inhibitor 1 (0.6) 3 (0.4)
Metformin 23 (13.3) 606 (81.7)
Bile acid sequestrant 1 (0.6) 2 (0.3)
Dipeptydyl peptidase-IV 1 (0.60 20 (2.7)
Glucagon-like peptide-1 4 (2.3) 22 (3.0)
Metiglinides/glinides 0 (0.0) 1 (0.1)
SGLT2 inhibitors 0 (0.0) 0
Sulfonylurea 1 (0.6) 109 (14.7)
Thiazoledinediones/glitazones 1 (0.6) 14 (1.9)
Other 1 (0.6) 3 (0.4)
None 140 (80.9) 95 (12.8)
Missing 6 (3.5) 20 (2.7)
Insulin treatment, n (%)**
Short-acting 29 (16.8) 13 (1.8)
Long-acting 13 (7.5) 168 (22.6)
Pre-mix 22 (12.7) 345 (46.5)
Both short and long acting 105 (60.7) 194 (26.1)
Both short acting and pre-mix 1 (0.6) 8 (1.1)
Both long acting and pre-mix 1 (0.6) 2 (0.3)
Short and long acting and
pre-mix 0 1 (0.1)
Missing 2 (1.2) 11 (1.5)
Checks blood sugar levels with own glucose meter, n (%)**
Yes 169 (97.7) 697 (93.9)
No 3 (1.7) 25 (3.4)
retrospective and four-week prospective periods. Secondary endpoints included the relationship between hypoglycaemia and HbA1c levels, duration of diabetes, type of insulin therapy, patient’s knowledge of hypoglycaemia, fear of hypoglycaemia, patient actions as a result of hypoglycaemia, hypoglycaemia unawareness as a factor and the impact of hypoglycaemia on healthcare utilisation.
Categorisation of hypoglycaemia
Categories of hypoglycaemia recorded in SAQ1, SAQ2, and the PD confirmed that a hypoglycaemic episode was defined as blood glucose (BG) < 3.1 mmol/l not requiring assistance of another person and a severe hypoglycaemic episode as any hypoglycaemic event requiring assistance of another person to administer carbohydrate, glucagon or other resuscitative actions and/or hospitalisation.1 Nocturnal hypoglycaemia is any event occurring between midnight and six o’clock in the morning. A combined measure of any hypoglycaemic episode is the sum of all individual hypoglycaemic events of any category and this was calculated based on PD, SAQ1, and SAQ2 entries.
Statistical analysis
For the primary endpoint, the percentage of patients who experienced at least one hypoglycaemic episode in the four-week prospective periods among insulin-treated patients with T1DM or T2DM was calculated together with 95% confidence interval (CI), with the percentage presumed to predict a binomial distribution. Incidence rates of hypoglycaemia were reported as events per patient-year (PPY), calculated as the total number of events divided by total follow-up time in patient-years together with 95% CI.
Statistical tests were two-sided and regarded as exploratory, with the criterion for statistical significance set at p < 0.05. No adjustments were made for multiple comparisons. No imputation of missing data was performed, as the majority of analyses were descriptive in nature. Baseline refers to data collected using the SAQ1; follow-up refers to data collected using the SAQ2 and, where applicable, the PD.
Results
Demographic and clinical characteristics of study
subjects
A total of 915 patients were enrolled from study sites in South Africa (T1DM, n = 173; T2DM, n = 742) and completed SAQ1. Of these, 864 patients (T1DM, n = 168; T2DM, n = 696) completed SAQ2 and 812 patients (T1DM, n = 160; T2DM, n = 652) completed the PD in the prospective period.
Descriptive baseline characteristics of the South African cohort are shown in Table 1.
Primary endpoints
Any hypoglycaemic episode
During the prospective period a higher percentage of patients (T1DM 98.2% [95% CI 94.7%, 99.6%]; T2DM 90.1% [95% CI 87.7%, 92.3%]) reported at least one hypoglycaemic event compared with patients (T1DM 76.2% [95% CI 69.1%, 82.3%]; T2DM 52.2% [95% CI 48.6%, 55.9%]) in the retrospective period. In patients with T1DM, the rates for any hypoglycaemia increased from 53.8 events PPY (95% CI 49.9, 57.9) in the four-week retrospective period, to 90.7 events PPY (95% CI 85.5, 96.1) in the four-week prospective period. In patients with T2DM, the rates for any
Table 1: Patient demographic characteristics
*Data were presented as mean (SD) unless otherwise stated; SD= standard deviation; BMI = body mass index; FBG = fasting blood glucose; HbA1c = glycated
haemoglobin; PPG = postprandial glucose; N = total number of patients participating; **percentages based on number of patients with evaluable data;
n = number of subjects in the data subset who responded to the set of questions; SGLT2 = sodium-glucose co-transporter-2; T1DM = type 1 diabetes mellitus; T2DM = type 2 diabetes mellitus.
Characteristics T1DM (N = 173) T2DM (N = 742)
Age, years* 40.0 (13.4) 57.1 (10.5)
Male/female (%) 46.8/53.2 51.94/47.4
Duration of diabetes, years* 16.9 (12.0) 13.5 (7.80)
Duration of insulin use, years* 16.4 (12.1) 7.4 (5.5)
HbA1c, %* 8.2 (1.6) 8.5 (1.8)
FBG (mmol/l)* 8.4 (4.0) 7.9 (2.7)
PPG (mmol/l)* 9.5 (3.6) 9.3 (3.2)
BMI (kg/m2)* 26.3 (5.3) 32.3 (6.0)
Previous medical illnesses (%)**
Neuropathy 20.8 28.3
Retinopathy 22.0 16.7
Nephropathy 8.1 10.1
Peripheral vascular disease 12.1 10.4
Angina 1.7 7.8
Myocardial infarction 1.2 7.1
None 63.0 50.7
Oral antidiabetic medications, n (%)**
Amylin analogue 0 1 (0.1)
Alpha-glucosidase inhibitor 1 (0.6) 3 (0.4)
Metformin 23 (13.3) 606 (81.7)
Bile acid sequestrant 1 (0.6) 2 (0.3)
Dipeptydyl peptidase-IV 1 (0.60 20 (2.7)
Glucagon-like peptide-1 4 (2.3) 22 (3.0)
Metiglinides/glinides 0 (0.0) 1 (0.1)
SGLT2 inhibitors 0 (0.0) 0
Sulfonylurea 1 (0.6) 109 (14.7)
Thiazoledinediones/glitazones 1 (0.6) 14 (1.9)
Other 1 (0.6) 3 (0.4)
None 140 (80.9) 95 (12.8)
Missing 6 (3.5) 20 (2.7)
Insulin treatment, n (%)**
Short-acting 29 (16.8) 13 (1.8)
Long-acting 13 (7.5) 168 (22.6)
Pre-mix 22 (12.7) 345 (46.5)
Both short and long acting 105 (60.7) 194 (26.1)
Both short acting and pre-mix 1 (0.6) 8 (1.1)
Both long acting and pre-mix 1 (0.6) 2 (0.3)
Short and long acting and
pre-mix 0 1 (0.1)
Missing 2 (1.2) 11 (1.5)
Checks blood sugar levels with own glucose meter, n (%)**
Yes 169 (97.7) 697 (93.9)
No 3 (1.7) 25 (3.4)
Not sure 0 8 (1.1)
for patients with T2DM. In the four-week prospective period, 40.0% (95% CI 32.3%, 48.0%) of patients with T1DM and 47.8% (95% CI 43.9%, 51.6%) of patients with T2DM experienced at least one severe hypoglycaemic event. The hypoglycaemia rates were 8.8 events PPY (95% CI 7.2, 10.6) for patients with T1DM and 8.9 events PPY (95% CI 8.1, 9.8) for patients with T2DM (see Figure 2).
Secondary endpoints
Hypoglycaemia vs. duration of diabetes
For patients with T2DM, longer duration of diabetes was associated with an overall increase in percentage of patients with any and nocturnal hypoglycaemic events from 88.3% to 89.7% and from 17.7% to 25.5%, respectively, during the prospective period and from 51.1% to 60.5% and from 15.3% to 28.9%, respectively, during the retrospective period. For patients with T1DM, longer duration of diabetes was associated with an overall decrease in percentage of patients with any hypoglycaemic event (from 100.0% to 95.5%) during the prospective period and an overall increase in percentage of hypoglycaemia increased from 21.3 events PPY (95% CI 20.1,
22.5) in the four-week retrospective period, to 45.7 events PPY (95% CI 43.9, 47.5) in the four-week prospective period (Figure 2).
Nocturnal hypoglycaemic episode
In the four-week retrospective period, 47.0% (95% CI 39.2%, 54.9%) of patients with T1DM and 20.9% (95% CI 18.0%, 24.1%) of patients with T2DM experienced at least one nocturnal event. In the four-week prospective period, 42.7% (95% CI 34.8%, 50.8%) of patients with T1DM and 21.0% (95% CI 18.0%, 24.3%) of patients with T2DM experienced nocturnal hypoglycaemia. The hypoglycaemia rate was comparable between the retrospective and prospective periods for patients with T1DM and T2DM (p = 0.044 and p = 0.093, respectively) (see Figure 2).
Severe hypoglycaemic episode
In the six-month retrospective period, 40.0% (95% CI 32.6%, 47.8%) of patients with T1DM and 37.7% (95% CI 34.2%, 41.3%) of patients with T2DM experienced at least one hypoglycaemic event. The hypoglycaemia rates were 6.0 events PPY (95% CI 5.5, 6.6) for patients with T1DM and 2.2 events PPY (95% CI 2.1, 2.4)
(a)
(b)
Figure 2: Percentage of patients and rates of hypoglycaemia during retrospective and prospective periods: (a) T1DM, (b) T2DM. ‘Any’ and ‘Nocturnal’ hypoglycaemia based on four-week period for both retrospective and prospective analyses. *Retrospective data based on six-month period and prospective data based on four-week period. RR = rate ratio; T1DM = type 1 diabetes mellitus, T2DM = type 2 diabetes mellitus.
(a)
(b)
The page number in the footer is not for bibliographic referencing www.tandfonline.com/oemd 10
Incidence of hypoglycaemia among insulin-treated patients with type 1 or type 2 diabetes mellitus 5
four weeks after baseline period compared with the four weeks before baseline period.
A scatter plot with regression line and 95% CI for patients with T1DM or T2DM showed no association between HbA1c levels and hypoglycaemic events (data not shown).
Hypoglycaemia vs. type of insulin used
There were higher reported rates of any and severe hypoglycaemia in patients with both T1DM and T2DM in the prospective period, irrespective of treatment, compared with the retrospective period. On the other hand, rates of nocturnal hypoglycaemia generally decreased in the four-week prospective period compared with the four-week retrospective period in patients with T1DM and T2DM.
The hypoglycaemic rates in the any hypoglycaemia group were highest in patients with T1DM on short-acting regimens during the retrospective and prospective periods. Rates of ‘any’ hypoglycaemia were lowest in patients with T2DM on long-acting insulin regimens during both the retrospective and prospective periods (Figure 5).
patients with any hypoglycaemic event (from 69.4% to 82.9%) during the retrospective period.
For patients with T2DM, there was an overall increase in percentage of patients with severe hypoglycaemia from 40.9% to 45.2% during the prospective period and from 33.1% to 41.4% during the retrospective period in those with a longer duration of diabetes (Figure 3). In contrast, there was an overall decrease in percentage of patients with severe hypoglycaemia in T1DM patients from 48.6% to 36.4% and from 41.7% to 39.1% during the prospective and retrospective periods, respectively, in those with longer duration of diabetes.
Hypoglycaemia vs. HbA
1clevels
There was no association observed between the percentages of patients with any or nocturnal or severe hypoglycaemia and baseline HbA1c during the four weeks before and after baseline periods. For both T1DM and T2DM patients, a higher proportion of patients in the HbA1c > 9.0% category experienced severe hypoglycaemia compared with those with an HbA1c between 7.0% and 9.0%, and HbA1c < 7.0% categories during the four weeks after baseline period (Figure 4). A higher proportion of patients experienced severe hypoglycaemia (Figure 4) in the
(a)
(b)
Figure 4: Percentage of patients with severe hypoglycaemia by baseline HbA1c: (a) T1DM, (b) T2DM. HbA1c = haemoglobin A1C = type 1 diabetes mellitus; T2DM = type 2 diabetes mellitus.
(a)
(b)
Figure 5: Estimated rate of any, nocturnal, and severe hypoglycaemic event during retrospective and prospective period, by insulin regimen in T1DM and T2DM. †Data based on four-week period for both retrospective and prospective analyses; ‡Retrospective data based on six-month period and prospective data based on four-week period. S+L = short-acting and long-acting insulin.
periods were: increased BG monitoring (T1DM/T2DM 49.7%/32.3%; 36.3%/26.6%, respectively), requiring any form of medical assistance (T1DM/T2DM 45.7%/31.7%; 14.3%/15.2%, respectively), and consulting a doctor or nurse (T1DM/T2DM 45.1%/30.5%; 14.3%/14.7%, respectively) (Table 2).
Hypoglycaemia unawareness
A higher proportion of patients had normal awareness, in which symptoms were ‘always’ or ‘usually’ experienced in combination with a low BG measurement and was reported by 66.5% and 43.7% of patients with T1DM and T2DM, respectively. Impaired hypoglycaemia awareness was observed amongst 30.6% of patients with T1DM and 45.8% of patients with T2DM as they were only occasionally aware of symptoms when experiencing a low BG measurement. Severe impairment (defined as never experiencing symptoms when having a low glucose measurement) was seen in 1.2% of the T1DM group and 5.5% of the T2DM group.
Healthcare utilisation
The impact of hypoglycaemic events on the medical system was compared in patients with T1DM vs. T2DM, during the six-month retrospective period and the four-week prospective period. This included telephone contacts with a healthcare team member (14.6%/9.5% vs. 3.1%/4.3%), additional clinic appointments (5.1%/2.9% vs. 0.6%/2.4%) and a hypoglycaemic event leading to Patients with T1DM or T2DM treated with varying insulin
regimens reported varying rates of severe hypoglycaemia, during the retrospective and prospective periods (Figure 5).
Other secondary outcomes
Patient knowledge of hypoglycaemia (before and
after entering the study)
Most patients with T1DM (90.3%) compared with T2DM (73.8%) knew the overall definition of hypoglycaemia before reading the definition in SAQ1. A higher number of patients with T2DM (36.0%) than T1DM (34.1%) defined hypoglycaemia based on symptoms only (Table 2).
Patient fear of hypoglycaemia
The percentage of patients with T1DM or T2DM who rated fear of hypoglycaemia based on a scale is enumerated in Table 2. At baseline, absence of notable differences in mean score (standard deviation) between patients with T1DM or T2DM (5.5 [3.1] vs. 5.1 [3.4], respectively), implied similarity between patients with T1DM or T2DM with regard to fear of hypoglycaemia.
Patient actions as a result of hypoglycaemia
A higher proportion of patients with T1DM compared with T2DM reported taking action following hypoglycaemia. The most common responses during the retrospective and prospective
Table 2: Patient perspectives on hypoglycaemia
*Either symptoms or BG measurement; **Both symptoms and BG measurements; BG = blood glucose; N = total number of subjects participating; #Percentages based on
number of patients with evaluable data; SAQ = self-assessment questionnaire; T1DM = type 1 diabetes mellitus; T2DM = type 2 diabetes mellitus.
Item T1DM (N = 173) T2DM (N = 742)
Knew what hypoglycaemia was at baseline before SAQ1 (%)# 90.3 73.8
Defined hypoglycaemia based on (%)#:
Symptoms only 34.1 36.0
BG measurement only 6.4 8.9
Either* 13.9 8.0
Both** 40.5 32.3
Fear of hypoglycaemia (scale of 0 to 10; %)#
0 = no fear 5.2 14.0
1 5.2 4.0
2 8.7 9.0
3 10.4 9.7
4 10.4 7.7
5 11.0 11.3
6 6.4 6.6
7 9.8 6.7
8 9.8 6.6
9 7.5 4.6
10 = absolutely terrified 13.9 17.8
Patient response to hypoglycaemia (%)# Retrospective (n = 173) Prospective (n = 742) Retrospective (n = 168) Prospective (n = 696)
Consulted their doctor/nurse 45.1 14.3 30.5 14.7
Required any form of medical assistance 45.7 14.3 31.7 15.2
Increased calorie intake 22.4 31.0 24.1 17.7
Avoided physical exercise 7.5 4.2 7.5 5.5
Reduced insulin dose 27.6 26.2 14.6 11.1
Skipped insulin injections 11.6 8.3 8.6 4.7
The page number in the footer is not for bibliographic referencing www.tandfonline.com/oemd 12
Incidence of hypoglycaemia among insulin-treated patients with type 1 or type 2 diabetes mellitus 7
may have received help from their family members when they experienced hypoglycaemia. Diabetes patients unintentionally may have reported these events as severe based on the ADA definition of severe hypoglycaemia.1 This oversight may have led to higher reporting and highlights an additional need for patient education.
The global HAT reported that severe hypoglycaemia rates did not appear to be significantly associated with the HbA1c level in
both T1DM and T2DM (p = 0.211 vs. p = 0.082, respectively).19 In fact, two recent studies have established that the association of HbA1c with hypoglycaemia in T1DM has decreased in recent years, suggesting that risk of hypoglycaemia is common at all levels of glycaemic control.21–23
The majority of patients with T1DM (97.7%) or T2DM (93.9%) in the South African cohort regularly checked blood sugar levels with home glucose monitoring and around half the study population had hypoglycaemic awareness. Furthermore, there was a large difference between the percentage of patients with T1DM and T2DM (90.3% vs. 73.5%, respectively) in terms of patient knowledge of hypoglycaemia before and after entering the study.
These results further strengthen the evidence that management of hypoglycaemic episodes involves increased healthcare costs (both direct and indirect) in the form of increased doctor or nurse consultations, requirement for any medical assistance, and increased frequency of home BG monitoring. This sub-group analysis of the IO HAT study also demonstrates the significant effect of hypoglycaemia on the healthcare system and confirms that hypoglycaemia has a negative impact in diabetes patients.24
The ease with which self-reported hypoglycaemia data are obtained makes such a study less expensive and less invasive in collecting a large amount of data, from a large study population.11 The PD and SAQ2 were used in the prospective period to reduce recall bias, with possible chances of overestimation of rate in the prospective period. The subjective approach of recording a hypoglycaemic episode by either symptoms or BG testing alone, or in combination, may be considered a strength as well as a limitation of the study.
These results demonstrate that hypoglycaemia is under-reported and more widespread than previously believed in both T1DM and T2DM patients in South Africa. Patients reported higher rates of hypoglycaemia (especially severe) during the prospective period. This could potentially be due to recall bias during the retrospective study period.
The results from this sub-group analysis can help eliminate current obstacles to insulin therapy observed in South Africa by educating patients on signs and symptoms of hypoglycaemia and by optimising healthcare resources such that good glycaemic control is achieved with a low risk of hypoglycaemia.
In conclusion, results from this sub-group analysis showed that hypoglycaemia might be under-reported in insulin-treated patients in South Africa. Therefore, it is vitally important to provide continuous medical education programmes to healthcare providers and patients in the African region.
Funding – Novo Nordisk provided financial support for the conduct of the research. Novo Nordisk was involved in the study hospital admission (7.6%/3.6% vs. 3.8%/2.7%). Results showed
that the impact was slightly higher during the six-month retrospective period than in the four-week prospective period (both T1DM and T2DM).
Discussion
This is the first data set of self-reported hypoglycaemia that evaluated hypoglycaemia incidence and rates in insulin-treated patients with T1DM or T2DM in a South African cohort.
Data from this sub-group analysis showed that the percentage of patients who reported at least one hypoglycaemic event was higher during the prospective period of the study than during the retrospective period. It may be use of the PD to record the events in the prospective period that helped improve the recall of events. Similarly, the retrospective data were recorded at baseline by SAQs and may be biased due to failure to recall the events.
In contrast, a higher proportion of patients reported nocturnal hypoglycaemia during the retrospective period than during the prospective period. Patients may have experienced increased fear of nocturnal hypoglycaemia, which might be the reason for a better recall of such episodes in the retrospective period.
This study has shown an increasing rate of any hypoglycaemic event from the retrospective period to the prospective period in patients with T1DM within this sub-group analysis of IO HAT (53.8 events PPY to 90.7 events PPY). The reported rates for this sub-group analysis were much higher than the reported rates from another cross-sectional study with adult T1DM and also higher than the rates from previous observational studies in T1DM or T2DM.15–17
Patients with T2DM within this sub-group of IO HAT also reported increasing rates for any hypoglycaemic event from the retrospective to the prospective period (21.3 events PPY to 45.7 events PPY), which were also much higher than the rates reported in the Veterans Affairs Diabetes Trial and PREDICTIVE trials.16,18
Rates of severe hypoglycaemia in patients with T1DM or T2DM were higher than previously reported rates from RCTs and observational studies, but are aligned with those of the recent global HAT study.19 It has been established that severe hypoglycaemia has an annual incidence of 1.0–1.7 events PPY.20
Overall, higher reporting of hypoglycaemia in the prospective period may be due to the design of the study itself, as study tools like SAQs and PDs reinforced patient knowledge about hypoglycaemia during the prospective period.
A higher percentage (40%) of patients with T1DM experienced at least one severe hypoglycaemic event during both the six-month retrospective period and four-week prospective period. Similarly, a higher percentage of patients with T2DM experienced at least one severe hypoglycaemic event during both the six-month retrospective period and four-week prospective period (37.7% and 47.8%, respectively). It has been established that 30–40% of patients with diabetes experience a severe hypoglycaemic event annually.20
The higher incidences may reflect the real-life scenario of people with diabetes in South Africa. For instance, irrespective of the severity of the symptoms or BG measurements, diabetes patients
8. Haque M, Emerson SH, Dennison CR, et al. Barriers to initiating insulin therapy in patients with type 2 diabetes mellitus in public-sector primary health care centers in Cape Town. S Afr Med J.
2005;95(10):798–80. doi:10.1080/22201009.2005.10872127. 9. Kunt T, Snoek FJ. Barriers to insulin initiation and intensification and
how to overcome them. IJCP Suppl. 2009;164:6–10. doi:10.1111 /j.1742-1241.2009. 02176.x.
10. Gill GV, Huddle KR. Hypoglycaemic admissions among diabetic patients in Soweto. S Afr Diabet Med. 1993;10(2):181–3. doi:10.1111/j.1464-5491.1993.tb00039.x.
11. Emral R, Rudijanto A, Murphy A, et al. Self-reported hypoglycaemia in insulin-treated patients with diabetes: results from an international survey of 7289 patients from nine countries. American Diabetes Association, 76th Annual Scientific Sessions; 2016 Jun 10–14; New Orleans, Louisiana, USA.
12. International Society for Pharmacoepidemiology (ISPE). Guidelines for Good Pharmacoepidemiology Practices (GPP). Initially issued:
1996. Revision 2, April, 2007.
13. World Medical Association (WMA). Declaration of Helsinki - Ethical Principles for Medical Research Involving Human Subjects. 64th WMA General Assembly, Brazil, October 2013.
14. Pedersen-Bjergaard U, Pramming S, Thorsteinsson B. Recall of severe hypoglycaemia and self-estimated state of awareness in type 1 diabetes. Diabetes/Metabolism Research and Reviews 2003;19(3): 232–40. doi:10.1002/dmrr.377.
15. Pedersen-Bjergaard U, Pramming S, Heller SR, et al. Severe hypoglycaemia in 1076 adult patients with type 1 diabetes: influence of risk markers and selection. Diabetes Metab Res Rev. 2004;20:479– 86. https://doi.org/10.1002/dmrr.v20:6
16. Dornhorst A, Luddeke HJ, Sreenan S, et al. Safety and efficacy of insulin detemir in clinical practice: 14-week follow-up data from type 1 and type 2 diabetes patients in the PREDICTIVE European cohort. IJCP. 2007;61:523–8.
17. UK Hypoglycaemia Study Group. Risk of hypoglycaemia in types 1 and 2 diabetes: effects of treatment modalities and their duration. Diabetologia. 2007;50:1140–7.
18. Duckworth W, Abraira C, Moritz T, et al. Glucose control and vascular complications in veterans with type 2 diabetes. N Engl J Med.
2009;360:129–39. https://doi.org/10.1056/NEJMoa0808431
19. Khunti K, Alsifri S, Aronson R, et al. Rates and predictors of hypoglycaemia in 27 585 people from 24 countries with insulin-treated type 1 and type 2 diabetes: the global HAT study. Diabetes Obes Metab. 2016;18(9):907–15. https://doi.org/10.1111/dom.12689
20. Frier BM. The incidence and impact of hypoglycaemia in type 1 and type 2 diabetes. Int Diabetes Monitor. 2009;21:210–8.
21. Elliot L, Aronson R, Galstyan G, et al. Health economic impact of hypoglycaemia in a global population of patients with insulin-treated diabetes. Diabetologia. 2015;58(Suppl. 1):S480 (Abstract 991). Content presented in poster at EASD 2015.
22. Karges B, Rosenbauer J, Kapellen T, et al. Hemoglobin A1c levels and risk of severe hypoglycemia in children and young adults with type 1 diabetes from Germany and Austria: a trend analysis in a cohort of 37,539 patients between 1995 and 2012. PLoS Med. 2014;11(10):e1001742. doi: https://doi.org/10.1371/journal.
pmed.1001742.
23. Lipska KJ, Warton EM, Huang ES, et al. HbA1c and risk of severe hypoglycaemia in type 2 diabetes: the diabetes and aging study. Diabetes Care. 2013;36:3535–42. https://doi.org/10.2337/dc13-0610
24. Shi L, Shao H, Zhao Y, et al. Is hypoglycemia fear independently associated with health-related quality of life? Health Qual Life Outcomes 2014;12:167. https://doi.org/10.1186/s12955-014-0167-3
Received: 31-07-2017 Accepted: 26-09-2017 design; collection, analysis and interpretation of data; and
decision to submit the article for publication.
Competing interests – Author, Mahomed A.K. Omar: given lectures on behalf of, and/or acted as consultant by serving on the advisory boards of Abbot Laboratories, Astra Zeneca, Boehringer Ingelheim, Eli Lily, MSD, Merck, Medtronic, Novo Nordisk, Novartis, Pfizer, Servier, Sanofi Aventis. Author, Shaifali Joshi: speaker fees from Novo Nordisk, Sanofi, Lilly and MSD; participation in advisory boards of Lilly and Novo Nordisk. Author, Makepisi Lesiba Isaac Mashitisho: presentations for Novonordisk and Sanofi Aventis; participation in advisory board of Ryzodec; member of faculty for Advanced Institute of Insulin Management (Sanofi Aventis/deNovo medica). Author, Duma Khutsoane: participation in advisory boards and acted as a consultant for Novo Nordisk, Sanofi Aventis, Elli-Lilly, Boehringer-Ingelheim, Servier. Author, Adri Kok: participation in advisory boards of AstraZeneca, Abbott, BMS, Pfizer, Novartis, Janssen Pharmaceuticals, Boehringer-Ingelheim, Novo Nordisk, Sanofi, Merck, MSD, Lilly, Mundipharma, AdcockIngram, GSK; speaker fees from Astrazeneca, Abbott, AdcockIngram, Boehringer-Ingelheim, BMS, Janssen Pharmaceuticals, Lilly, Novartis, Novo Nordisk, Merck, MSD, Sanofi, Aspen-GSK, Pharmaplan, Pfizer; provided opinion papers to Novo Nordisk, MSD, Astrazeneca, Pfizer; research involvement with Sanofi, Novo Nordisk, Novartis, MSD, Astrazeneca, Pfizer, Amgen.
Conflict of interests – There is no conflict of interests for authors Michael Ramaboea and Louise Johnson.
Authors Verushka Chetty and Levi John Koopman are employees of Novo Nordisk.
ORCID
Mahomed AK Omar http://orcid.org/0000-0002-9568-8500
References
1. Seaquist ER, Anderson J, Childs B, et al. Hypoglycemia and diabetes: a report of a workgroup of the american diabetes association and the endocrine society. Diabetes Care. 2013;36(5):1384–95. https://doi. org/10.2337/dc12-2480
2. National Institutes of Health (NIH). The National Institute of Diabetes and Digestive and Kidney Diseases Health Information Center (NIDDK) [cited 2017 June 5]. Available from: https://www.niddk.nih. gov/health-information/diabetes/overview/preventing-problems/ low-blood-glucose-hypoglycaemia/
3. Bonds DE, Miller ME, Bergenstal RM, et al. The association between symptomatic, severe hypoglycaemia and mortality in type 2 diabetes: retrospective epidemiological analysis of the ACCORD study. BMJ.
2010;340:b4909. https://doi.org/10.1136/bmj.b4909
4. Zoungas S, Patel A, Chalmers J, et al. Severe hypoglycemia and risks of vascular events and death. N Engl J Med. 2010;363:1410–8.
doi:10.1056/NEJMoa100379.
5. McCoy RG, Van Houten HK, Ziegenfuss JY, et al. Increased mortality of patients with diabetes reporting severe hypoglycemia. Diabetes Care. 2012;35(9):1897–901. doi:10.2337/dc11-2054.
6. Bedenis R, Price AH, Robertson CM, et al. Association between severe hypoglycemia, adverse macrovascular events, and inflammation in the Edinburgh type 2 diabetes study. Diabetes Care.
2014;37(12):3301–8. doi:10.2337/dc14-0908.