Copyright © 2011 y Iranian Occupational Health Association (IOHA) b IJOH 3: 1-5, 2011
O
ORRIIGGIINNAALLAARRTTIICCLLEE
Designating Smoking Room to Control
Environmental Tobacco Smoke in Nursing Homes
FARHANG AKBAR-KHANZADEH1*, SAMUEL H. WINDOM1 and FARIDEH GOLBABAEI2
1
Department of Public Health & Preventive Medicine, College of Medicine, University of Toledo Health Science Campus, Toledo, Ohio 43614, USA; 2Department of Occupational Health, Faculty of Health, Tehran University of
Medical Science, Tehran, Iran.
Received May 28, 2010; Accepted October 12, 2010
This paper is available on-line at http://ijoh.tums.ac.ir
ABSTRACT
This study was initiated to assess the effectiveness of designating smoking rooms to control environmental tobacco smoke in nursing homes. Of the 39 nursing homes located in Toledo (a city in Ohio, USA) included in the preliminary survey, 33 facilities (85%) allowed smoking, 14 facilities (36%) allowed indoor smoking, and 13 facilities (33%) provided a designated smoking area. Three of these 13 nursing homes with similar levels of care agreed to participate in study that was more comprehensive. The levels of carbon monoxide, carbon dioxide (CO2), respirable suspended particulate matter, nicotine,
and solanesol were monitored at three locations within three nursing homes: a designated smoking room with an independent ventilation system, the adjacent hallway and outside the building. The concentrations of air contaminants, except CO2, inside the designated smoking rooms were significantly higher than
those in the hallways or outside. The concentration of CO2 was similar in the smoking rooms and the
hallways but significantly higher than the concentration outside. The levels of ambient air temperature or relative humidity within the three locations were not generally different. The results indicated that the designation of a smoking room with an independent ventilation system was effective in controlling the environmental tobacco smoke in these nursing homes.
Keywords:Nursing home, Tobacco smoke, Designated smoking room
INTRODUCTION
Nursing homes often provide a comfortable home-like environment for individuals needing long-term care outside their private dwellings. Some nursing home residents who smoked cigarettes at home continue smoking in the nursing home, a habit potentially exposing both workers and other residents to environmental tobacco smoke (ETS) [ 1]. Nonetheless, prohibiting smoking in nursing homes has raised concerns regarding residents' rights and autonomy [ 2, 3]. Providing nursing home residents with all the comforts of home, including their smoking habit, has
been a subject of debate for nursing home administrators and government officials.
The U.S. Department of Housing and Urban Development (HUD), while implementing non-smoking policies within federally assisted housing, defers guidelines for smoking policies in nursing homes to state or local governments [ 4]. HUD, however, urges nursing homes to strongly regulate smoking in their buildings and provides them with model policies. The U.S. Federal government agencies enforce their mandates when necessary. For instance, a report [ 5] showed that Medicare authorities from the U.S. Department of Health and Human Services imposed a substantial fine against a nursing home after serious safety violations were discovered at the facility; patients
*
Corresponding author: Farhang Akbar-Khanzadeh, Email: farhang.akbar@utoledo.edu
were allowed to smoke in their rooms and around oxygen equipment and flammable devices such as aerosol cans.
Each state government sets its own rules on smoking issues. For example, Chapter 3794 of the Ohio Revised Code [ 6] generally prohibits the smoking and burning of tobacco in enclosed areas of public places and enclosed areas of workplaces. However, designated smoking areas in nursing homes are exempt from the prohibition. Section 3794.03 (D) of the Ohio Revised Code reads
that “Any nursing home [… shall be exempted from the
provisions of the chapter 3794] … only to the extent necessary to comply with the Revised Code. If an indoor smoking area is provided by a nursing home for residents of the nursing home, the designated indoor smoking area shall be separately enclosed and separately ventilated so that tobacco smoke does not enter, through entrances, windows, ventilation systems, or other means, any areas where smoking is otherwise prohibited under this chapter. Only residents of the nursing home may utilize the designated indoor smoking area for smoking. A nursing home may designate specific times when the indoor smoking area may be used for such purpose. No employee of a nursing home shall be required to accompany a resident into a designated indoor smoking area or perform services in such area when being used for smoking.” The Center for Social Gerontology [ 1] suggested a “model policy regulating smoking in nursing homes.” This policy is intended to be a model for state regulation of smoking in Nursing Homes.
Consistent with HUD rules, the most frequently used strategy for controlling ETS in nursing homes is to designate appropriate smoking locations. A survey [ 7] showed that 61% of nursing homes allowed indoor smoking within a designated area. Limiting smoking to specific areas is reasonable and segregating smokers from non-smokers in recreation areas and requiring all smoking to take place in a common area is appropriate.
The information on ETS in nursing homes is very limited. Only a few published reports known to these researchers have examined the issue of smoking in nursing homes. These studies, however, limited their focus to surveying opinions and feelings on issues related to smoking administrator [ 8] or the older residents of nursing homes [ 9], but did not perform actual exposure assessment. This lack of published data on exposure assessment in nursing homes prohibits facilities from making informed decisions on whether the policy of allowing smoking within designated smoking areas is scientifically justifiable and effective. Thus, this study was initiated to collect data in nursing homes to assess the effectiveness of designated smoking rooms in reducing the exposure to other residents and workers.
MATERIALS AND METHODS
Location
Nursing homes across the Toledo area in Northwest Ohio in the U.S.A. were contacted to determine their
smoking policies. Of the 39 nursing homes included in the preliminary survey, 33 facilities (85%) allowed smoking, 14 facilities (36%) allowed indoor smoking, and 13 facilities (33%) provided a designated smoking area. Three of these 13 nursing homes with similar levels of care agreed to participate in the study.
Facility 1, with 250 beds and approximately 140 employees, was a one-story building located between a street, a commercial center, and a residential area. Facility 2, with 150 beds and approximately 200 employees, was a one-story building located in a residential area. Facility 3, with 150 beds and approximately 200 employees, was a two-story building located in a commercial area. In these nursing homes, the levels of air contaminants were monitored (1) in each facility’s designated smoking room (all with an independent ventilation system), (2) in the adjacent hallway, and (3) outside the building in the parking lot.
Direct Reading Measurements
Carbon monoxide (CO) and carbon dioxide (CO2) levels were determined by a direct reading multi-functional indoor air quality monitor (Solomat Model 510e, with CO sensor Model SN385 and CO2 sensor Model 1201GS, Zellweger Analytic, Lincolnshire, IL, USA). The instrument was factory calibrated. The instrument’s sensors were calibrated before each field data collection using a calibration kit (Solomat GSK2). The concentration of respirable suspended particulate matter (RSP) was determined by an Aerosol Monitor (DustTrak Model 8520, TSI Inc., Shoreview, MN, USA) which had been factory calibrated. Ambient temperature and relative humidity (RH) were measured using a Sling Psychrometer (Model 12- 7011, Bacharach Inc., New Kensington, PA, USA). Direct sampling was performed approximately every 15 minutes or 4 times per hour to obtain representative readings for each facility.
In addition, the direct reading instruments were used to measure the characteristics of the ventilation systems in the designated smoking rooms. Ventilation flowrates were determined by measuring the dimensions of air supply inlet and exhaust outlet openings, taking direct measurement of air velocity at those openings, and then multiplying the average air velocity by the surface area of the opening. Air velocity was measured in numerous locations at the face of each of the diffusers and grills by an air quality monitor (Solomat 510e, Zellweger Analytic, Lincolnshire, IL, USA) with a hotwire heated thermistor (Model I29 MSBX) using the recommended practical methods [ 10, 11]. A tape measure was used to determine the dimensions and consequently the surface area of the ventilation inlet and outlet openings. The direction of airflow was determined by observing smoke flow generated by a smoke-tube.
Integrated Air Sampling
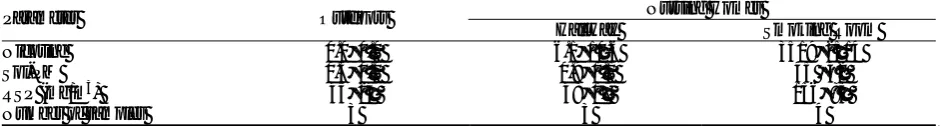
Table 1. Mean ± SD levels of parameters determined by direct reading techniques in 3 nursing homes Nursing Homes Parameter Outdoors
Hallway Smoking Room
CO (ppm) 0.24±0.25 0.42±0.28 1.25±1.10
CO2 (ppm) 256 ±51 481±184 483 ±131
RSP (mg/m3) 0.10 ±0.08 0.10±0.05 0.88 ±0.99
Ambient temperature (oC) 28.3±4.9 25.2±0.8 25.5±0.9
Relative humidity (%) 43±7 46 ±3 45 ±4
Number of samples 14 14 15
SD = standard deviation; RSP = respirable suspended particulate matter
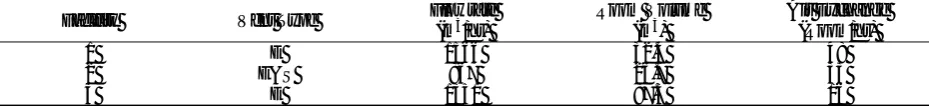
Table 2. Mean ± SD levels (µg/m3) of contaminants determined by integrated sampling in 3 nursing homes Nursing Homes Parameter Outdoors
Hallway Smoking Room
Nicotine 0.0±0.0 6.1±10.6 3519±2514
Sol-PM 0.3±0.0 0.9±1.1 45 ±42
RSP (mg/m3) 45±24 48±17 156±85
Number of samples 3 3 4
SD = standard deviation; Sol-PM = quantity of solanesol (present in the extract) converted to a quantity of environmental to-bacco smoke particles [ 8]; RSP = respirable suspended particulate matter
In general, the CO level in the smoking rooms was higher than the CO level in the hallways or outside the facilities. The highest mean CO concentration was found within the smoking room at Facility 3 (1.96 ppm). The highest readings were obtained during the time of the highest smoking activity. The lowest mean was registered outside Facility I (0.06 ppm). The readings outside Facility 1 were taken in a quiet parking lot that had minimal vehicle traffic compared to the other two facilities where vehicle traffic was more frequent. The CO level in the smoking rooms of Facilities 1 and 3 was significantly higher than those in the hallway or outside. The findings show that the smoking rooms, in general, controlled the air pollutants as intended by design. and the levels of solanesol were measured by using
ASTM method D6271-98 [ 13]. Because solanesol is perhaps the best marker for the particular matter of ETS [ 14, 15], it was measured to estimate the contribution of ETS to the RSP. The quantity of solanesol present in the extract was converted to a quantity of ETS particle (Sol-PM) using a predetermined factor [ 13]. The levels of RSP were determined by comparing the mass difference of the sampling media (filter) before and after sampling. For quality control purposes, in addition to the application of recommended calibration and internal analytical quality control, a field sample blank was also used.
Statistical Methods
The data for each continuous variable was checked for normal distribution assumption (Kolmogorov - Smirnov test). If the data were not normally distributed, the data were transformed with logarithms and then the normality test was performed again. In case the log-transformed data were not normally distributed, nonparametric statistics were used. Descriptive statistics were used to tabulate mean and standard deviation (SD). The t-test was used to determine the differences in the means of two groups (or Mann-Whitney U test in nonparametric cases). Analysis of variance (ANOVA) (Kruskal-Wallis test in nonparametric cases) was used to check for differences among means of more than two groups.
RESULTS
Table 1 summarizes the results of direct air sampling for CO, CO2 and RSP in the three nursing homes. The results of ambient air temperature and RH measurements are also given in Table 1. Except for Facility 2, the RSP levels were significantly higher in the smoking rooms than the RSP levels in the hallway or outside. During RSP data collection, Facility 2 was undergoing a minor remodeling project inside some of the rooms and in the hallways, which may have influences the levels of RSP in this facility.
In Facility 2, an instance of a non-detected level for CO in the smoking room occurred during a time of smoking inactivity. Facility 1 showed higher mean readings of CO2 in the smoking room (654 ppm) and the hallway (708 ppm) than the similar locations in Facility 2 (396 ppm, 398 ppm), and Facility 3 (398 ppm, 343 ppm). In Facility 1, a large nurses' station was in close proximity of the smoking room and the hallway. Higher mean readings of CO2 may be expected since in the confines of a building with a constant ventilation rate, if the number of people (generating CO2) increases, then the level of CO2 is expected to increase. The CO2 levels outdoor for Facilities 1, 2 and 3 ranged from 250 - 333 ppm, 225 - 303 ppm and 192 - 207 ppm, respectively.
In Facilities 1 and 2, the readings of RH were similar in the smoking room, the hallway, and outside. The RH stayed almost constant (40-50%) throughout the investigation, showing that ETS had no measurable effect on the RH in the smoking rooms. The readings at Facility 3 were unique in having three distinct ranges for each location.
Table 3. Ventilation rates in designated smoking rooms of 3 nursing homes
Facility Vent Type Flowrate
(m3/hr)
Room Volume (m3)
Air Exchange (Room/hr)
1 E 1566 32.4 48
2 E&S 867 26.7 33
3 E 1351 87.3 16
E = exhaust, S = supply
than those for its other locations. The indoor and outdoor temperatures were significantly different.
The integrated sampling data found in Table 2 highlight two major points. First, the sample sizes for integrated sampling were small (Mainly 3 samples). Second, in all cases the air pollutants associated with ETS were higher in the smoking rooms than in the hallways or outside. The results show a significant reduction in the levels of pollutants by means of the designated smoking room.
The results of the ventilation system analysis (Table 3) show a relatively high ventilation flowrate in all 3 facilities, with the ventilation systems running almost continuously. Access to the smoking rooms was limited to one door. There was one closed window to the outside in each of the Facilities 1 and 3 and no window in Facility 2. In all three facilities, the direction of airflow (make up air), as determined by smoke test, was noticeable from the hallways toward the smoking rooms.
During the survey, the number of individuals occupying the designated smoking rooms (comprised mostly of smokers but including some nonsmokers) in Facility 2 was 16 (0-3 persons at any given time), in Facility 3 was 43 (0-7 persons at any given time) and in Facility 1 was undetermined, as the number of individuals using the smoking room was not recorded.
DISCUSSION
This study was not designed to discuss whether to allow smoking within an extended care facility; instead, it examines whether or not designating a smoking room is an effective control measure. The results of this study clearly reveal that the designated, ventilated and separate smoking rooms within the 3 nursing homes surveyed significantly (p < 0.05) reduced the levels of certain cigarette smoke components in adjacent spaces. The findings are a starting point for administrators and leaders in the extended care facility industry to discuss the real world effectiveness of designating smoking rooms. Although RSP and carbon monoxide are both byproducts of burning tobacco, they are not specific indicators of ETS. Nonetheless, in this study, the levels of RSP and CO were at their peak in the smoking rooms when the number of smokers was at its peak.
For each facility and for all facilities combined, the CO2 levels outside were significantly lower than those inside the smoking rooms. The mean levels of outside CO2 in Facilities 1 and 2 were 306 and 260 ppm, respectively. These levels are within the range of 250-300 ppm, which is the usual outdoor level of CO2 [ 16]. However, CO2 readings outside these two facilities were
occasionally higher than expected. One explanation is that the measurements were generally performed next to busy streets and parking lots, where active vehicle traffic contributed to the increased levels of this pollutant. In Facility 3, the mean level of outside CO2 was 199 ppm, which is lower than anticipated levels with no obvious explanation. Carbon dioxide is not a specific indicator of ETS -- it is a byproduct of smoking, but it may have contributed to the levels of this air pollutant in the smoking rooms.
The average levels of CO2 did not show any correlation to the ventilation rate. Thus, in the facilities surveyed, smoking did not seem to increase the CO2 levels enough to make a statistically significant difference. Generally, CO2 at the levels typically found within occupied buildings is not the source of health problems [ 17], but CO2 concentration has often been used as an indicator of ventilation efficiency and indoor air quality. In this application, the level of CO2 is compared with 1,000 ppm because the American Society of Heating, Refrigerating, and Air Conditioning Engineers has indicated that a CO2 level exceeding 1,000 ppm implies that the fresh air supply being provided to occupants is not sufficient to dilute the indoor air contaminants [ 18, 19].
In this study, the ventilation flowrate in each facility was assumed enough to keep indoor CO2 concentrations below 1,000 ppm. The ventilation systems in the designated smoking rooms of all 3 facilities proved to be effective in reducing pollutants. Effective ventilation systems could be designed based on this type of real-world exposure assessments to ensure non-smokers and others are not affected by ETS.
In integrated sampling, the levels of nicotine, RSP, and solanesol in the smoking rooms were significantly higher than those in the hallways. Since reports on the results of similar studies, if any, are not known to these researchers, it is not practical to compare the findings of this study to others. Nevertheless, in this study, although the sample size of nursing homes and integrated sampling were relatively small, the outcome of the research clearly showed a significant reduction in pollutant levels by establishing a designated smoking room. This would indicate further studies of larger scale could establish the parameters necessary to maintain this significant difference with respect to ventilation systems and room design.
ventilation systems. Future studies could also investigate worker exposure to ETS in the nursing home settings with personal monitoring of the staff as well as conducting interviews of residents and employees of the nursing homes to survey the feelings of the individuals most closely associated with the issues surrounding ETS.
CONCLUSION
The results of this study suggest that designated smoking rooms with separate ventilation systems performed efficiently to significantly reduce the levels of nicotine, solanesol, and carbon monoxide, indicators of environmental tobacco smoke.
RECOMMENDATIONS
We recommend using thefindings of this or similar studies as a starting point for administrators and leaders in the extended care facility industry to discuss the real world effectiveness of designating smoking rooms.
ACKNOWLEDGEMENTS
The authors declare that there is no conflict of interests. This study has been funded by the Department of Public Health & Preventive Medicine, University of Toledo.
REFERENCES
1. CFSG. Smoke-free policies in facilities serving older persons. The Center for Social Gerontology, Ann Arbor, MI, USA. 2011; Available from: http://www.tcsg.org/tobacco/smokepolicies.htm. 2. Williams L. Resident smoking rights and risks: Nursing Homes.
(January) 2006; Available from: http://www.allbusiness.com/health-care-social-assistance/
nursing/860916-1.html.
3. Adler G, Greenman M, Rickers S, Kuskowski M. Smoking in nursing homes: conflicts and challenges. Social Work Health Care 1997; 25:67-81.
4. Chancellor TL. HUD smoking rules & regulations in nursing home. U.S. Department of Housing and Urban Development.
2011; Available from:
http://www.ehow.com/about_5615702_hud-rules-regulations-nursing-home.html.
5. Rosenfeld J. Feds impose fine against nursing home after dangerous smoking conditions discovered. 2011; Available from: http://www.nursinghomesabuseblog.com/burns/feds- impose-fine-against-nursing-home-after-dangerous-smoking-conditions-discovered/
6. OHC. Ohio's Statewide Smoking Ban. Ohio History Central. Chapter 3794 of the Ohio Revised Code. 2007; Available from: http://www.ohiohistorycentral.org/entry.php?rec=2790.
7. Kochersberger G, Clipp EC. Resident smoking in long-term care facilities - Policies and ethics. Public Health Rep 1996; 111:66-70.
8. Baker J, Lewis D. Smoking policy in long-term care - A survey of administrators in San Francisco. J Health and Social Policy 1998; 10:81-100.
9. Carosella AM, Ossip-Klein DJ, Celia CA, Podgoski C. Smoking history,
knowledge, and attitudes among older residents of a long-term care facility. Tobacco Research J 2002; 4:161-169.
10. ACGIH. Industrial ventilation - A manual of recommended practice. American Conference of Governmental Industrial Hygienists, Cincinnati, Ohio, 1997.
11. ANSI. Method of testing and rating the performance of air outlets and inlets. American National Standard Institute. Report 70-1991. N e w Yo rk , NY , USA, 1991.
12. ASTM. Standard test method for nicotine and 3-ethenylpyridine in indoor air. American Society for Testing and Materials, Method D5075. West Conshohocken, PA, USA, 1996.
13. ASTM. Standard test method for estimating contribution of environmental tobacco smoke to respirable suspended particles based on solanesol. American Society for Testing and Materials. Method D6271. West Conshohocken, PA, USA, 1998.
14. Ogden MW, Maiolo KC. Collection and determination of Solanesol as a tracer of environmental tobacco smoke in indoor air. Environ Science & Technology 1989; 23:1148-1154. 15. Guerin MR, Jenkins RA, Tomkins BA. The chemistry of
environmental tobacco smoke - Composition and measurement. Lewis Publishers Inc., Chelsea MI, 1992. pp75-76, 87-104. 16. Nagda NL, Harper JP (Eds). Design and protocol for
monitoring indoor air quality. American Society for Testing and Materials, Baltimore, MD, 1989 p67.
17. Kreiss K. The epidemiology of building-related complaints and illness - State of the art reviews. Occup Med 1989; 4:575-590. 18. ASHRAE. Ventilation for acceptable indoor air quality.
American Society of Heating, Refrigerating, and Air Conditioning Engineers. Standard 62-1989. Atlanta, GA, USA, 1989.