723
Int. J. Data Envelopment Analysis (ISSN 2345-458X)
Vol.3, No.2, Year 2015 Article ID IJDEA-00325, 13 pages
Research Article
A Model for Prioritizing the Risks
Associated with Road Construction Projects
Based on Generalized Secondary Goal
Javad dehghani
a*,reza kargar
b(a) Department of Mathematics, Arak Branch, Islamic Azad University, Arak, Iran. (b) Department of Industrial Engineering, Qom Branch, Islamic Azad University, Qom, Iran.
Received 25 January 2015, Revised 3 May 2015, Accepted 21 May 2015
Abstract
This paper aims at providing a new model based on Data Envelopment Analysis (DEA) to prioritize project risks. It is clear that the large amounts of involved capitals, the long term of infrastructure projects’ implementation, and the project management problems in on-time completion of projects indicate the necessity of paying particular attention to this issue and conducting applied research in this field. One of the important issues related to risk management is to identify the most appropriate project risks for the aim of adopting an appropriate strategy to manage them. The use of the secondary goal method in cross-sectional AHP/DEA was introduced as a more efficient model to prioritize road construction projects’ risks.
Keywords
:
Risk, efficiency, secondary goal, data envelopment analysis.*
Email address: [email protected]
724
1. Introduction
In the vast country of Iran, due to the dispersion and distribution of population settlement areas, road construction and development, as one of the most important infrastructures, is of particular importance. Therefore, a large amount of capitals are allocated to these projects annually. The most important indicator for the success of these projects, in addition to achieving the intended objectives and cost-effectiveness, is their completion at the expected time.
Risks and uncertainty associated with the projects cause reduced accuracy in the proper estimation of the projects’ objectives thereby reducing their efficiency. Hence, identifying project risks is essential. Identification and classification of risks is the most difficult and important part of the risk management process because, in case of not recognizing the risk, it is omitted from subsequent analyses and no appropriate planning could be done to respond to it. Risk identification process is a continuous activity, the sustainability of which depends on the risks level and project conditions. Getting the experts' viewpoints is considered as the most important step in identifying the risks. However, it is possible to manage the risks effectively to reduce the impact of risks in achieving project objectives. Thus, identification, analysis, and prioritization of risks can be very important to the success of a project. In the initial stages of
the project, the possibility of risk is at the maximum level, but information about the risks of the project is at the least possible amount. This situation does not mean that because we have little information the project should not be continued. However, there are different approaches in dealing with risks. The better understanding of the conditions, the more realistic the project plan and the expectations from the project results [PMI, 2008].
After identifying the risks, it is necessary to determine the importance of each risk in order to prioritize the individual risks for future measures, identify the overall project risks and determine the appropriate responses. Risk assessment can be conducted using qualitative methods such as data accuracy categorization, and evaluation of the measures of risk probability for and impact on the assessment of individual risks, or quantitative methods such as interview techniques to quantify the possibility and risks outcomes for the project objectives, sensitivity analysis, and decision tree analysis, or a combination of both of these methods [PMI, 2009].
725 other risks, reasons or the impact of sharing, etc. for providing a better understanding of the causes or effects of the individual risks. Quantitative methods provide an insight into the combined effects of identified risks for the project output. In these methods, the likelihood and risk impact information at the project level such as the correlation between risks, dependencies, and feedback cycles are considered and thus, the overall risk of the project is shown. Since the project risk assessment is the most important component of risk management, providing a model to identify important risks may assist project managers in reducing their negative effects. The research conducted in this area provided models for the prioritization of risks. But, as time goes on, the problems of each of them were identified, and it was replaced with another alternative. Among the important issues about the presented patterns is ignoring the parameters and the existence of multiple optimal answers. While identifying the risks affecting road construction projects in mountainous areas, the cross-efficiency method was applied using secondary goal function in order to prioritize the risks. Then, the interval matrix obtained from the previous stage was converted to a paired matrix using a mapping and the project risks were prioritized using paired matrix prioritization methods. The research literature, including methods of DEA, paired matrix, and project risk was first examined and the risks breakdown structure
was presented according to the causes. In the process of doing the research, the techniques used to analyze the data were described and the results of field work on the construction project risks were presented according to the model.
2. Basic definitions
Data Envelopment Analysis (DEA)
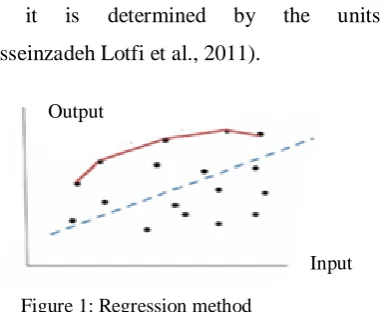
726 form is considered for the production function and it is determined by the units (Hosseinzadeh Lotfi et al., 2011).
Based on previous studies, Charnes, Cooper, and Rhodes introduced CCR for calculating the efficiency of DMUs (Charnes et al., 1978). A DMU is a unit that receives an input vector such as
X
(
x
1,...,
x
m)
(m inputs), and produces an output vector such as)
,...,
(
y
1y
sY
(s output). In the assessment of units, they should be heterogeneous DMUs, i.e. units with the same function produce the same outputs by receiving the same inputs. Now, efforts are made to evaluate the performance ofDMU
o, whereo
{
1
,
,
n
}
. For this reason, if no unit dominating)
,
(
X
oY
o is found, thenDMU
o is called relatively efficient. Otherwise, it is inefficient. Now, the following model which is the input-oriented CCR model is considered:1
1
min
. .
(1)
0,
1,
,
n
j j o
j n
j j o
j j
s t
X
X
Y
Y
j
n
where the envelope form is called input-oriented CCR Model. It can be easily proved that in the optimal solution of model (1), if
1
*
, thenDMU
o will be efficient. Thismodel is always possible, where
0
*
1
. Therefore, if for the optimal solution,
*
1
, then, DM Uo is inefficient. Dual model (1) isthe multiplier form of input-oriented CCR model which is as follows:
max
. .
1
(2)
0
1,
,
0,
0
t o t
o
t t
j j
U Y
s t
V X
U Y
V X
j
n
U
V
where,
U
(
u
1,
,
u
s)
is the dual variables vector corresponding to output constraints and)
,
,
(
v
1v
mV
is the vector of dual variables corresponding to input constraints. Model (2) is always feasible andDMU
o is efficientwhen the optimal solution exists, then
1 *
o
X
V and (U*,V*)0
Paired matrix
Almost all calculations of AHP are conducted based on the initial judgment of the decision maker which appears in the form of paired comparisons matrix, and any errors or inconsistencies in the comparison and evaluation of the importance of options and parameters distorts the final result obtained from the calculations. Inconsistency ratio is a tool that specifies consistency and indicates the extent to which the priorities derived from Output
727 comparisons can be trusted. Maybe it is a simple matter to compare the two options, but when the number of comparisons increases, confidence in the consistency of the comparisons is not easily possible; therefore, consistency ratio should be applied to achieve the necessary confidence. Experience has shown that if the inconsistency ratio is less than 0.10, the comparisons’ consistency will be acceptable; otherwise, the comparisons must be revised.
Project Risk
Project risk is an uncertain event or condition that, in case of happening, adversely affects project goals. In connection with the project, risk is the chance of an adverse event and all its unpleasant consequences. Project risks cause delay in the implementation of projects or make them stop. They also affect the quality and cost of the project (PMI, 2013).
Risks are divided into two main categories of risks external to the project or risks internal to the project based on their condition, i.e. the private sector has the ability to control them or they are uncontrollable and should be managed by the government. In fact, this classification is done based on the source and cause of the risk.
External risks: The underlying cause of these risks is beyond the scope of the project and they are caused by several factors. Some of these risks are associated with macro indicators of the country. The private sector should examine the likelihood of these risks
before deciding to launch the project and make decision about the selection of the related project after assessing the impact of each on the fate of the project, because little or no control can be exercised on them. They are divided into five categories of political, economic, legal, cultural, and social impact and force majeure risks based on the scope of the risks.
Political risks: These risks are associated with domestic and international political conditions and government stability. They also illustrate the capabilities or request of government to attract private investments to the infrastructure projects. Failure to properly manage these risks excludes each type of investment.
Economic risks: They are uncertainties in the macroeconomic indicators of the country which are related to the project costs and revenues and are associated with the cases such as inflation rate. Inaccuracy in predicting these risks will lead to failure in financing the project, or at least, increase in the costs. Legal risks: They deal with the potential problems arising from contractual arrangements and legal frameworks in which the project is performed. The presence of multiple factors and different contracts between them is associated with many implications causing the blockage of the project due to any ambiguity in the rules.
728 as ethnic and regional restrictions, the absence of a collective satisfaction, working conditions of local contractors, etc. Since the route of road construction projects in mountainous regions passes mainly from rural and urban areas, attention should be paid to this issue.
Force majeure risks: Due to the fact that the country is highly risk-prone, most projects are at the risk of natural disasters. Of course, the weather conditions specific to mountainous regions slow down the trend of project implementation in some parts, and, in some cases, have led to project termination. The unexpected events, which are beyond the control of the project, are also among this type of risks.
Internal risks of the projects: In addition to the preparation of the project environment before project implementation, there are risks in the project which refer to the technical issues of the project. These risks are project-specific, and unlike the external risks, they are controlled by the private sector. Internal risks of the project include developmental risks (project preparation) according to the project cycle, financial risks, design risks, construction and completion risks, and the risks involving organizational and project management.
Developmental risks (project preparation):
Following the government decision to undertake the project, the first phase is project preparation. Land acquisition for project implementation is very critical and one of the
risks that the project will face is the risk of failure to resolve the conflicts.
Financial risks: Risks that threaten the project financing and costs fall into this category. Anything that endangers the anticipated revenue makes the project financing more difficult or increases the costs.
Design risks: Project design in high capacity with its specific complexities could be followed by design problems such as uncertain conditions, lack of experience in the field of designing road construction projects and changes in the design.
Risks of construction and completion of the project: They are related to the probability of the failure to complete the project or leave it half-finished.
Organizational and project management risks: Given the extent of the financial and administrative aspects of project construction, project management in these types of projects are more complex than regular projects. Therefore, due attention should be paid to this issue.
3. Research model
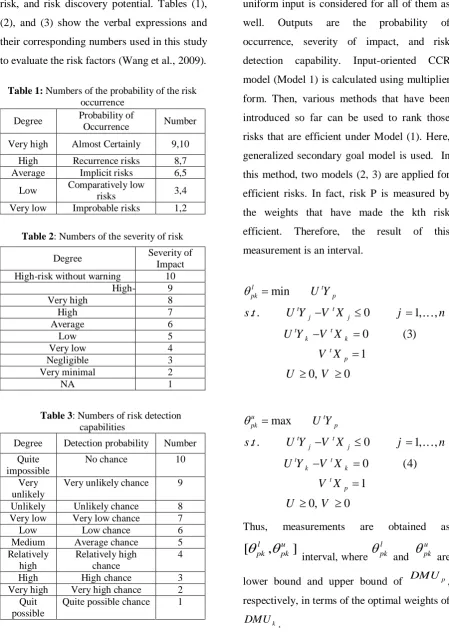
729 3 factors of risk probability, the severity of risk, and risk discovery potential. Tables (1), (2), and (3) show the verbal expressions and their corresponding numbers used in this study to evaluate the risk factors (Wang et al., 2009).
Table 2: Numbers of the severity of risk Severity of
Impact Degree
10 High-risk without warning
9
High-risk with warning 8 Very high 7 High 6 Average 5 Low 4 Very low 3 Negligible 2 Very minimal 1 NA
Table 3: Numbers of risk detection capabilities Number Detection probability Degree 10 No chance Quite impossible 9 Very unlikely chance
Very unlikely 8 Unlikely chance Unlikely 7 Very low chance
Very low 6 Low chance Low 5 Average chance Medium 4 Relatively high chance Relatively high 3 High chance High 2 Very high chance
Very high
1 Quite possible chance Quit
possible
Each risk is considered as a single DMU and a uniform input is considered for all of them as well. Outputs are the probability of occurrence, severity of impact, and risk detection capability. Input-oriented CCR model (Model 1) is calculated using multiplier form. Then, various methods that have been introduced so far can be used to rank those risks that are efficient under Model (1). Here, generalized secondary goal model is used. In this method, two models (2, 3) are applied for efficient risks. In fact, risk P is measured by the weights that have made the kth risk efficient. Therefore, the result of this measurement is an interval.
min
. .
0
1,
,
0
(3)
1
0,
0
l t pk p t t j j t t k k t pU Y
s t
U Y
V X
j
n
U Y
V X
V X
U
V
max
. .
0
1,
,
0
(4)
1
0,
0
u t pk p t t j j t t k k t pU Y
s t
U Y
V X
j
n
U Y
V X
V X
U
V
Thus, measurements are obtained as
[
pkl,
pku]
interval, where l pk
and u pk
are lower bound and upper bound of DMUp,respectively, in terms of the optimal weights of
k
DMU . Table 1: Numbers of the probability of the risk
730 Then interval matrix is converted to a t-matrix using the following interval metric mapping:
2 2
([ , ]) ( ) / 3 (5) Index a b a b ab
In the next step, t-matrix is converted to a paired matrix using the following mapping: Of course, this matrix is not expected to be a consistent one.
, exp( 0.5 )
(6) ij
i j t
ij ij
Index P
Index Index
Therefore, if the inconsistency ratio is low, the eigenvalues method can be used to calculate the final weights.
4. Case study
In order to prepare an initial list of potential risks affecting construction projects in the mountainous areas of the country, the results of previous research in the field of construction project risks were first collected, and then the collected list consisting 50 risks in the road construction projects capable of affecting the objectives of road construction projects was reviewed in terms of comprehensiveness, relevance, and influence using the Delphi method and through obtaining the viewpoints of 9 experts including the employer – Consultant Engineers of Construction Projects Contracting and Investment Companies.
Some items were omitted and some other suggested items that were missing were added to the list. For the final identification of risks,
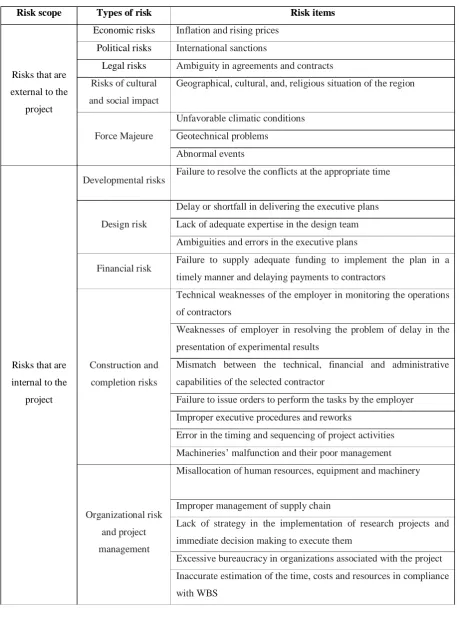
in a meeting attended by 7 directors and authorities of construction projects, a list consisting 24 risks was finally identified. The breakdown structure of the identified risks is shown in Table 5.
731
Table 4: Breakdown structure of the construction projects risks in mountainous areas
Risk scope Types of risk Risk items
Risks that are external to the
project
Economic risks Inflation and rising prices
Political risks International sanctions
Legal risks Ambiguity in agreements and contracts Risks of cultural
and social impact
Geographical, cultural, and, religious situation of the region
Force Majeure
Unfavorable climatic conditions
Geotechnical problems
Abnormal events
Risks that are internal to the
project
Developmental risks Failure to resolve the conflicts at the appropriate time
Design risk
Delay or shortfall in delivering the executive plans
Lack of adequate expertise in the design team
Ambiguities and errors in the executive plans
Financial risk Failure to supply adequate funding to implement the plan in a timely manner and delaying payments to contractors
Construction and
completion risks
Technical weaknesses of the employer in monitoring the operations
of contractors
Weaknesses of employer in resolving the problem of delay in the
presentation of experimental results
Mismatch between the technical, financial and administrative
capabilities of the selected contractor
Failure to issue orders to perform the tasks by the employer
Improper executive procedures and reworks
Error in the timing and sequencing of project activities
Machineries’ malfunction and their poor management
Organizational risk
and project
management
Misallocation of human resources, equipment and machinery
Improper management of supply chain
Lack of strategy in the implementation of research projects and
immediate decision making to execute them
Excessive bureaucracy in organizations associated with the project
Inaccurate estimation of the time, costs and resources in compliance
732
Table 5: The breakdown structure of the risks associated with road construction projects in mountainous areas
Code Project risks
Probability of the occurrence
Severity of impact
Detection
capability Efficiency
Risk 1
Failure to supply adequate funding to implement the plan in a timely manner
and delaying payments to contractors
8.17 7.67 6.00 1.0000
Risk 2 Unfavorable climatic conditions 7.92 7.05 4.04 0.9616
Risk 3 Excessive bureaucracy in organizations
associated with the project 3.69 4.86 5.47 0.6905
Risk 4
Immediate decision making and lack of strategy in the implementation of research
projects
3.51 9.04 7.05 1.0000
Risk 5 Error in the timing and sequencing of
project activities 3.51 9.04 7.05 1.0000
Risk 6 Machineries’ malfunction and their poor
management 7.74 6.97 3.10 0.9414
Risk 7 Ambiguities and errors in the executive
plans 7.28 6.05 2.37 0.8824
Risk 8 Geographical, cultural, and religious
situation of the region 4.74 6.44 6.70 0.8769
Risk 9 Poor management of existing problems in
line with the progress of the project 6.02 7.13 5.05 0.8836
Risk 10 Improper executive procedures and
reworks 6.28 5.95 5.68 0.8300
Risk 11 International sanctions 5.76 6.08 7.02 0.9182
Risk 12 Inaccurate estimation of the time, costs
and resources in compliance with WBS 5.87 6.12 4.98 0.7895
Risk 13
Geotechnical problems such as landfalls or landslides and reduction in the levels of
groundwater
4.25 7.10 6.86 0.9078
Risk 14 Delay or shortfall in delivering the
executive plans 4.86 6.67 8.44 1.0000
Risk 15
Mismatch between the technical, financial and administrative capabilities of the
selected contractor
7.69 6.17 4.95 0.9321
Risk 16 Lack of adequate expertise in the design
team 4.52 5.88 7.39 0.8889
Risk 17 Technical weaknesses of the employer in
monitoring the operations of contractors 4.02 6.58 6.17 0.8319
Risk 18 Inflation and rising prices 7.83 7.12 6.77 1.0000
Risk 19
Weaknesses of employer in resolving the problem of delay in the presentation of
experimental results
4.98 5.34 3.65 0.6755
Risk 20 Lack of coordination with relevant
organizations 7.28 6.03 3.59 0.8824
Risk 21 Improper management of supply chain 6.90 3.87 4.67 0.8364 Risk 22 Misallocation of human resources,
equipment and machinery 6.03 6.65 4.80 0.8363
Risk 23 Abnormal events (human) 4.56 6.86 7.16 0.9224
Risk 24 Failure to resolve the conflicts at the
733 Here, risks 1, 4, 13, 18, and 24 were considered as serious obstacles in carrying out specific projects. Now, the interval matrix is calculated for these 5 risks using the method mentioned in the previous section
.
For the above paired matrix, the consistency index, equal to 0.002, indicates very low inconsistency calculated using eigenvalues and final ranking methods:
R24 R18
R13 R4
R1 Risk
0.2023 0.1948
0.2054 0.1978
0.2004 Weight
Second Fifth
First Fourth Third
Rank
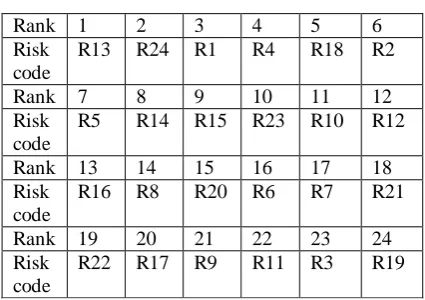
Therefore, it can be said that the final ranking table is as follows:
Then, the following paired matrix is calculated using the interval mapping.
6 5 4 3 2 1 Rank
R2 R18 R4
R1 R24 R13 Risk code
12 11 10 9
8 7 Rank
R12 R10 R23 R15 R14 R5
Risk code
18 17 16 15 14 13 Rank
R21 R7
R6 R20 R8
R16 Risk code
24 23 22 21 20 19 Rank
R19 R3
R11 R9
R17 R22 Risk code
734 5. Conclusions
The major risks affecting road construction
projects in the mountainous areas of the
country were identified and rated using the
research model. In prioritizing the risks based
on the research model, risks of geotechnical
problems and failure in resolving conflicts at
the right time were identified as the main risks.
The third risk (in terms of the importance) is
the risk of failure to provide adequate funding
to implement the plan in a timely manner and
delaying payments to contractors. The risks of
the lack of strategy and inflation are the next
priorities.
Therefore, acknowledging that the secondary
goal method in DEA has not been provided for
prioritizing construction yet, it seems that this
research is unique in its kind in terms of
application. However, with conducting field
studies and adding independent risks, better
results can be achieved in future studies.
The advantages of using the model presented in this paper can be stated as follows:
1. This technique was able to evaluate several factors in a combined assessment, even if the factors have different units of measurement. 2. It performs a more realistic assessment, because inefficient DMUs have not been evaluated inefficient due to being compared with a predetermined specific standard or a specific function. However, their evaluation criteria were other units that have worked with them in relatively the same conditions. Finally, it is suggested that the executive style of
conducing this study can be used as a model for similar research in construction projects and be a source of many benefits.
Reference
[1] Charnes A et al.(1978). Measuring the efficiency of decision making units، European Journal of Operations Research, 2, pp. 429– 444.
[2] Jahanshahloo, G.R. and Hosseinzadeh Lotfi, F. and Jafari, Y. and Maddahi, R.(2011). Selecting symmetric weights as a secondary goal in DEA cross-efficiency evaluation. Applied Mathematical Modelling, 35. 544– 549.
[3] Hosseinpour.S, Pour Mahmoud.J , Masrouri.N .(2013). Using Cross Efficiency with Symmetric Weights for the Method DEAHP. Journal of Educational and Management Studies ,vol.3(4) , pp. 384-389. [4] Hosseinzadeh Lotfi.F , Jahanshahloo.G.R , Zamani.P .(2011). A new ranking method based on cross-efficiency in data envelopment analysis . African Journal of Business Management ,Vol. 5(19), pp. 7923-7930. [5] Project management Institute Standard Committee.(2009). Practice Standard for project Risk management. Pennsylvania, USA: Newtown Square.
[6] Project management Institute Standard Committee.(2008). A guide to the project management body of knowledge. Pennsylvania, USA: Newtown Square.
735 knowledge. Pennsylvania, USA: Newtown Square..
[8] Sadeghi Gavgani.S, Zohrehbandian.M , Khorram.E.(2013).Secondary Goal in DEA Cross Efficiency Evaluation . Journal of Basic and Applied Scientific Research, vol. 3(7), pp.235-240.
[9] Sexton, T.R., Silkman, R.H., Hogan, A.J.(1986). Data Envelopment Analysis. Jossey-Bass, San Francisco .
[10] Tohidi.G ,Khodadadi. M,Rostamian.E. (2013).Improving the Selection Symmetric Weights as a Secondary Goalin DEA Cross-E_ciency Evaluation . International Journal of Mathematical Modelling & Computations ,Vol. 03, No. 02, PP.149 – 155.