ISSN 0975-928X
Research Article
Identification, Characterization and Mapping of QTLs related to Grain Fe,
Zn and Protein Contents in Rice (
Oryza sativa L.
).
Atul B. Indurkar, Sanjay K Majgahe, Vikrant K. Sahu, Ashish Vishwakarma, Vinay Premi, Pankaj Shrivastatva, Mahima Dubey and GirishChandel*
Department of Plant Molecular Biology and Biotechnology, College of Agriculture, Indira Gandhi KrishiVishwavidyalaya, Raipur, 492012, CG India.
*Email:ghchandel@gmail.com
(Received:13th Oct 2015 ; Accepted: 10th Jan 2016)
Abstract
The improvement of grain quality, such as Zn/Fe and grain protein content has been a major concern of rice breeders. In the present study, grain zinc (Zn), iron (Fe) and protein contents were analyzed in 60 F7 Recombinant Inbred Lines (RILs)
derived from Swarna X Moroberekan cross to detect quantitative trait loci (QTLs) and their interactions. The analysisi of 20 polymorphic SSR markers showed 4 QTLs on chromosomes 1, 10, 6, significantly linked to iron and protein. Results revealed that QTL’s for grain protein content (qgpc-1) on chromosome 6 and (qgpc-2) and (qgpc-3) on chromosome 10 and one QTL’s for Fe content in rice grain are identified (qFe1.1) on chromosome 1. Three markers were associated to Zn content in rice grain on chromosome 2,3 and11. The flanking markers for grain zinc and protein content can be further used in maker assisted selection for advanced breeding line in biofortification programs.
Key words
Micronutrients, Protein, QTLs, Rice, SSR,
Introduction
Rice is the primary or secondary staple food for 50% of the world's population. In countries where rice is used as staple food, the per capita consumption is very high ranging from 62 to 190 kg/year (Chandel et al., 2011; Graham et al., 1999). However, rice is a poor source of essential micronutrients such as Iron (Fe) and Zinc (Zn) (Bouis and Welch, 2010). Biofortification has emerged as one possible solution to alleviate malnutrition and the development of new cultivars with elevated concentration of Fe and Zn would be extremely useful (Zimmermann and Hurrell, 2002). Over 40% of the world’s population, especially women and children, mainly in developing nations who live on staple crops, are suffering from deficiencies of key micronutrients, e.g., iron (Fe), zinc (Zn), iodine, selenium, and vitamin A (Liu et al., 2006; Welchand Graham, 2004).. Biofortification is the most economical and sustainable strategy to alleviate micronutrient malnutrition (Whiteand Broadley, 2005). For grain Fe and Zn content (Brar et al., 2011; Gregorio et al., 2000). About 11, 400 rice samples of brown (unpolished) and milled rice were evaluated for Fe and Zn during 2006–2008 by Martínez et al. (2010). It was found that brown rice had 10–11 ppm Fe and 20–25 ppm Zn while milled rice had 2– 3 ppm Fe and 16–17 ppm Zn. It has been estimated that more than 70% of micronutrients are lost during polishing (Sellappan et al., 2009). It is suggested that the rice based diet should contain 14.5 ppm Fe (Johnson et al., 2011) and 24 ppm Zn (http://www.harvestplus.org/content/zinc-rice-india). Several Quantitative Trait Loci (QTLs) for
ISSN 0975-928X
polymorphism (Vieux, et al., 2002) are presently available to assess the variability and diversity at molecular level (Joshi et al., 2000).
Recently, QTL analyses for micronutrient concentration have been conducted on wheat (Genc
et al., 2009; Shi et al., 2008) and related species (Peleg et al., 2009; Tiwari et al., 2009). In the present study, grain Zn, Fe and protein contents were investigated in a recombinant inbred line (RIL) population under field condition over two years to (i) detect QTLs with additive (a) and additive ×additive (aa) epistatic effects, as well as their environmental interactions (ae and aae), and to (ii) identify molecular markers which may be useful in MAS breeding.
Materials and methods
Plant material:A F7 population of sixty recombinant
inbred lines (RILs) was derived from the cross between Swarna X Moroberekan using single seed descent method was used for the present study of QTL identification. RILs were grown in IGKV field during monsoon season 2013 for current study.
Experimental design and phenotyping for quality trait:The experiment was conducted at farm cum research station of Plant Molecular Biology and Biotechnology Department of Indira Gandhi Krishi Vishvidhylaya, Raipur, Chhattisgarh. A total of 60 recombinant inbreed lines and their parents were raised in a Randomized Block Design with two replications. To avoid the border effect, all the single panicle from single plant from middle of row were collected and harvested (IRRI, 2002).
After harvesting, 200gm grain of each genotype was sampled from each replication for iron, zinc and protein estimation. To ensure the consistency in micronutrient and protein estimation, grain of each replication was analyzed. The method used for grain Fe, Zn and protein contents are as follows.
Processing of rice grains: Before analyzing for iron, zinc and protein contents, rice seeds samples of all the 60 recombinant inbreed lines as well as both the parents were subjected to dehusking and seed separation. Around 200 grams of each seed sample were hand dehusked using polyurethane coated hand dehusker to avoid metal contamination (Figure 1).
Estimation of protein: Total protein content of brown rice grains of all samples was estimated by modified micro-Kjeldahl method (Johri et al.,
2000). About 0.5 gm of rice grains were digested at 400 ºC in the presence of concentrated Sulphuric acid, K2SO4 and CuSO4 followed by distillation by
Pelican make distillation unit using 4% Boric acid
and 40% Sodium hydroxide. The distilled samples were titrated against the 0.05 N Sulfamic acid until the first appearance of violate color as the end
point. The titer value was used to calculate percent Nitrogen, which is then used to estimate total protein content by using conversion factor 5.95 (Julliano, 1993).
Protein % = % N X 5.95.
Estimations of Iron and Zinc:Whole brown rice grains were subjected to di acid mixture based digestion in triplicate with tomato leaf powder used as a standard in each batch of digestion to establish accuracy of digestion. The iron and Zinc contents were estimated by using standard method described under Harvest Plus, (2006) guidelines using Atomic absorption spectrophotometer (AAS200). About 0.5 gm of brown rice grains sample of each rice genotype incubated overnight in presence of di-acid mixture of HNO3 and HCl in 4.5:1 ratio for
predigestion followed by 15 min digestion with microwave digestion chamber (CEM-MARS equipment) at 180°C. The colorless aliquots of this solution were used for determination of Fe and Zn using atomic absorption spectrophotometer (Perkin Elmer AAnalyst, 200) with HNO3 and HCl in 4.5:1
ratio took as blank. The ppm (parts per million) value of Fe and Zn calculated by using following formula:
Concentration in ppm =
𝐒𝐚𝐦𝐩𝐥𝐞 𝐂𝐨𝐧𝐜.−𝐁𝐥𝐚𝐧𝐤 𝐂𝐨𝐧𝐜. 𝐱 𝐃𝐢𝐥𝐮𝐭𝐢𝐨𝐧 𝐟𝐚𝐜𝐭𝐨𝐫 𝐒𝐚𝐦𝐩𝐥𝐞 𝐰𝐞𝐢𝐠𝐡𝐭 (𝐠𝐦)
Statistical analysis :The data obtained in present study was statistically analyzed using randomized block design (RBD) for six agronomical traits and grain Fe, Zn and protein content of selected RILs.
QTL mapping:Leaf sample was collected from five plants in the middle row and bulked for DNA isolation by using CTAB method. A total of 50 randomly selected SSR markers, 17 SSR markers previously study of Sarla et al., (2012) selected based on phenotypic variance, 11 SSR markers within QTL’s previously reported by Chandel et al., (2007) and 10 gene specific markers were used for the identification of polymorphic loci between two parents Swarna and Moroberekan and 60 recombinant inbreed lines. Linkage groups were determined using ‘group’ command with a LOD score of 2.5 and a recombination fraction of 0.5. The order of the markers for each group was determined using ‘order’ and ‘ripple’ commands. QTLs were identified using QTL Cartographer 2.5 with a threshold LOD of 2.5 and 0.05 significant. %
Nitrogen =
(Vol. of Sulfamic acid – Vol. of blank) x Normality x 14 x 100)
ISSN 0975-928X
QTLs for iron and zinc were identified using 2 models Single Marker Analysis (SMA), Composite Interval Mapping (CIM)
Results and discussion
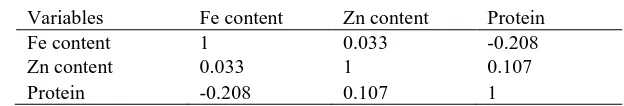
Trait performance and frequency distribution: The performance on parents and minimum and maximum trait value of RIL’s at two replications is shown in Table 1. Higher phenotypic variation was observed for grain Zn content. All traits were approximately normally distributed (Figure 2). The correlation study showed that Fe and Zn showed low level of correlation with each other whereas Fe was negatively correlated with grain protein content as shown (Table 2).
The ANOVA was performed for grain Fe, Zn and protein content following RBD analysis (Table 3). An important significant difference was observed for these traits between RILs. The coefficient of variation was highest 12.59% for Fe content and lowest 2.88% for grain protein content and 5.65% for Zn. Panicle length 8.80%, total tillers/plant 19.645%, productive tillers/plant 23.61%, were recorded.
Identification of polymorphic loci between parents: A total of 100 randomly selected SSR markers, including previously reported QTL specific marker (17 SSR markers from Sarla et al., 2012 selected based on phenotypic variance and 11 SSR markers reported by Chandel et al., 2007). Beside, 10 gene specific markers were used to identify polymorphic loci between two parents Swarna and Moroberekan.
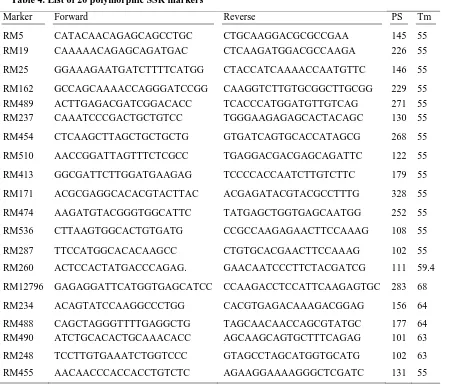
Out of 88 markers, only 20 markers were found to be polymorphic giving only 14.5% overall polymorphism. All 60 RILs were further genotyped using 20 polymorphic SSR markers as shown in Table 4 and figure 3.
QTL Analysis for Grain Fe, Zn and Protein content: Single Marker Analysis:Single marker analysis revealed that out of 20 polymorphic SSR markers, three marker RM12796 on chromosome 2, RM2489 on chromosome 3, RM287 on chromosome 11 significantly showed association with grain zinc content with a phenotypic variation of 15, 4, and 11%, respectively among the RIL population (Table 5). No significant association was found for grain Fe and protein content. Similarly Sarla et al. (2012) reported six QTL for grain zinc content showing >30% phenotypic variance and Amerada et al. (2012) reported phenotypic variance in grain iron content with 69 to 71% variability (OsYSL1 and OsMTP1) and with zinc content of 29 to 35% variability (OsARD2, OsIRT1, OsNAS1 and OsNAS2). Grain zinc content associated SSR markers (RM152, RM263 and RM21) with 6.1 to 11.7% phenotypic variability were reported by Berhanu et al. (2013).
Nagesh et al. (2013) reported similar results from F2 population of grain iron and zinc content
(OsZIP1) with 13.09 and 19.51% variability, respectively. Although some of the markers used in the study were common but none of the previous studied markers were common in the list of associated markers may be due to the different genetic background. Validation of these associated markers in next generation will confirm the reproducibility of usefulness of these markers. These markers can be further used in maker aided selection for zinc biofortification programs.
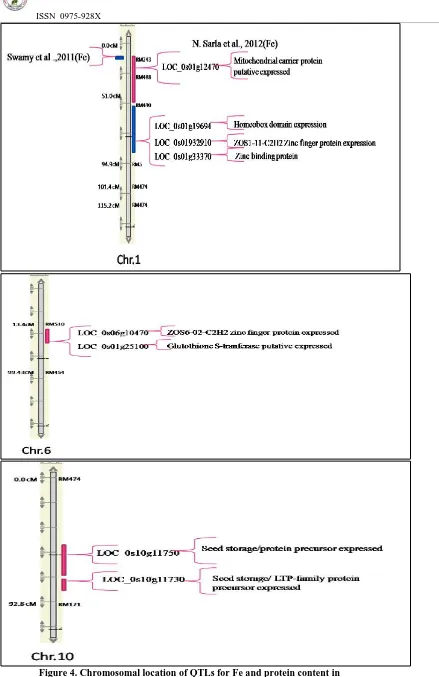
Composite Interval Mapping (CIM):The analysis of CIM detected 1 QTL for grain Fe content and 3 QTL’s for grain protein content (Table 6). There is no QTL detected for Zn content. Details of QTLs with their flanking markers, position, LOD score, additive effect, phenotypic variance (R2) are given in Table 6. The results showed that phenotypic variation explained by these QTLs was ranging from 30% to 73%. The highest phenotypic variance was explained by QTL for qgpc-2 on chromosome 10 (73%) and for Fe on chromosomes 1 (39%). Allelic effect of QTL s of grain protein content is Moroberekan type whereas for Fe content it is Swarna type identified by using graphical genotyping software. The location of each QTL mapped using CIM is shown in Figure 4.shows the relative position of identified QTL for grain Fe content and protein content in rice chromosomal position in comparisons to previously identified grain Fe contents QTLs by Sarla et al., (2012) and Swami et al., (2011). Although the chromosomal location of two QTLs was similar between the identified and previously reported QTLs, but showed more variation in their size. Rest of other QTLs lie in the chromosome 5, 7 and 12. Size of previously reported QTLs was ~5cM whereas our reported QTL was ~44cM long. This variation shows that more number of marker should be required to find out more closely linked flanking markers. Also in silico mining was done for both the QTL region in order to find out the metal related candidate genes and revealed that both the regions comprised of metal related genes which includes ZOS6-02-C2H2 zinc finger protein
expressed, Seed storage/protein
ISSN 0975-928X
One QTL was identified for grain Fe and 3 QTL’s for grain protein content with LOD score more than 3. The phenotypic variance ranged for these QTLs were 39 (for Fe) and 70-73 (for grain protein). Genes with a possible role in increasing Fe, Zn and protein contents underlying these QTLs were also mined insilico within these QTLs. QTLs identified for grain Fe content underlying the metal related candidates gene and grain protein QTLs contain the seed storage protein.
Acknowledgment
The financial support provided by DBT, Ministry of science and technology, Govt. of India, New Delhi is gratefully acknowledged.
References
Ahn S N, Bollich C N, McClung A M, Tanksley S D. 1993. RFLP analysis of genomic regions associated with cooked-kernelelongation in rice. Theor Appl Genet, 87: 27−32.
Albani, M. C. and M. J. Wilkinson. 1998. Inter simple sequence repeat polymerase chain reaction for the detection of somaclonal variation. Plant Breeding, 117: 573-575.
Ana Luisa Garcia-Oliveira, Lubin Tan, Yongcai Fu and Chuanqing Sun. Genetic Identification of Quantitative Trait Loci for Contents of Mineral Nutrients in Rice Grain. Journal of Integrative Plant Biology 2009, 51 (1): 84–92
Anuradha, K., Surekha Agarwal, Y. Venkateswara Rao, K.V. Rao, B.C. Viraktamath, N. Sarla. Mapping QTLs and candidate genes for iron and zinc concentrations in unpolished rice of Madhukar×Swarna RILs. Gene 508 (2012) 233–240. Directorate of Rice Research, Hyderabad, India.
Becker, J., P. Vos, M. Kuiper, F. Salamini and M. Heun. 1995. Combined mapping of AFLP and RFLP markers in barley. Mol. Gen. Genet., 249: 65-73.
Blair, M. W., O. Panaud and S. R. McCouch. 1999. Inter simple sequence repeat (ISSR) amplification for analysis of microsatellite motif frequency and fingerprinting in rice (Oryza sativa L.).
Theor. Appl. Gent., 98: 780-792.
Cagampang, G.B., Cruz, L.J., Espiritu, S.G., Santiago, R.G., Juliano, B.O.,1966. Studies on the extraction and composition of rice proteins.
Cereal Chemistry43, 145e155
Chandel, G., Dudhare, M.S., Saluja, T., Shiva, S.M., Sharma, Y., Geda, A.K. Sahu., G.R., Mishra, V.N and Katiyar, S.K. 2005. Screening rice accession for nutritional quality traits to achieve nutritionally balanced rice. In 5th International Rice Genetics Symposium. Nov. 19-23. 60-61.
Deltufo J. P. 1993. Genetic analysis with Random Amplified Polymorphic DNA. Plant Physiol.,
101: 349-352.
Fan C C, Xing Y Z, Mao H L, Lu T T, Han B, Xu C G, Li X H, Zhang Q F. 2006. GS3, a major QTL for grain length and weight and minor QTL for grain width and thickness in rice, encodes a
putative transmembrane protein. Theor Appl Genet,112: 1164−1171
Garcia-Oliveira AL, Tan L, Fu Y, Sun C (2008). Genetic identification of quantitative trait loci for contents of mineral nutrients in rice grain. J. Integr. Plant Biol. doi: 10.1111/j.1744-7909.2008.00730.x
Gutman G. A. 1987. Slipped-strand mispairing: a major mechanism of DNA sequence evolution. Mol Biol Evol., 4: 203-221.
Harushima Y, Yano M, Shomura A, Sato M, Shimano T, Kuboki Y, Yamamoto T, Lin S Y, Antonio B A, Parco A, Kajiya H, Huang N, Khush G S, Sasaki T. 1998. A high-density rice geneticlinkage map with 2275 markers using a single F2 population.Genetics, 148: 479−494. Houston DF, Iwasaki T, Mohammad A, Chen L (1968)
Radialdistribution of protein by solubility classes in the milled rice kernel. J Agric Food Chem 5: 720-724
International Food Policy Research Institute. IFPRI, 2002. Biofortification: harnessing Agriculture technology to improve the health of the poor. http://www.ifpri.org/themes/grp 06/ paper/biofort.pdf: International Rice Research Institute IRRI, Manila, Philippines.
Joshi, S. P., V. S. Gupta, R. K. Aggarwal, P. K. Ranjekar and D. S. Brar. 2000. Genetic diversity and phylogenetic relationship as revealed by Inter simple sequence repeat (ISSR) polymorphism in the genus Oryza. Theor. Appl. Genet., 100: 1311-1320.
Juliano BO (1972) The rice caryopsis and its composition. In DF Houston, ed, Rice: Chemistry and Technology. American Association of Cereal Chemists, St. Paul, MN, pp 16-74
Levinson, G. and G. A. Gutman. 1987. Slipped-strand mispairing: a major mechanism of DNA sequence evolution. Mol Biol Evol., 4: 203-221.
Mackill, D. J., Z. Zhang, E. D. Redona and P. M. Colowit. 1996. Level of polymorphism and genetic mapping of AFLP markers in rice.
Genome, 39: 969-977.
McCouch, S. R.,Teytelman, L., Yunbi, Xu, Katarzyna, B. Lobos, Karen, Clare, Mark, Walton, Binying, Fu, Reycel, Maghirang, Zhikang, Li, Yongzhong, Xing, Qifa, Zhang, Izumi, Kono, Masahiro, Yano, Robert, Fjellstrom, Genevieve, DeClerck, David, Schneider, Samuel, Cartinhour, Doreen, Ware and Lincoln, Stein. Development and Mapping of 2240 New SSR Markers for Rice (Oryza sativa L.). (2002). DNA Research9, 199–207. Paran, I. and R. W. Michelmore. 1993. Development of
reliable PCR based markers to downy mildew resistance genes in Lettuce. Theor. Appl. Genet., 85: 985-993.
Pflieger, S., Lefebvre, V. and Causse, M. 2001. The candidate gene approach in plant genetics: A review. Molecular Breeding. 7: 275–291. Reddy K.K. and H.E. Shashidhar. 2012. DNA
ISSN 0975-928X
ISSN 0975-928X
Table 1. Mean value, Standard deviation and Range of Grain Fe, Zn and protein contents
Sr. No. Trait P1 P2 Mean Sed Minimum Maximum
1 Fe 9.5 13.28 12.1 0.18 6.68 19.21
2 Zn 17.2 29 24.6 1.51 15.82 31.18
3 Protein 7.41 7.84 7.79 1.39 6.31 9.8
Table 2. Correlation matrix of grain Fe, Zn and protein content
Variables Fe content Zn content Protein
Fe content 1 0.033 -0.208
Zn content 0.033 1 0.107
Protein -0.208 0.107 1
Table 3. Analysis of variance for grain Fe, Zn and protein contents.
a. ANOVA for grain iron content
SV DF SS MS F-cal F- Table
Rep 1 0.26 0.26 0.11 4.00 Significant
Treat 59 948.75 16.08 7.09 1.5 Significant Error 59 133.75 2.26
Sem Sed CV (%) T Value CD 1.06 1.51 12.59 2.00 3.01
b. ANOVA for grain zinc content
c. ANOVA for grain protein content
SV DF SS MS F-cal F- Table
Rep 2 0.37 0.18 3.68 3.07 Significant
Treat 59 145.58 2.46 48.78 1.433 Significant
Error 118 5.96 0.05
*SV=Source of variance *MS=Mean of square *CV=Coefficient of correlation *SS=Sum of square *DF=Degree of freedom
SV DF SS MS F-cal F- Table
Rep 1 15.92 15.92 8.25 4.00
Non significant
Treat 59 1651.55 27.99 14.50 1.53 Significant Error 59 113.83 1.92
Sem Sed CV (%) T Value CD 0.98 1.39 5.65 2.00 2.78
Sem Sed CV (%) T Value CD
ISSN 0975-928X
Table 4. List of 20 polymorphic SSR markers
Marker Forward Reverse PS Tm
RM5 CATACAACAGAGCAGCCTGC CTGCAAGGACGCGCCGAA 145 55
RM19 CAAAAACAGAGCAGATGAC CTCAAGATGGACGCCAAGA 226 55
RM25 GGAAAGAATGATCTTTTCATGG CTACCATCAAAACCAATGTTC 146 55
RM162 GCCAGCAAAACCAGGGATCCGG CAAGGTCTTGTGCGGCTTGCGG 229 55
RM489 ACTTGAGACGATCGGACACC TCACCCATGGATGTTGTCAG 271 55
RM237 CAAATCCCGACTGCTGTCC TGGGAAGAGAGCACTACAGC 130 55
RM454 CTCAAGCTTAGCTGCTGCTG GTGATCAGTGCACCATAGCG 268 55
RM510 AACCGGATTAGTTTCTCGCC TGAGGACGACGAGCAGATTC 122 55
RM413 GGCGATTCTTGGATGAAGAG TCCCCACCAATCTTGTCTTC 179 55
RM171 ACGCGAGGCACACGTACTTAC ACGAGATACGTACGCCTTTG 328 55
RM474 AAGATGTACGGGTGGCATTC TATGAGCTGGTGAGCAATGG 252 55
RM536 CTTAAGTGGCACTGTGATG CCGCCAAGAGAACTTCCAAAG 108 55
RM287 TTCCATGGCACACAAGCC CTGTGCACGAACTTCCAAAG 102 55
RM260 ACTCCACTATGACCCAGAG. GAACAATCCCTTCTACGATCG 111 59.4
RM12796 GAGAGGATTCATGGTGAGCATCC CCAAGACCTCCATTCAAGAGTGC 283 68
RM234 ACAGTATCCAAGGCCCTGG CACGTGAGACAAAGACGGAG 156 64
RM488 CAGCTAGGGTTTTGAGGCTG TAGCAACAACCAGCGTATGC 177 64
RM490 ATCTGCACACTGCAAACACC AGCAAGCAGTGCTTTCAGAG 101 63
RM248 TCCTTGTGAAATCTGGTCCC GTAGCCTAGCATGGTGCATG 102 63
RM455 AACAACCCACCACCTGTCTC AGAAGGAAAAGGGCTCGATC 131 55
Table 5. Markers linked to Zn content in RIL population using single marker analysis.
Trait Chromosome. No. Markers pr(F) R2%
Zn 2 RM12796 0.000325375 *** 15
Zn 3 RM489 0.022966461 * 4
Zn 11 RM287 0.006325870 ** 11
Table 6. Details of QTLs identification for fe and protein content in brown rice of swarna x moroberekan recombinant inbreed lines using composite interval mapping.
*qgpc- grain protein content (gpc) *qfe- iron
QTL Chro. Marker interval Position in cM LOD value
R2 (%) Additive effect
Allelic effect
qgpc-1 6 RM510-RM454 18.0-45.0 3.8 70 -0.8 M
qgpc-2 10 RM474-RM171 46.0-81.0 3 73 0.8 M
qgpc-3 10 RM474-RM171 83.0-89.0 2.5 73 0.7 M
ISSN 0975-928X
ISSN 0975-928X
ISSN 0975-928X
Figure 3. Banding pattern of polymorphic SSR markers in 60 RIL’s
ISSN 0975-928X