Published online November 18, 2014 (http://www.sciencepublishinggroup.com/j/ijber) doi: 10.11648/j.ijber.20140306.11
ISSN: 2328-7543 (Print); ISSN:2328-756X (Online)
Pricing as a marketing mix element: Investigating its effect
on market share for supermarkets in the Ngaka Modiri
Molema district of the North West province of South Africa
Ateba Benedict Belobo, Hein Johannes Prinsloo
School of Management Sciences, North-West University, Mafikeng Campus, South Africa
Email address:
atebabenedict@yahoo.com (A. B. Belobo), Hein.Prinsloo@nwu.ac.za (H. J. Prinsloo)
To cite this article:
Ateba Benedict Belobo, Hein Johannes Prinsloo. Pricing as a Marketing Mix Element: Investigating its Effect on Market Share for Supermarkets in the Ngaka Modiri Molema District of the North West Province of South Africa.
International Journal of Business and
Economics Research.Vol. 3, No. 6, 2014, pp. 196-210. doi: 10.11648/j.ijber.20140306.11Abstract:
This paper propped up as a result of the lack of awareness on the role of pricing in market share gain or lossamong retailers in general. The empirical focus of the study was at the Ngaka Modiri Molema district in the North-West province of South Africa. The researcher saw that the identified problem negatively affected the profits of retailers in the Ngaka Modiri Molema district. Thus, there was need to carry out this study in order to improve the awareness level of the role pricing has in market share gain or loss among Ngaka Modiri Molema retailers. It was also aimed at developing a pricing decision support system that can assist Ngaka Modiri Molema retailers in pricing decision making. The study was performed on 11 selected items commonly available in the database from the three largest supermarkets in the fast consumer goods retail sector at the Ngaka Modiri Molema district (Pick n Pay, Spar and Shoprite supermarkets). A panel data technique was used in determining the outcomes of this paper. The study revealed that pricing play a major role in market share gain or loss among Ngaka Modiri Molema retailers. Hence, there is need to increase retailers awareness with regards to the mentioned finding. Practical recommendations were made and a pricing decision support system was developed to assist Ngaka Modiri Molema retailers.
Keywords:
Marketing Mix, Pricing, Market Share, Fast Consumer Goods, Retailing1. Introduction
Rapsomanikis and Sarris (2009-2010) said that the world has currently experience a dramatic increase in the prices of commodities like maize, rice and wheat. Although the prices of such commodities have now declined, they continue to remain at a significantly high rate compare to the prices pre 2005. Rapsomanikis and Sarris alluded that in general, the changes in commodity prices are characterised by the increase or decrease in purchase. This is because these fluctuations in prices present a serious challenge to consumers buying power.
Balcombe (2009-2010) indicated that changes in price, either increase or decrease, impact on the trading position of retailers in a long-term. Whitehouse and Associates (2007:35) maintain that the Bureau of Marketing Research predicted a slower average growth in the South African fast moving consumer goods market from 2007 due to the economic
Nkaga Modiri Molema district.
2. Literature Review
In this section, a brief empirical literature relating to the role of pricing in market share gain in South Africa and the Ngaka Modiri Molema district will be briefly discussed. The role of price in the market and its role as an important tool for market share gain will conclude this section. Marketing mix is the set of controllable marketing tools consisting of product, price, place and promotion (Shankar & Chin 2011:1542).
2.1. Marketing Mix Effectiveness in the North-West Retail Sector
Information supplied by Managers of the chosen supermarkets in this study (Shoprite, Pick n Pay and Spar), indicated that centralisation is a primary factor affecting their performance. Thus, one can say the high level of centralisation practised by these supermarkets is a clear indication of limited application of the marketing mix elements. Guruprakash and Sohn (2008:9) mentioned that centralisation impede the ability of departmental stores to appropriately respond to customer needs and improve customer service due to limited powers in decision making. De Jager (2004:112-113) performed a study using the Living Standard Model (LSM) to determine target consumers for Pick n Pay and Shoprite in (North-west province, Potchefstroom) Results obtained include:
Current market segment targeted by these retailers differ from their actual target market.
The marketing mix elements that were in place were not in any way appropriate to what was seen to be the actual market of these retailers.
De Jager’s findings indicate a clear misapplication of the marketing mix. He further assumed that an inappropriate marketing mix to wrong target markets is likely to also be the case among supermarkets in other NW province areas. Furrier et al. (2007) has stressed that marketing activities has a great impact on the performance of a business in the market place or to achieve its market share. A large number of supermarket retailers in the Ngaka Modiri Molema district can be viewed to be offering poor business services thus, a possible misapplication of the marketing mix elements. As confirm by Southern African Legal Information Institute (2012) database, there were 14 court cases in 2012 concerning poor customer service with regard to the retail sector at the Ngaka Modiri Molema magistrate court in Mafikeng. However, it was earlier mentioned that Munusamy and Hoo (2008) confirmed that pricing play a major role in market share gain among all other marketing mix elements.
2.2. Pricing in the Market
Reviere (2009:1) pointed out that the price concept differs whether a person lives in a market economy, planned, command or traditional economy. Because pricing influence
the economic actions in a market economy, it is best to discuss pricing concept on a market economy basis. Palley (2004:1-2) alluded that in a market economy, the contemporary framework of neoliberalism emphasises the efficiency of market competition, which is based on the microeconomic theory of pricing, the key variable influencing the demand and supply in the market place. Pitner (2007:1) indicated that when understanding price in the market or how it works in business, all is about the demand and supply functions. Pitner, further indicated that from supply perspective, the higher the price of a product, the higher the supply, the lower the price of a product, the lower the supply. The demand perspective is connected to consumer behaviour in that if pricing affects consumers’ buying behaviour negatively, the demand curve will slope downward, meaning a drop in purchase behaviour. Alternatively, if pricing is positive, consumer buying power will increase, leading to the demand curve sloping upward, more sales and market performance for the business.
Moutinho and Chien (2008:162) indicated that even though in recent decades other factors are also now playing a role in influencing consumer behaviour or decision to make a purchase, price still remains the most important element determining a business sales, profitability and market share. Wiid (2012:6) said consumers will always attach a certain value for the product they want to buy and these values is always reflected in the price of the product. The influence of price on sales and its consequent effect on market share can be analyse on the consumer buying decision model. Plessis and Rousseau (2007:260) refer to consumer decision model as the primary decisions consumers make whether to purchase or not, to spend or save their money when engaged in a particular buying situation.
Egan (2007:54) specify that the decision to make a purchase involved the following stages: problem recognition, information search, evaluation, decision, purchase and post-purchase evaluation. A consumer decision to post-purchase a product with regards to price may be based on; available income with regard to the offered price of a product, information on different price offers from competitors, evaluating the best price offer, purchasing from the retailer with the best price and if the is value for the price paid. Plessis and Rousseau (2007:269) said, repeat purchase of a product or service will depend on the post purchased experience by the consumer. If for example a consumer could experience a better value for the price paid, it may lead to repeat purchase of the product or service. Conferring to Khan (2011:43) consumer decision model is a good determinant to identify cause and effect relation in the market. From the above discussed influence that price has in the market, this study focuses on showing that price is an important tool for Ngaka Modiri retailers in gaining market share.
2.3. Pricing Decision Making
is one of the most important or central management tasks for any business. According to Dutta et al (2003) businesses without efficient pricing process may be unable to set prices that reflect the wishes of its target customers. Blyth (2006:448) and Escalana et al. (2012:159) indicate that pricing process involve all the steps in determining final price for products or services. Conferring to Hinterhuber and Liozu (2012) implementing a pricing structure requires a high degree of discipline from any business, and any business can improve its pricing performance so far as its pricing approaches are well-structured. Pricing process is represented in figure 2.1.
Figure 2.1. Pricing process Blyth (2006:448)
2.4. Market Share Scramble among South Africa Supermarket Brands
According to Venter & Van Rensburg (2011:118) a market share indicates how an organisation is performing relative to its competitors and a market share is calculated by dividing an organisation’s share by the total sales of all organisations for a specified product-market (Venter & Van Rensburg, 2011:118). The market share of any business is considered to be the key element of the business performance. Ernst and Young (2004:39) indicate that the most pressing issue in the South African retail sector is currently the battle for market share. This is due to the rapid growth in the retail sector consequent with relative maturity. Retailers are highly competing against each other to achieve a positive market share position. McGregor (2013) indicated that there has
been a public battle in the media between Shoprite and Pick n Pay over who has the dominant market share. This indicates how important it is for retailers of fast consumer goods to be market share dominant. Derby (2013) mentioned that South Africa’s oldest and most enduring retailer, Pick n Pay, has lost a great deal of its market share to rivals like Spar and Shoprite since 2012. Derby highlighted that Pick n Pay is still struggling to regain its lost position for two successive years.
Supermarket brands scrambling for market share is also the case in the North-West province. Dirkie (2011/2012:15) indicated how supermarket retailers like Choppies Limited (ltd) are performing relatively well. This has made Choppies a faster growing retailer in the Northwest province as compare to its competitors in terms of market share since its introduction in 2008 into the province. Keeping satisfying consumers loyal is a common tactic to increase sales and market share since supermarkets are often located within close proximity and sell more or less the same products. Thus, each retailer’s ability to sell its merchandise sustainably largely depends on the strength of its marketing mix activities especially pricing (Marriri & Chipunza, 2009). Euromonitor International (2012) indicated that in South Africa supermarket retailers like Shoprite and Spar Group have increased their market share over competitors, due to their ability to implement pricing strategies that will provide commodities to consumers at reasonable prices. Scheer (2010) indicated that in South Africa consumer increase knowledge and expertise of industry and store prices, has led to repeat purchase or loyalty to certain store brands. This is because consumers are always interested on better offers by competitors.
3.Research Methodology
Table 3.1. Summary of data description
Dependent variables (sales of selected 11 items) Independent variables (prices for the 11 selected items)
Items Code for items Items Code for items
White star maize meal 5 kg Q1 White star 5 kg P1
Tastic rice 2kg Q2 Tastic rice 2kg P2
Coke 2 litters Q3 Coke 2 litters P3
Lays potato chips 125g Q4 Lays potato chips 125g P4
Axe deodorant spray100ml Q5 Axe deodorant spray100ml P5
Sasko bread 700g Q6 Sasko bread 700g P6
Chicken braai cuts 2kg Q7 Chicken braai cut 2kg P7
Golden apple 1kg Q8 Golden apple 1kg P8
Nutriday yogurt 6x100ml Q9 Nutriday yogurt P9
Colgate tooth paste100ml Q10 Colgate tooth paste100ml P10
Styvensen cigarette (pack) Q11 Styvensen cigarette (pack) P11
The research design used in this study was based on a quantitative research method approach. This approach was used because, the occurrences of behaviour were counted, correct answers or errors were also counted and all recorded in quantity. Within this design the parameters of an
to Stat SA (2009) these focus municipalities represent 80% of the total Ngaka Modiri Molema District. The three indicated municipalities were targeted since the researcher aimed on selecting only supermarket stores with a large client base, which is reflected in the focus municipalities. All selected supermarkets for this study experienced a sales turnover above 15,000 product units (regardless of brand or trademark) and client base above 10, 000 monthly.
The paper made used of purposive sampling, which was employed in order to enable the researcher to select supermarkets with qualified reliable and applicable information. The largest supermarket store from each sampled supermarket brand (Pick n Pay, Spar and Shoprite) was selected as participants. This three supermarket brands together represent more than 80% of retail market share in the Ngaka Modiri Molema district. Participating employees included the regional marketing manager and branch manager of each supermarket brand. Data was collected from the point of sales application of the three participating super market stores database. Data was on a monthly basis from January 2011 to August 2013. The variables from the data collected included Selling Price Index (SPI) and the turnover rate (sales) for 11 selected items commonly available in the database of the selected supermarkets (Shoprite, Pick n Pay and Spar). The SPI was used to monitor the continuous change in the pricing of items in supermarkets and also monitor the impact of these price changes on consumer purchase tendencies. The monthly sales figures for selected items were used as estimation for market share for each supermarket. Thus the dependent variable was price and the independent variable was market share. A summary of data description based on the 11 selected are represented in table 3.1
The analytical technique used in this paper was based on the panel data analyses. The researcher used a panel of the three largest fast consumer goods retailers in the Ngaka Modiri Molema district to establish the relationship between their pricing and its effect on market share gain or lost. A panel data refer to pooling of observations on a cross-section of households, countries or business organisations and following them over several time periods (Baltagi, 2008:1). A panel data analyses was best suited for this study because it takes an organisations’ specific heterogeneity in to consideration. The second reason was that, due to the repeated cross section of observations, panel data are better suited in studying the dynamics of change. Lastly panel data analyses are very effective in evaluating strategies or policies among “organisation’s”. It was thus, clear that the researcher could effectively achieve the objective of the study by employing a panel data analyses. This objective was to
investigate the degree to which constant changes in pricing decisions by the three largest fast consumer goods retailers’ in the Ngaka Modiri Molema district impact on their market share gain or share lost. In order to run the linear regression, four panel data tests were run. These tests involve the panel unit root tests, poolability, model estimation tests and the diagnostic tests. After performing this panel data tests, results from model estimation were forecasted to predict the future.
3.1. Model Specification
The Panel Ordinary Least Square (POLS) model was used in running regressions. The model specification (relationship between the dependent - market share, and the independent variable - pricing) of this paper was then equated as
it it
it P
MSV =
β
0+β
1 +ε
Formula (3.1). From formula (3.1)indications represented are as follows:
Market Share Value (MSV)= the dependent variable that the model is trying to predict
= the intercept of the equation.
β = the slope coefficient of the price variable.
Price (P ) = the independent variable that was used to predict the dependent variable.
ɛ = the error term or the regression residual variable. It represented all other variables like (quality and advertising) that could have an effect on the market share other than the independent variable (P).
i = all the cross section (supermarkets) who participated in the study.
t = the time period under study (January 2011 to August 2013).
This studies objective was to determine relationships between dependent and the independent variables. Based on this, POLS seem best suited in determining the mentioned relationships.
4. Results and Discussion
The following section will present and discuss findings from the empirical research. The authors want to highlight that the three sampled supermarket brands represent more than 80% of the market shares in the fast consumer goods retail sector in Ngaka Modiri Molema district. Thus, the three supermarkets were a faire representation of the entire fast consumer goods retail sector in the Ngaka Modiri Molema district. Three panel data unit root tests were performed separately for each data category (sales data and price data). All the performed unit tests produced a stationary outcome in all levels. Unit root results are presented in table 4.1a and 4.1b
Table 4.1a. Panel data unit root tests for price data Table.4.1b. Panel data unit root tests for sales data
Results for price data Results for sales data
Test Coefficients value Test Coefficients value
Levin, lin,Chu -2.171 0.015** Levin, lin,Chu -3.101 0.001***
Im, Pesaran& Shin -5.468 0.000*** Im, Pesaran& Shin -4.871 0.000***
ADF-Fisher Chi-square 148.373 0.000*** ADF-Fisher Chi-square 137.863 0.000***
After the panel data unit root test the authors carried out a poolability test between the pooled and the fixed effect models, to estimate which panel data model was appropriate in this paper. The random effect model was seen to be less effective for poolability testing. This is because Baltagi (2008:17) said random effect model is appropriate if draws are to be made randomly from a large population were N is
significantly large. In this paper = 3 (3 ) <
= 2.066(2 8 ℎ ), Thus, an insufficient size to
permit the random effect model testing. To decide between the pooled and the fixed effect model, the F test and Chi-square test
were performed. In order to correct for heteroscedasticity the white cross section was used. After performing the relevant poolability test, the fixed effect model which assumes cross section heterogeneity was considered. A conducted test for individual fixed effects for sampled cross sections (supermarkets) rejected that cross sections are homogenous, Implying that the behavioural relationship between price and market share is different for each individual supermarket. Thus, the fixed effect model confirmed to be the most robust and representative model specification. Results for the poolability test are depicted in table 4.2.
Table 4.2. Results for fixed effects
Input/output FixedeffectEstimates Q-Statistic value Conclusion
P1&Q1 F-Statistics
Chi-square
2031.774 365.799
0.000*** 0.000***
was rejected
P1&Q2 F-Statistics
Chi-square
937.920 294.039
0.000*** 0.000***
was rejected
P3&Q3 F-Statistics
Chi-square
357176.083 859.917
0.000*** 0.000***
was rejected
P4&Q4 F-Statistics
Chi-square
181.957 153.649
0.000*** 0.000***
was rejected
P5&Q5 F-Statistics
Chi-square
31.845 50.503
0.000*** 0.000***
was rejected
P6&Q6 F-Statistics Chi-square 19987.053 583.343 0.000*** 0.000*** was rejected
P7&Q7 F-Statistics
Chi-square
105436.831 742.816
0.000*** 0.000***
was rejected
P8&Q8 F-Statistics
Chi-square
5858.161 466.058
0.000*** 0.000***
was rejected
P9&Q9 F-Statistics
Chi-square
19491.564 580.939
0.000*** 0.000***
was rejected
P10&Q10 F-Statistics Chi-square
3264.471 410.516
0.000*** 0.000***
was rejected
P11&Q11 F-Statistics Chi-square
1933.121 361.129
0.000*** 0.000***
was rejected
*/[**]/[***] denotes significance level at 10%/ 5% and 1% respectively
Table 4.3. Model estimation results
Input/output Supermarket Coefficient values R square
P1& Q1
Pick nꞌ Pay Spar Shoprite
-22.390 -15.824 -27.194
0.000*** 0.000*** 0.000***
0.980
P2 & Q2
Pick nꞌ Pay Spar Shoprite
-20.928 -32.208 -43.587
0.053** 0.046** 0.000***
0.954
P3 & Q3
Pick nꞌ Pay Spar Shoprite
-117.118 -48.438 -72.176
0.000*** 0.000*** 0.000***
0.999
P4 & Q4
Pick nꞌ Pay Spar Shoprite
-34.208 -29.776 -18.746
0.000*** 0.000***
0.000*** 0.841
P5 & Q5
Pick nꞌ Pay Spar Shoprite
-2.237 -2.089 -4.112
0.000*** 0.003*** 0.000***
0.823
P6 & Q6
Pick nꞌ Pay Spar Shoprite
-68.204 -43.509 -36.402
0.000*** 0.000*** 0.000***
0.998
P7 & Q7
Pick nꞌ Pay Spar Shoprite
-32.075 -44.993 -65.857
0.002*** 0.003*** 0.000***
0.999
P8 & Q8
Pick nꞌ Pay Spar Shoprite
-46.967 -26.796 -17.739
0.000*** 0.000*** 0.000***
0.995
P9 & Q9
Pick nꞌ Pay Spar Shoprite
-56.434 -21.872 -50.339
0.000*** 0.000*** 0.000***
Input/output Supermarket Coefficient values R square
P10 & Q10
Pick nꞌ Pay Spar Shoprite
-79.515 -47.507 -85.588
0.000*** 0.017* 0.000***
0.986
P11 & Q11
Pick nꞌ Pay Spar Shoprite
-9.261 -16.004 -15.478
0.051** 0.000*** 0.000***
0.992
*/[**]/[***] denotes significance level at 10%/ 5% and 1% respectively
Poolability test reflected that, the null hypothesis that the data must be estimated by pooled model is rejected against the alternative that it must not. According to Gujarati (2004:642), the fixed effect try to indicate the differences in special features like managerial style, organisational philosophy or the target market of an organisation. After the poolability test was done, the model estimation was performed on all 11 studied items. The model estimation had to establish the level of trueness of the problem statement with regards to the model specification and the selected panel data model. Despite the fact that the fixed effect model was the considered model in this paper, model estimation was conducted for both fixed and pooled model. The aim was to perfectly establish that the fixed effect model was the most appropriate model to be considered. The R squares between the pooled and the fixed effect models were compared. R squares indicates the least results of 0.8228 and a high value of 0.9999 for fixed effect. The pooled model had a least result of -0.004280 and a maximum of 0.691226. Thus, the fixed effect model confirmed to be the most robust and representative model specification.Results showed that all in-dependent variables (price) are all significant in explaining the dependent variables (market share) for all 11 tested items. Table 4.3 presents the model estimation results for fixed effects.
To further elaborate on the interpretation of table 4.6 if considering input and output variable (P1 & Q1) for instance; the coefficient indicates that a R1 increase in the price for white star maize meal 5kg by any of the sampled
supermarket against competitors, sales will decrease by 22, 15 and 27 units for Pick n Pay, Spar and Shoprite respectively. Likewise a R1 decrease in the price for Whit star maize meal 5kg by any of the sampled supermarkets against competitors will increase sales by 22, 15 and 27 units
for Pick n Pay, Spar and Shoprite respectively. The values
of Pick n Pay (0.0006), Spar (0.0009) and Shoprite (0.0002) indicates the level of significance in which the independent variable (price) explains the dependent variable (market share) for sampled supermarkets for White star maize meal 5 kg is 0% for Pick n Pay, Spar and Shoprite respectively. The adjusted R square of 0.980400 indicates that 98% of the variation in market share for sampled supermarkets for White star maize meal 5kg is been explain by price. Meaning only 2% of the variation in market share for sampled supermarkets is been explain by other determinants such as quality and advertising. Same explanations hold for all other tested items in table 4.3.
Lastly, the diagnostic tests were conducted. Brooks (2009: 43) mentioned that the diagnostic tests are required in a panel analyses because they show that estimation techniques like the (OLS) linear regression may have ignored a series of undesirable elements. Brook also said the diagnostic test also try to confirm if coefficient estimates from regressions are justifiable or fairly conducted. In this paper the diagnostic tests were conducted to ensure reliability of results from linear regression. The diagnostic tests conducted in this study were the normality, serial correlation and heteroscedasticity. Results from each of this test are presented in table 4.4.
Table 4.4. Diagnostic tests
Test Measurement Conclusion
Normality test
: all i is normally distributed : not all i is normally distributed
Jarque-Bera Errors were normally distributed. Thus regressions failed to reject
Serial correlation test : = 0
: ≠ 0.
Correllogram Q-statistics test
(1st difference) Authors concluded that no serial correlation was present in the models
Heteroscedasticity :"ί$="
: not equal for all ί
White’s cross section The white cross-section was used to correct the problem of heteroscedasticity.
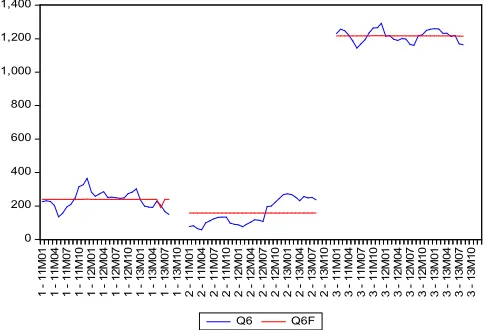
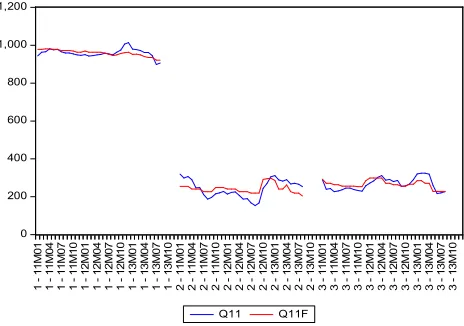
Lastly forecasting was conducted. Forecasting was done in this paper to show how accurate were regression models in predicting the value of quantity demanded. Forecasting results is represented in appendix 1. The blue and the red line reflect the actual versus the fitted values. The first, second and third relationships in the figures represent Pick n Pay, Spar and Shoprite supermarkets respectively. With regards to the outcome from forecasting, the model of this study was concluded accurate since the predicted or forecasted values mimic the actual values. Thus, the model can be used for
forecasting future quantity demand for a specified price for a product.
5. Conclusions
loss among Ngaka Modiri Molema retailers. After conducting an empirical research through a panel data analysis on the three largest supermarkets in the Ngaka Modiri Molema district, results reflect that price plays a major role in market share gain or loss among retailers in the Ngaka Modiri Molema district in general. The researcher recommends that retailers should dedicate more attention on pricing in order to increase their market share
All three sampled supermarkets in this paper had a positive outcome to this conclusion. Regression outcomes indicated that consumers’ measures price transparency among retailers in order to make a purchase decision. Results showed that a supermarket that has the most moderate pricing for a certain product had the highest market share of that product. It was seen that an increase in price will affect consumers’ behaviour negatively and consequently lost in market share. Likewise a decrease in price of a product will affect consumers’ behaviour positively and consequently market share gain. Findings also indicated that market share domination is very important for supermarkets in the Ngaka Modiri Molema district. Extensive price wars were initiated by supermarkets for products in which they had a dominant market of share
However, critiques can argue the effectiveness of the role of price in influencing market share if other determinants (error term) were not taken in to consideration in the model specification. Hence, the used of the panel data analysis technique made available a solution to such criticisms. This is because regression results from the model estimations gave an indication of all changes of the dependent variable
influence by other determinants over the studied period. Results indicated that changes made by other determinants were not up to 20% for each tested items among all sample supermarkets. This is highly supported by the R square results were the least adjusted R square is 82%.
Thus, it was necessary that the authors should develop a pricing decision support system (framework) that will assist Ngaka Modiri Molema fast consumer goods retailers in developing appropriate pricing decision. The frame work that was developed in this paper was adopted from Kehagias et al. (2009). Kehagias et al. came up with a framework which suggested that pricing decision for any product category is to be guided by a specific objective. Thus retailers should guide pricing decision with the objective of increasing market share. The mentioned framework was modified to fit in to the context our paper.
This model assumed that pricing dimensions and pricing determinants are strongly connected. Hence, it is important that Ngaka Modiri Molema fast consumer goods retailers should simultaneously consider both pricing dimensions and pricing determinant in developing pricing decisions. The model indicates some internal and external factors that Ngaka Modiri Molema retailers should consider when making pricing decision. The model further suggested that a pricing decision for any product category in the fast consumer goods industry will involve either an increase or decrease in price. However, whatever pricing decision a retailer select, retailers objective should be towards market share gain.
5.1. Advantages of the Proposed Model
It will enable fast consumer goods retailers in the Ngaka Modiri Molema district to select the most appropriate pricing strategies and policies for their target market
It fits accurately in the Ngaka Modiri Molema fast consumer goods retail sector. Its implementation is straight and forward and easy to understand.
5.2. Drawbacks of the Proposed Model
The might be issues of limited information with respect to new products and actions of competitors. However it is important to have a contingency plan for handling such shortcomings
The application of the model may only permit decision making in the fast consumer goods industry.
Most fast consumer goods retailers in the Nkaga Modiri Molema district may lack analytical abilities in handling most dynamics in the model. However skills can be improve through training programs
It is hoped that the findings of this paper will encourage retailers to take pricing seriously and will also implement the propose pricing decision support system in making more appropriate and effective pricing decisions in order to improve their market shares.
Aknowledegement
Special thanks to Mr. Andrew Maredza of the School of management Sciences, North University, Mafikeng Campus for his continuous support and encouragement throughout this paper
My endless gratitude to the sampled supermarkets who participated in this study. Special thanks to their regional and branch managers for making available reliable data for this paper.
Authors Information
Mr. Benedict Ateba has just completed his masters in the school of management science at the North-West University of South Africa. His current research focus is on developing decision support systems in the South Africa retail sector within the heavy weight, lightweight and banking retail sectors. Private bag X2046, Mmabatho, 2735, South Africa. Mobile:+27(0)736902154.Email:atebabenedict@yahoo.com( correspondingauthor)
Professor Hein Prinsloo is a senior lecturer at the North-West University Business School. He supervised my masters studies in the area of pricing and market share. Email:Hein.prinsloo@nwu.co.za.
Appendix 1
0 200 400 600 800 1,000 1,200 1,400 1 1 1 M 0 1 1 1 1 M 0 4 1 1 1 M 0 7 1 1 1 M 1 0 1 1 2 M 0 1 1 1 2 M 0 4 1 1 2 M 0 7 1 1 2 M 1 0 1 1 3 M 0 1 1 1 3 M 0 4 1 1 3 M 0 7 1 1 3 M 1 0 2 1 1 M 0 1 2 1 1 M 0 4 2 1 1 M 0 7 2 1 1 M 1 0 2 1 2 M 0 1 2 1 2 M 0 4 2 1 2 M 0 7 2 1 2 M 1 0 2 1 3 M 0 1 2 1 3 M 0 4 2 1 3 M 0 7 2 1 3 M 1 0 3 1 1 M 0 1 3 1 1 M 0 4 3 1 1 M 0 7 3 1 1 M 1 0 3 1 2 M 0 1 3 1 2 M 0 4 3 1 2 M 0 7 3 1 2 M 1 0 3 1 3 M 0 1 3 1 3 M 0 4 3 1 3 M 0 7 3 1 3 M 1 0 Q1 Q1FFigure 1. Forecasting results for White star maize meal
1,000 1,200 1,400 1,600 1,800 2,000 2,200 2,400 2,600 1 1 1 M 0 1 1 1 1 M 0 4 1 1 1 M 0 7 1 1 1 M 1 0 1 1 2 M 0 1 1 1 2 M 0 4 1 1 2 M 0 7 1 1 2 M 1 0 1 1 3 M 0 1 1 1 3 M 0 4 1 1 3 M 0 7 1 1 3 M 1 0 2 1 1 M 0 1 2 1 1 M 0 4 2 1 1 M 0 7 2 1 1 M 1 0 2 1 2 M 0 1 2 1 2 M 0 4 2 1 2 M 0 7 2 1 2 M 1 0 2 1 3 M 0 1 2 1 3 M 0 4 2 1 3 M 0 7 2 1 3 M 1 0 3 1 1 M 0 1 3 1 1 M 0 4 3 1 1 M 0 7 3 1 1 M 1 0 3 1 2 M 0 1 3 1 2 M 0 4 3 1 2 M 0 7 3 1 2 M 1 0 3 1 3 M 0 1 3 1 3 M 0 4 3 1 3 M 0 7 3 1 3 M 1 0 Q2 Q2F
Figure 2. Forecasting results for Tastic rice
0 2,000 4,000 6,000 8,000 10,000 12,000 14,000 16,000 18,000 1 1 1 M 0 1 1 1 1 M 0 4 1 1 1 M 0 7 1 1 1 M 1 0 1 1 2 M 0 1 1 1 2 M 0 4 1 1 2 M 0 7 1 1 2 M 1 0 1 1 3 M 0 1 1 1 3 M 0 4 1 1 3 M 0 7 1 1 3 M 1 0 2 1 1 M 0 1 2 1 1 M 0 4 2 1 1 M 0 7 2 1 1 M 1 0 2 1 2 M 0 1 2 1 2 M 0 4 2 1 2 M 0 7 2 1 2 M 1 0 2 1 3 M 0 1 2 1 3 M 0 4 2 1 3 M 0 7 2 1 3 M 1 0 3 1 1 M 0 1 3 1 1 M 0 4 3 1 1 M 0 7 3 1 1 M 1 0 3 1 2 M 0 1 3 1 2 M 0 4 3 1 2 M 0 7 3 1 2 M 1 0 3 1 3 M 0 1 3 1 3 M 0 4 3 1 3 M 0 7 3 1 3 M 1 0 Q3 Q3F
50 100 150 200 250 300 350 400 450 1 1 1 M 0 1 1 1 1 M 0 4 1 1 1 M 0 7 1 1 1 M 1 0 1 1 2 M 0 1 1 1 2 M 0 4 1 1 2 M 0 7 1 1 2 M 1 0 1 1 3 M 0 1 1 1 3 M 0 4 1 1 3 M 0 7 1 1 3 M 1 0 2 1 1 M 0 1 2 1 1 M 0 4 2 1 1 M 0 7 2 1 1 M 1 0 2 1 2 M 0 1 2 1 2 M 0 4 2 1 2 M 0 7 2 1 2 M 1 0 2 1 3 M 0 1 2 1 3 M 0 4 2 1 3 M 0 7 2 1 3 M 1 0 3 1 1 M 0 1 3 1 1 M 0 4 3 1 1 M 0 7 3 1 1 M 1 0 3 1 2 M 0 1 3 1 2 M 0 4 3 1 2 M 0 7 3 1 2 M 1 0 3 1 3 M 0 1 3 1 3 M 0 4 3 1 3 M 0 7 3 1 3 M 1 0 Q4 Q4F
Figure 4. Forecasting results for potato chips
0 10 20 30 40 50 1 1 1 M 0 1 1 1 1 M 0 4 1 1 1 M 0 7 1 1 1 M 1 0 1 1 2 M 0 1 1 1 2 M 0 4 1 1 2 M 0 7 1 1 2 M 1 0 1 1 3 M 0 1 1 1 3 M 0 4 1 1 3 M 0 7 1 1 3 M 1 0 2 1 1 M 0 1 2 1 1 M 0 4 2 1 1 M 0 7 2 1 1 M 1 0 2 1 2 M 0 1 2 1 2 M 0 4 2 1 2 M 0 7 2 1 2 M 1 0 2 1 3 M 0 1 2 1 3 M 0 4 2 1 3 M 0 7 2 1 3 M 1 0 3 1 1 M 0 1 3 1 1 M 0 4 3 1 1 M 0 7 3 1 1 M 1 0 3 1 2 M 0 1 3 1 2 M 0 4 3 1 2 M 0 7 3 1 2 M 1 0 3 1 3 M 0 1 3 1 3 M 0 4 3 1 3 M 0 7 3 1 3 M 1 0 Q5 Q5F
Figure 5. Forecasting results for axe deodorant spray
0 200 400 600 800 1,000 1,200 1,400 1 1 1 M 0 1 1 1 1 M 0 4 1 1 1 M 0 7 1 1 1 M 1 0 1 1 2 M 0 1 1 1 2 M 0 4 1 1 2 M 0 7 1 1 2 M 1 0 1 1 3 M 0 1 1 1 3 M 0 4 1 1 3 M 0 7 1 1 3 M 1 0 2 1 1 M 0 1 2 1 1 M 0 4 2 1 1 M 0 7 2 1 1 M 1 0 2 1 2 M 0 1 2 1 2 M 0 4 2 1 2 M 0 7 2 1 2 M 1 0 2 1 3 M 0 1 2 1 3 M 0 4 2 1 3 M 0 7 2 1 3 M 1 0 3 1 1 M 0 1 3 1 1 M 0 4 3 1 1 M 0 7 3 1 1 M 1 0 3 1 2 M 0 1 3 1 2 M 0 4 3 1 2 M 0 7 3 1 2 M 1 0 3 1 3 M 0 1 3 1 3 M 0 4 3 1 3 M 0 7 3 1 3 M 1 0 Q6 Q6F
Figure 6. Forecastasting results for sasko bread
0 4,000 8,000 12,000 16,000 20,000 1 1 1 M 0 1 1 1 1 M 0 4 1 1 1 M 0 7 1 1 1 M 1 0 1 1 2 M 0 1 1 1 2 M 0 4 1 1 2 M 0 7 1 1 2 M 1 0 1 1 3 M 0 1 1 1 3 M 0 4 1 1 3 M 0 7 1 1 3 M 1 0 2 1 1 M 0 1 2 1 1 M 0 4 2 1 1 M 0 7 2 1 1 M 1 0 2 1 2 M 0 1 2 1 2 M 0 4 2 1 2 M 0 7 2 1 2 M 1 0 2 1 3 M 0 1 2 1 3 M 0 4 2 1 3 M 0 7 2 1 3 M 1 0 3 1 1 M 0 1 3 1 1 M 0 4 3 1 1 M 0 7 3 1 1 M 1 0 3 1 2 M 0 1 3 1 2 M 0 4 3 1 2 M 0 7 3 1 2 M 1 0 3 1 3 M 0 1 3 1 3 M 0 4 3 1 3 M 0 7 3 1 3 M 1 0 Q7 Q7F
Figure 7. Forecasting results for Chicken braai cuts
0 200 400 600 800 1,000 1,200 1,400 1,600 1 1 1 M 0 1 1 1 1 M 0 4 1 1 1 M 0 7 1 1 1 M 1 0 1 1 2 M 0 1 1 1 2 M 0 4 1 1 2 M 0 7 1 1 2 M 1 0 1 1 3 M 0 1 1 1 3 M 0 4 1 1 3 M 0 7 1 1 3 M 1 0 2 1 1 M 0 1 2 1 1 M 0 4 2 1 1 M 0 7 2 1 1 M 1 0 2 1 2 M 0 1 2 1 2 M 0 4 2 1 2 M 0 7 2 1 2 M 1 0 2 1 3 M 0 1 2 1 3 M 0 4 2 1 3 M 0 7 2 1 3 M 1 0 3 1 1 M 0 1 3 1 1 M 0 4 3 1 1 M 0 7 3 1 1 M 1 0 3 1 2 M 0 1 3 1 2 M 0 4 3 1 2 M 0 7 3 1 2 M 1 0 3 1 3 M 0 1 3 1 3 M 0 4 3 1 3 M 0 7 3 1 3 M 1 0 Q8 Q8F
Figure 8. Forecasting results for Golden delicious apple
0 400 800 1,200 1,600 2,000 2,400 2,800 1 1 1 M 0 1 1 1 1 M 0 4 1 1 1 M 0 7 1 1 1 M 1 0 1 1 2 M 0 1 1 1 2 M 0 4 1 1 2 M 0 7 1 1 2 M 1 0 1 1 3 M 0 1 1 1 3 M 0 4 1 1 3 M 0 7 1 1 3 M 1 0 2 1 1 M 0 1 2 1 1 M 0 4 2 1 1 M 0 7 2 1 1 M 1 0 2 1 2 M 0 1 2 1 2 M 0 4 2 1 2 M 0 7 2 1 2 M 1 0 2 1 3 M 0 1 2 1 3 M 0 4 2 1 3 M 0 7 2 1 3 M 1 0 3 1 1 M 0 1 3 1 1 M 0 4 3 1 1 M 0 7 3 1 1 M 1 0 3 1 2 M 0 1 3 1 2 M 0 4 3 1 2 M 0 7 3 1 2 M 1 0 3 1 3 M 0 1 3 1 3 M 0 4 3 1 3 M 0 7 3 1 3 M 1 0 Q9 Q9F
0 400 800 1,200 1,600 2,000 2,400 1 1 1 M 0 1 1 1 1 M 0 4 1 1 1 M 0 7 1 1 1 M 1 0 1 1 2 M 0 1 1 1 2 M 0 4 1 1 2 M 0 7 1 1 2 M 1 0 1 1 3 M 0 1 1 1 3 M 0 4 1 1 3 M 0 7 1 1 3 M 1 0 2 1 1 M 0 1 2 1 1 M 0 4 2 1 1 M 0 7 2 1 1 M 1 0 2 1 2 M 0 1 2 1 2 M 0 4 2 1 2 M 0 7 2 1 2 M 1 0 2 1 3 M 0 1 2 1 3 M 0 4 2 1 3 M 0 7 2 1 3 M 1 0 3 1 1 M 0 1 3 1 1 M 0 4 3 1 1 M 0 7 3 1 1 M 1 0 3 1 2 M 0 1 3 1 2 M 0 4 3 1 2 M 0 7 3 1 2 M 1 0 3 1 3 M 0 1 3 1 3 M 0 4 3 1 3 M 0 7 3 1 3 M 1 0 Q10 Q10F
Figure 10. Forecasting result for Colgate tooth paste
0 200 400 600 800 1,000 1,200 1 1 1 M 0 1 1 1 1 M 0 4 1 1 1 M 0 7 1 1 1 M 1 0 1 1 2 M 0 1 1 1 2 M 0 4 1 1 2 M 0 7 1 1 2 M 1 0 1 1 3 M 0 1 1 1 3 M 0 4 1 1 3 M 0 7 1 1 3 M 1 0 2 1 1 M 0 1 2 1 1 M 0 4 2 1 1 M 0 7 2 1 1 M 1 0 2 1 2 M 0 1 2 1 2 M 0 4 2 1 2 M 0 7 2 1 2 M 1 0 2 1 3 M 0 1 2 1 3 M 0 4 2 1 3 M 0 7 2 1 3 M 1 0 3 1 1 M 0 1 3 1 1 M 0 4 3 1 1 M 0 7 3 1 1 M 1 0 3 1 2 M 0 1 3 1 2 M 0 4 3 1 2 M 0 7 3 1 2 M 1 0 3 1 3 M 0 1 3 1 3 M 0 4 3 1 3 M 0 7 3 1 3 M 1 0 Q11 Q11F
Figure 11. Forecasting results for Styvensen cigarette
Appendix 2
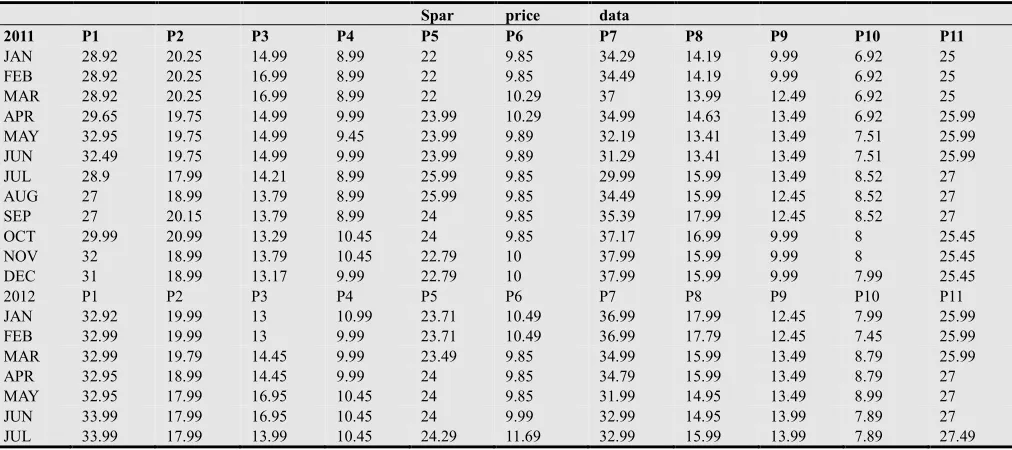
Table 1. Data used in analysing price change for the sampled Pick n Pay supermarket for (P1 to P11); from 2011 January to 2013August
Pick n Pay price data
2011 P1 P2 P3 P4 P5 P6 P7 P8 P9 P10 P11
JAN 27.79 19.99 12.99 9.89 19.99 9.29 32.99 11.99 9.99 6.79 20.99
FEB 27.99 19.99 12.99 9.99 19.99 9.29 32.99 11.99 9.99 6.79 20.99
MAR 26.99 19.99 13.99 9.89 19.99 9.89 34.99 10.99 11.99 6.99 20.79
APR 28.99 19.49 14.99 9.89 22.99 9.89 35.17 10 12.99 6.99 20.79
MAY 28.89 19.49 14.79 10.99 22.99 10.49 29.99 12.99 12.99 7.49 21
JUN 32.49 19.99 14.79 10.79 21.99 10.29 29.49 12.99 12.79 7.49 21
JUL 30.99 17.99 14.69 11.79 25.99 9.99 27.99 13.65 12.79 7.79 21.39
AUG 30.99 18.99 12.99 9.99 25.99 9.99 28.99 14.99 11.59 7.89 21.39
SEP 28.99 19.99 12.99 9.99 24.49 9.49 33.99 17.49 10.59 7.99 21.39
OCT 28.49 20.99 12.79 9.79 19.99 9 32.49 14.74 9.79 7.99 21.59
NOV 32.79 22.99 12.79 8.49 22.49 8.92 35.99 15.99 9.79 7.99 21.99
DEC 31.49 18.99 11.99 8.49 21.99 8.49 34.89 16.99 9.79 8.39 21.99
2012 P1 P2 P3 P4 P5 P6 P7 P8 P9 P10 P11
JAN 31.79 19.99 12.49 8.79 22.99 9.49 34.89 17.99 9.99 7.99 21.59
FEB 31.79 19.99 12.79 8.79 23.29 9.99 34.49 17.95 9.99 8 21.99
MAR 30.99 19.29 13.49 9.99 23.49 9.59 33.49 16.99 9.99 8.47 21.99
APR 28.79 18.49 13.29 9.99 22.19 9.35 30.29 16.29 11.49 8.47 21.99
MAY 28.79 17.99 13.79 10.49 21.49 9.99 31.99 15.99 11.99 6.99 22
JUN 28.99 17.69 12.99 10.99 21.99 9.99 32.79 15.79 11.99 7.99 22.39
JUL 29.99 18.99 13.26 10.69 20.29 10 33.49 17.29 11.99 7.65 22.75
AUG 31.49 19.99 12.99 11.49 22.49 10 34.29 13.89 11.59 7.15 23.29
SEP 32.29 21.39 12.79 9.49 22.79 9.99 36.99 15.29 11 7.29 22.99
OCT 33.79 21.99 12.49 9.49 22.99 9.59 37.89 16.29 10.69 7.69 22.49
NOV 31.49 22.99 12.49 9.29 21.99 9.29 39 17.29 9.99 6.75 22.19
DEC 29.99 20.75 12.19 9.29 20.99 8.99 37 16.99 9.69 6.75 21.99
2013 P1 P2 P3 P4 P5 P6 P7 P8 P9 P10 P11
JAN 29.99 20.99 12.49 12.29 21.99 10.29 38 16.99 9.79 6.99 22.79
FEB 27.99 21.39 12.29 11.29 22.39 10.99 34.89 17.49 9.99 6.99 22.75
MAR 27.99 21.49 12 11.99 22.99 10.99 35.99 17 10.99 7.89 23
APR 30.29 21.75 13.29 10.26 24.99 9.99 37.29 16.29 10.99 7.89 23.59
MAY 31.99 21.99 13.29 9.89 25.99 9.49 37.99 14.51 11.79 8.29 24
JUN 32.75 22.49 13.65 10.75 21.99 99.99 38 16.99 11.99 8.49 24
JUL 32.75 22.49 13.39 10.99 21.99 10.69 38.99 18.29 12.49 8.99 24.99
AUG 33.59 22.99 14.45 12.99 22.99 10.99 39.99 18.29 12.99 8.99 24.99
SEP - - - -
OCT - - - -
NOV - - - -
Table 2. Data used in analysing market share variation with regards to price change for the sampled Pick n Pay supermarket for (Q1 to Q11); from 2011 January to 2013 August.
Pick n pay sales data
2011 Q1 Q2 Q3 Q4 Q5 Q6 Q7 Q8 Q9 Q10 Q11
JAN 1200 1742 16457 361 21 225 18543 1459 2453 974 944
FEB 1186 1787 16490 367 23 231 18571 1477 2481 986 964
MAR 1220 1797 16411 276 10 227 18489 1500 2370 960 966
APR 1175 1892 16364 320 13 203 18456 1573 2328 969 981
MAY 1181 1913 16495 258 11 135 18900 1485 2338 889 976
JUN 1101 1890 16472 263 19 157 18935 1492 2352 866 978
JUL 1169 1978 16492 261 9 195 19042 1433 2374 849 966
AUG 1174 1940 16586 294 11 209 19006 1388 2410 832 960
SEP 1219 1906 16622 312 14 247 18847 1264 2456 829 960
OCT 1245 1873 16670 351 18 315 18913 1312 2505 811 954
NOV 1191 1817 16705 387 26 327 18797 1290 2513 814 950
DEC 1223 1877 16811 399 30 366 18834 1255 2523 784 947
2012 Q1 Q2 Q3 Q4 Q5 Q6 Q7 Q8 Q9 Q10 Q11
JAN 1219 1841 16778 341 17 283 18842 1226 2514 795 951
FEB 1212 1836 16778 349 14 258 18878 1215 2506 810 943
MAR 1221 1863 16725 276 10 273 18933 1239 2500 789 946
APR 1261 1913 16700 272 23 286 19022 1257 2447 772 949
MAY 1296 2005 16687 249 16 251 18981 1278 2421 823 952
JUN 1302 2041 16699 236 15 252 18923 1281 2412 791 958
JUL 1298 2000 16673 341 23 250 18866 1236 2420 799 954
AUG 1230 1938 16685 289 13 246 18833 1291 2436 811 949
SEP 1199 1903 16690 335 11 248 18790 1254 2464 816 964
OCT 1139 1891 16713 339 11 274 18715 1227 2498 807 975
NOV 1162 1874 16722 352 27 282 18677 1210 2550 827 1006
DEC 1190 1946 16780 357 29 302 18724 1225 2585 835 1014
2013 Q1 Q2 Q3 Q4 Q5 Q6 Q7 Q8 Q9 Q10 Q11
JAN 1141 1932 16804 297 21 237 18689 1229 2576 828 980
FEB 1187 1911 16816 320 18 199 18772 1204 2530 822 977
MAR 1198 1900 16871 280 12 193 18795 1213 2483 800 973
APR 1100 1892 16819 316 9 190 18726 1233 2462 785 962
MAY 1063 1897 16720 331 7 228 18712 1269 2409 761 962
JUN 1027 1860 16687 254 13 204 18709 1220 2395 749 945
JUL 1015 1856 16650 211 21 167 18660 1181 2374 718 899
AUG 1009 1829 16631 193 9 150 18575 1165 2363 690 907
SEP - - - - - - - -
OCT - - - -
NOV - - - -
DEC
Table 3. Data used in analysing price change for the sampled Spar supermarket for (P1 to P11); from 2011 January to 2013August.
Spar price data
2011 P1 P2 P3 P4 P5 P6 P7 P8 P9 P10 P11
JAN 28.92 20.25 14.99 8.99 22 9.85 34.29 14.19 9.99 6.92 25
FEB 28.92 20.25 16.99 8.99 22 9.85 34.49 14.19 9.99 6.92 25
MAR 28.92 20.25 16.99 8.99 22 10.29 37 13.99 12.49 6.92 25
APR 29.65 19.75 14.99 9.99 23.99 10.29 34.99 14.63 13.49 6.92 25.99
MAY 32.95 19.75 14.99 9.45 23.99 9.89 32.19 13.41 13.49 7.51 25.99
JUN 32.49 19.75 14.99 9.99 23.99 9.89 31.29 13.41 13.49 7.51 25.99
JUL 28.9 17.99 14.21 8.99 25.99 9.85 29.99 15.99 13.49 8.52 27
AUG 27 18.99 13.79 8.99 25.99 9.85 34.49 15.99 12.45 8.52 27
SEP 27 20.15 13.79 8.99 24 9.85 35.39 17.99 12.45 8.52 27
OCT 29.99 20.99 13.29 10.45 24 9.85 37.17 16.99 9.99 8 25.45
NOV 32 18.99 13.79 10.45 22.79 10 37.99 15.99 9.99 8 25.45
DEC 31 18.99 13.17 9.99 22.79 10 37.99 15.99 9.99 7.99 25.45
2012 P1 P2 P3 P4 P5 P6 P7 P8 P9 P10 P11
JAN 32.92 19.99 13 10.99 23.71 10.49 36.99 17.99 12.45 7.99 25.99
FEB 32.99 19.99 13 9.99 23.71 10.49 36.99 17.79 12.45 7.45 25.99
MAR 32.99 19.79 14.45 9.99 23.49 9.85 34.99 15.99 13.49 8.79 25.99
APR 32.95 18.99 14.45 9.99 24 9.85 34.79 15.99 13.49 8.79 27
MAY 32.95 17.99 16.95 10.45 24 9.85 31.99 14.95 13.49 8.99 27
JUN 33.99 17.99 16.95 10.45 24 9.99 32.99 14.95 13.99 7.89 27
Spar price data
2011 P1 P2 P3 P4 P5 P6 P7 P8 P9 P10 P11
AUG 34.79 19.99 13.45 12.99 24.29 11.69 34.29 13.99 13.99 7.89 27.49
SEP 34.79 21.49 13.45 12.74 23.99 11.45 35 13.99 12.99 6.99 27.49
OCT 35 21.49 13 12.74 22.99 9.99 35 18.99 12.49 6.99 22.49
NOV 33.37 18.99 12.99 9.99 21.35 9.99 37.99 18.99 9.99 6.99 22.19
DEC 33.37 18.99 12.99 9.99 21.35 9.89 37.99 15.99 9.99 6.99 21.99
2013 P1 P2 P3 P4 P5 P6 P7 P8 P9 P10 P11
JAN 28.99 20.25 13.17 9.99 24 9.99 38 19.99 9.99 6.99 22.79
FEB 28.99 20.25 13.17 10.98 24.19 10.49 37.99 19.99 12.99 7.65 25.99
MAR 28.99 21.49 13.99 10.98 25.29 10.49 34.99 14.99 12.99 7.65 25.99
APR 33.79 18.99 14.95 11 25.29 10.89 34.99 14.99 12.49 8.69 24.49
MAY 34.79 18.99 14.95 12.49 25.99 10.39 35.45 14.99 12.49 8.69 27
JUN 34.79 17.99 14.99 12.89 22.99 10.45 35.75 17.74 13.49 6.99 27.49
JUL 35.59 19.99 14.99 12.89 22.99 10.45 35.49 17.14 12.14 6.99 27.49
AUG 35.59 20.39 14.99 12.99 22.99 10.69 36.48 17.59 11 7.32 28.49
SEP - - - -
OCT - - - -
NOV - - - -
DEC
Table 4. Data used in analysing market share variation with regards to price change for the sampled Spar supermarket for (Q1 to Q11); from 2011 January to 2013August.
Spar 3 data
2011 Q1 Q2 Q3 Q4 Q5 Q6 Q7 Q8 Q9 Q10 Q11
JAN 50 1127 1912 266 9 78 970 393 482 336 320
FEB 66 1130 1864 306 4 82 967 392 520 366 299
MAR 61 1125 1862 337 3 65 896 402 485 370 307
APR 43 1147 1900 328 2 57 934 297 447 408 290
MAY 36 1159 1909 281 2 100 982 312 403 394 247
JUN 30 1166 1917 274 6 112 1008 343 378 392 249
JUL 59 1211 1928 308 4 123 1045 260 349 367 212
AUG 86 1180 1959 300 1 133 931 248 391 351 187
SEP 88 1156 1966 318 8 134 903 185 444 358 196
OCT 65 1120 2003 260 13 134 864 196 482 362 216
NOV 53 1190 1960 249 17 97 653 231 526 380 221
DEC 65 1225 2011 256 19 91 641 315 560 406 228
2012 Q1 Q2 Q3 Q4 Q5 Q6 Q7 Q8 Q9 Q10 Q11
JAN 58 1200 2009 245 11 88 674 285 520 418 215
FEB 57 1208 2019 267 7 76 678 276 489 423 224
MAR 57 1219 1936 276 9 91 715 292 444 409 226
APR 60 1288 1930 288 6 104 731 309 437 393 207
MAY 61 1340 1845 269 3 118 790 324 451 381 187
JUN 47 1372 1841 266 4 114 753 319 435 445 191
JUL 44 1411 1953 272 4 108 721 331 426 493 167
AUG 39 1366 2000 190 3 197 685 374 416 477 153
SEP 34 1314 2004 188 7 200 679 401 430 513 168
OCT 30 1322 2045 192 9 222 650 333 437 567 245
NOV 46 1390 2049 226 12 246 598 299 488 606 271
DEC 63 1453 2066 257 16 268 582 358 502 614 306
2012 Q1 Q2 Q3 Q4 Q5 Q6 Q7 Q8 Q9 Q10 Q11
JAN 88 1391 2052 272 9 272 587 314 522 610 312
FEB 101 1380 2048 253 12 268 579 302 501 617 289
MAR 116 1358 1990 253 4 253 612 380 506 605 283
APR 91 1432 1922 244 6 231 625 418 511 596 291
MAY 82 1500 1914 210 3 256 611 412 498 584 267
JUN 84 1550 1899 199 8 248 607 399 493 605 272
JUL 76 1515 1899 186 11 251 618 388 509 612 266
AUG 64 1493 1894 162 15 237 598 364 516 601 254
SEP - - - -
OCT - - - -
NOV - - - -
Table 5. Data used in analysing price change for the sampled Shoprite supermarket for (P1 to P11); from 2011 January to 2013August.
Shoprite price data
2011 P1 P2 P3 P4 P5 P6 P7 P8 P9 P10 P11
JAN 28 19.39 12.49 8.99 18.99 9.45 33.29 11.99 9.17 6.49 25.45
FEB 29 19.79 12.49 8.99 18.99 9.45 33.29 11.99 9.17 6.49 26.99
MAR 29 19.49 12.94 8.99 18.99 9.45 34.99 10.99 11.21 6.49 26.99
APR 29.79 19.49 13.17 9.99 17.99 9.99 35.99 10.99 11.21 6.75 27.45
May 29.79 19.99 13.49 10 17.99 10.99 37.29 12.99 12 7.45 27.45
JUN 30.99 19.99 13.49 10 19.99 11 29.99 12.99 12 7.45 27.99
JUL 30.99 21.99 13.99 10 19.99 10.29 29.99 13.99 11.45 8 27.99
AUG 33.47 21.99 13.99 9.99 19.99 9.99 32.99 13.99 10 8 27.99
SEP 33.47 22.99 13.99 9.99 21.45 9.49 34.99 10.45 10 8.29 27.99
OCT 32 23.99 13.99 9.99 21.17 9 39.99 10.45 9.99 8.29 28.21
NOV 32 19.99 12.17 8.49 19.45 8.99 41.99 9.99 8.99 8.99 28.21
DEC 29.99 17.99 11.99 8.49 19.45 8.45 33.29 9.99 8.99 7.49 25.99
2012 P1 P2 P3 P4 P5 P6 P7 P8 P9 P10 P11
JAN 31.99 18.99 12.45 8.99 19.99 9.45 36.89 9.24 9.29 7.99 25
FEB 31.99 19.99 12.45 8.99 19.99 9.45 36.89 9.24 9.29 7.99 25
MAR 31.99 19.99 12.75 8.99 19.99 9.99 31.99 10 9.29 8.47 24.99
APR 28.99 19.99 12.75 9.45 20.45 9.99 31.99 10 7.89 8.47 24.99
May 28.99 17.99 13.49 9.45 20.45 10.29 29.99 15.99 7.89 8.29 26.99
JUN 28.79 17.99 13.49 10.45 20.45 10.29 29.99 15.99 10 7.99 26.99
JUL 28.79 20.99 13.99 10.45 20.79 11 26.45 15.99 10 7.99 27.49
AUG 29.99 20.99 13.99 11.49 21.75 11 34.99 15.29 10.49 7.79 27.49
SEP 29.99 22.99 13.99 9.99 21.99 9.99 34.99 13.99 11 7.39 28
OCT 31.45 22.99 12.29 9.99 21.99 9.99 35.99 13.99 10.17 7.39 28
NOV 31.45 21.99 12.29 9.29 21.99 9.45 35.99 13.99 9.19 6.45 27.29
DEC 28.99 19.99 11 8.99 17.99 9.45 35.29 11.99 9.19 6.45 27.29
2013 P1 P2 P3 P4 P5 P6 P7 P8 P9 P10 P11
JAN 28.99 19.45 11.99 10.45 18.99 9.39 35.99 13.99 9.75 6.99 26
FEB 29.99 19.45 12.49 10.99 18.99 9.39 35.99 14.75 9.99 6.99 26
MAR 29.99 19.99 12.99 11.99 20.99 10.29 36.99 14.75 10.75 7.49 26.99
APR 31.75 21.99 13.49 11.99 20.99 10.29 37.99 15.75 11.45 7.99 26.99
May 31.99 21.99 13.99 12.39 21.99 10.99 38.79 15.99 11.79 8.29 29.99
JUN 32.99 22.75 14.29 12.39 21.99 10.99 38.99 17.39 8.79 8.39 29.99
JUL 32.99 22.99 14.99 12.99 22.99 11.99 39.99 17.99 9.75 8.99 29.99
AUG 34.99 23.99 14.99 12.99 22.99 11.99 40.99 19.99 9.99 8.99 29.99
SEP - - - -
OCT - - - -
NOV - - - -
DEC - - - -
Table 6. Data used in analysing market share variation with regards to price change for the sampled Shoprite supermarket for (Q1 to Q11); from 2011 January to 2013August.
Shoprite sales data
2011 Q1 Q2 Q3 Q4 Q5 Q6 Q7 Q8 Q9 Q10 Q11
JAN 1023 2262 13100 232 29 1231 18714 200 1080 2051 290
FEB 966 2258 13111 220 31 1257 18689 197 1091 2081 240
MAR 958 2264 13177 218 31 1249 18560 231 1053 2076 243
APR 871 2260 13150 204 38 1221 18593 247 1039 2109 227
MAY 883 2273 13112 187 43 1186 18420 217 982 2094 231
JUN 826 2281 13109 171 39 1143 19113 194 977 2069 237
JUL 814 2200 13062 166 35 1170 19182 183 964 1998 246
AUG 853 2180 13058 163 34 1193 18985 157 993 1975 246
SEP 864 2100 13053 163 30 1236 18600 200 1017 1953 239
OCT 817 1996 13056 170 27 1264 18412 263 1031 1966 233
NOV 810 2321 13174 195 36 1266 18376 332 1072 1888 229
DEC 1077 2400 13208 214 41 1292 19200 461 1126 1915 259
2012 Q1 Q2 Q3 Q4 Q5 Q6 Q7 Q8 Q9 Q10 Q11
JAN 1037 2381 13259 200 37 1215 19032 501 1099 1891 273
FEB 1033 2322 13262 198 38 1219 19003 519 1100 1877 284
MAR 1046 2311 13248 195 38 1196 19347 530 1103 1820 303
APR 1089 2323 13244 171 35 1190 19388 531 1208 1794 312
MAY 1116 2376 13182 166 33 1201 19530 400 1230 1811 288
JUN 1133 2411 13175 134 39 1198 19611 388 1150 1843 292
JUL 1137 2340 13146 117 32 1165 19719 380 1137 1851 281
Shoprite sales data
2011 Q1 Q2 Q3 Q4 Q5 Q6 Q7 Q8 Q9 Q10 Q11
SEP 1083 2289 13133 127 22 1218 19225 443 993 1897 255
OCT 1036 2271 13219 151 19 1222 19187 460 999 1913 257
NOV 1016 2325 13227 186 22 1250 19158 500 1075 1930 266
DEC 1103 2399 13311 225 37 1256 19145 611 1120 1986 291
2013 Q1 Q2 Q3 Q4 Q5 Q6 Q7 Q8 Q9 Q10 Q11
JAN 1111 2406 13364 212 30 1259 19153 576 1097 1930 321
FEB 1101 2401 13213 212 27 1258 19150 521 1105 1911 325
MAR 1096 2397 13155 183 24 1233 19115 514 1062 1888 325
APR 1047 2309 13103 180 26 1232 19075 490 990 1851 319
MAY 1040 2283 13080 151 20 1214 18866 465 984 1837 260
JUN 1000 2217 13063 146 23 1219 18841 431 1133 1831 217
JUL 1006 2169 13025 98 18 1169 18810 419 1145 1812 221
AUG 960 2100 13011 103 15 1164 18757 360 1132 1789 227
SEP - - - -
OCT - - - -
NOV - - - -
DEC - - - -
References
[1] Balcombe K. (2009-2010). The nature and determinants of volatility in agriculture prices: An empirical study from 1962-2008. Commodity market review.
[2] Baltagi B. H. (2008). Econometric analysis of panel data. (4th ed), Chicester, John Wiley & Sons Ltd.
[3] Blyth J. (2006).Principles and practice of marketing. London, Thompson Learning.
[4] Claessen S., Kose M. A & Terrones M. E. What happens during recessions, crunches and bust? Economic Policy. (2009)
(60-62) pp.653-700.
http://www.econstor.eu/bitstream/10419/45452/1/638354102. pdf.
[5] De-Jagar N. (2004). The living standard measure as a market segmentation tool for selected retailers. Dissertation in masters of commerce at Northwest university Potchestroom campus.
[6] Derby, R. (2013). Recovering market share a big task for Pick
nꞌ Pay.
www.bdlive.co.za/opinion/columnists/203/04/24/recovering -market share-a-big-task-for-pick-n-pay.
[7] Dirkie U. (2012).Success stories. Section One. Invest Northwest Annual repport 2010/2011.
[8] Dutta S., Zbaracki M.J. & Bergen M. Pricing process as a capability: A resource-based perspective. Strategic management journal. (2003) (24) pp.615-630. http://onlinelibrary.wiley.com/doi/10.1002/smj.323/pdf [9] Egan J. (2007). Marketing communication.1sted,London,
Thomson.
[10] Esclana N. S., Diginis C., Plessis R., Machado R., Mpinganjira M., McIntee H., Kloppers R. S. & Theron D. (2012) Introduction to marketing. 4thed, Cape Town, JUTA & Company Ltd
[11] Furrier, O., Alexander M. T. &Sudharshan, D. The impact of resource strategy correspondence on marketing performance- financial performance – tradeoffs. Journal of strategic
marketing (2007) (15) pp.161-183.
http://gatton.uky.edu/falculty/sudharshan/puplications/The%2
0impact%200f%20resources-strategyonMarketingPerformanceFinancialPerformancetradeof f.pdf.
[12] Gujarati, D.N. (2004). Basic Econometrics. 4th ed. New York. McGraw-Hall.
[13] Guruprakash R. &Sohn T. H. (2008). A dissertation submitted to the engineering systems division in the partial fulfilment for the degree masters engineering in logistics. Massachusetts Institute of Technology
[14] Hinterhuber A. &Liozu S. (2012).Is time to rethink your pricing strategy.MIT Sloan management review (summer 2012 release)
[15] Indounas K. &Avlonitis G. J. Pricing objectives and their antecedents in the services sector. Journal of service
marketing. (2009) 20(3) pp.342-374.
http://www.emeraldinsight.com/doi/pdfplus/10.1108/0956423 0910964426
[16] Kehagias J. & Skourtis E. and Aikaterini V. Pricing strategy and practice: Plaiting pricing in to product categories and corporate objectives. Journal of product & brand management.
(2009) 18(1), pp.67-76.
http://www.emeraldinsight.com/doi/pdfplus/10.1108/1061042 0910933380
[17] Khan, S (2011). Marketing mix strategy adaptation: A retail organisation’s response to global economic downturn. Masters dissertation in technology marketing. Cape Peninsula University of Technology.
[18] Lee, C., & Griffith, D. A. The marketing strategy-performance relationship in an export-driven developing economy: A Korean illustration. International Marketing Review, (2004)
21(3), pp.321-334.
http://www.emeraldinsight.com/doi/pdfplus/10.1108/0265133 0410539648
[19] Mariri T. & Chipunza C. In-store shopping environment and impulse buying. African journal of marketing management.
(2009) 1(4) pp.102-108.
[20] McGregor G.(2010). Shoprite vs Pick nꞌ Pay: The showdown. www.fin24.com/companies/shoprite-vs-pick-n-pay-the-showdown-20100509.
[21] Moutinho L. & Chien C. (2008). Problems in marketing: Applying key concepts and techniques. 2nded, London, SAGE Publications.
[22] Munusamy J & Hoo W.C. Relationship between marketing mix strategy and consumer motive: An empirical study in major TESCO stores. Unitar E- journal. (2008) 4(2) pp.41-56. http://www.myjurnal.my/filebank/published_article/219441rel ationship_jayaraman.pdf.
[23] Palley T. I. (2004). From Keynesianism to Neoliberalism: Shifting paradigms in economics
[24] Plessis P. J. & Rousseau G.G (2007).Buying behaviour. Understanding consumer psychology and marketing. 4thed, Cape Town, Oxford University press.
[25] Rapsomanikis G. & Sarris A. (2009-2010). Introduction. Commodity market review. Food and agriculture organisation of the united nation.
[26] Roger B. M. (2003). An investigation into how marketers cope with an environment of high complexity and turbulence with special reference to the South African environment. Dissertation in doctor of philosophy at Rhodes University. [27] Roviere J. (2009). Price concept in
economics.http://www.helium.com/items/207879-the-concept-of-price-in-economics [15 February 2009].
[28] Scheer L.V. The South African cherry picking consumer’s price knowledge and gender issues. Problems and perspectives in management (2010) 8(3) pp.193-199 http://businessperspectives.org/journals_free/ppm/2010/PPM_ EN_2010_03_cont_Scheers.pdf
[29] Shankar A. C. & Chin K. K.(2011).A study of the relationship between marketing mix and customer retention for herbal coffee in Malaysia. 2nd international conference of business and economic research proceeding.
[30] Southern Africa Legal Information Institute (SAFLII) (2012). South Africa: Ngaka Modiri High Court in Mafikeng. http//www.saflii.org.za/cases/zanwite/2012[17 July, 2013, 10.40a.m].
[31] Statistics South Africa CPI Sources and Methods Manual (Stat S.A CPISMM) (2009). Release V.1 February. http: //www.statsssa.gov.za/cpi/documents/CPI-sources – method.pdf
[32] Venter P. &Rensburg M. J (2009). Strategic marketing: Theory and application for competitive advantage. 1sted, Cape Town, Oxford University press.
[33] White House Associates (2007).The South African agri-food market report. Prepared for high commission of Canadian trade.