Vol.7 (2017) No. 2
ISSN: 2088-5334
Structural Behaviour of Steel Building with Diagonal and Chevron
Braced CBF (Concentrically Braced Frames) by Pushover Analysis
Saloma
*, Yakni Idris
*, Hanafiah
*, Nico Octavianus
* *Civil Engineering Department, Faculty of Engineering, Sriwijaya University, Indonesia
E-mail: [email protected], [email protected], [email protected], [email protected]
Abstract— This paper presents diagonal and chevron braced steel structure design with pushover analysis conducted following
ATC-40 guidelines. In this study, the lateral load used is increased gradually until plastic hinge and collapse occur. The results are capacity curve, performance point, and the process of plastic hinge until the building collapse. There are five steel structure models designed based on the various types of bracing and bracing configuration. Model 1 is steel structure without bracing, model 2 and 3 are chevron braced steel structure, model 4 and 5 are diagonal braced steel structure. The results of this study indicate that the performance level of five models structure for earthquake in x direction and y direction according to ATC-40 is IO (Immediate Occupancy). Model 4 has the best effectiveness in terms of plastic hinge mechanism compared to other models. In the last step, model 4 is able to reduce plastic hinge 84% from model 1 for earthquake in x direction and 79% from model 1 for earthquake in y direction. Model 3 has the greatest ability to carry the forces of an earthquake compared to other models. It is 185% bigger than model 1 for x direction and 181% bigger than model 1for y direction. Model 3 has the greatest effectiveness in reducing lateral displacements compared to other models in the amount of 65.47% of model 1 for x direction and 72.14% of model 1 for y direction. Model 3 has the greatest effectiveness in reducing storey drift compared to other models in the amount of 73.89% of model 1 for x direction and 80.55% of model 1 for y direction.
Keywords— pushover analysis; capacity curve; performance point; immediate occupancy
I. INTRODUCTION
The level of an earthquake risk in Indonesia is very high, so the risk of building damages is very high too. In general, a structural element for quake damper in the concrete building is shearwall, but in steel building is bracing. Bracing has two types, i.e. concentrically braced frame (CBF) and eccentrically braced frame (EBF). Concentrically braced frame (CBF) is a steel frame structural system which has high elastic stiffness, while eccentrically braced frame (EBF) is a steel frame structural system which has an excellent elastic stiffness and good ductility [1]-[4]. Concentrically braced frame (CBF) has many types, i.e. diagonal brace (tension/compression both), chevron brace (K-brace), X-cross brace (tension/compression only), and inverted chevron brace. Chevron bracing give the best performance during an earthquake, compare to diagonal braced tension, diagonal braced compression, and X-braced [5]-[9].
The method used to reduce a high risk of building damages due earthquake is performance-based seismic design. The concept of performance-based seismic design determines the performance level which is expected to be reached when the structure affected by an earthquake with a certain intensity. The analysis is used in the
performance-based seismic design is pushover analysis. Pushover analysis is behaviour analysis of collapse building caused by an earthquake, a load of which is increased gradually until exceeding load capacity, leads to yielding, large deformation, and collapse. The purpose of pushover analysis is to estimate maximum force, deformation, and to provide information about the critical part of building structure.
This study analyses behaviour of diagonal braced and chevron braced steel frame structure CBF (concentrically braced frames) with pushover analysis was conducted following ATC-40 guidelines [10]-[12]. The purpose of this study is to compare the performance level of structure, plastic hinge mechanism, and the effectiveness of the model structure in earthquake resistant and reducing lateral displacements.
II. MATERIAL AND METHOD A. Pushover Analysis
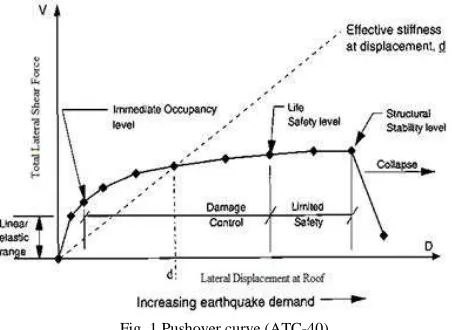
structure. Pushover analysis results in a capacity curve which describes the correlation of total lateral shear force (V) lateral displacement at the roof (D) as shown in Fig 1.
Fig. 1 Pushover curve (ATC-40)
The following is the explanation of pushover curve at Fig. 1 based on structural and non-structural damages, such as:
• At immediate occupancy level, damages caused by earthquake do not occur on structural and non-structural elements.
• At life safety level, damages caused by earthquake do not occur on structural elements but occur on non-structural elements such as fracture on walls.
• At structural stability level, damages caused by earthquake occur on both structural and non-structural elements. As a result, the structure can not endure lateral force. If the load is increased, then the structure will collapse.
The steps of pushover analysis in designing the structure of an earthquake resistant construction are [10]- [11]:
• Determining the control point to monitor the amount of displacement on the structure.
• Making capacity curve based on the various patterns of lateral force.
• Estimating the amount of lateral displacement during earthquake plan or displacement target.
• Evaluating the level of structure performance when the control point is located exactly on the target of displacement while using ATC 40.
The performance of building structure in ATC-40 is divided into six levels, such as:
1) Immediate occupancy, SP-1
On this level, the structural damage caused by the earthquake is small. The characteristic and the capacity of vertical and lateral force resistant system do not change, so the building is safe to use.
2) Damage control, SP-2
On this level, the value of earthquake load which is probable to exceed the 50 years duration of serviceability limit states is 10%.
3) Life safety, SP-3
On this level, some damages start to emerge significantly on the structure as the results of the earthquake occurrence. However, the structure can still endure the earthquake as the main component has not collapsed. The structure is still usable with some repairs, but the damage often needs more cost.
4) Limited safety, SP-4
The condition of the structure on this level may not be as good as the Life Safety level and not as bad as the next Structural Stability level.
5) Structural stability, SP-5
On this level, the building has been damaged heavily on the structural and non-structural component as the structure can not endure the lateral force due to the consolidation.
6) Not considered, Sp-6
On this level, the building has collapsed. As a result, the structure is not usable. The structure can only be evaluated seismically.
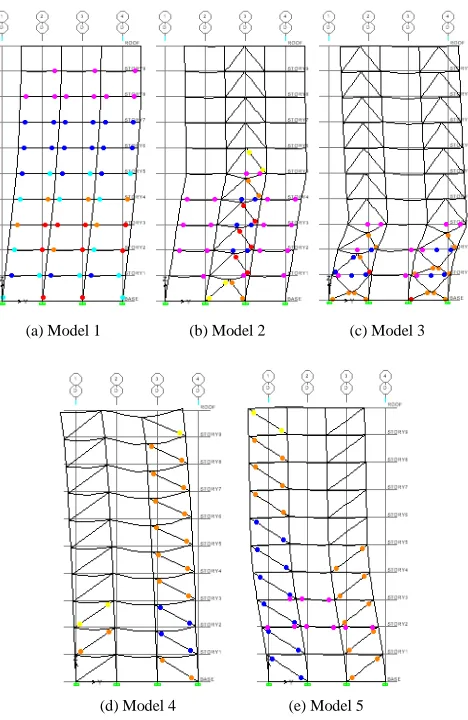
B. Structural Models
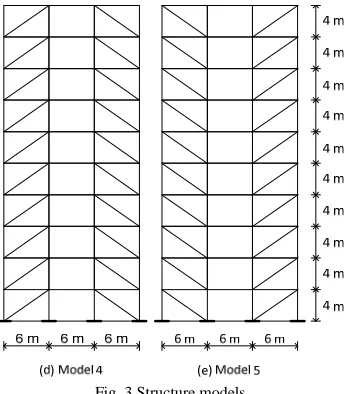
The building layout used in the study is presented in Fig. 2. The red line represents the bracing position on the building structure. The structural frame used is 10 story building which is designed into five structure models based on various types of bracing and bracing configuration as shown in Fig. 3.
Fig. 3 Structure models
III.RESULT AND DISCUSSION A. Base Shear
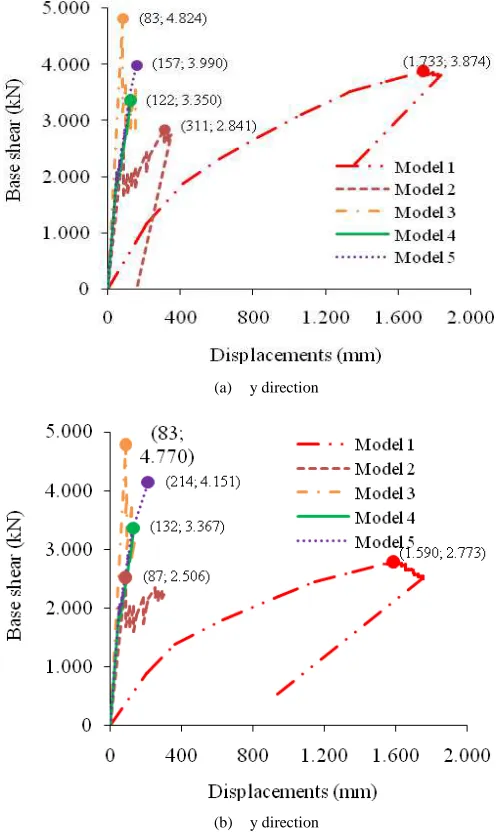
The comparison of base shear on each model is presented in Fig. 4 and Table 1. Based on Fig. 4 and Table 1, model 1 capability to carry the forces of an earthquake is the least of all models. It is able to carry 471 kN in both x direction and y direction. On the contrary, Model 3 has the greatest cability to carry the forces of an earthquake compared to other models. It is able to carry 1.34 kN in x direction and 1.33 kN in y direction. Model 3 is 185% bigger than model 1 for x direction and 181% bigger than model 1 for y direction.
0 200 400 600 800 1.000 1.200 1.400
Model 1 Model 2 Model 3 Model 4 Model 5
B
a
se
s
h
ea
r
x direction y direction
Fig. 4 Base shear (kN)
TABLEI
THE COMPARISON OF BASE SHEAR
Model Base shear (kN) Compared with model 1 (%)
x y x y
1 471 471 0 0
2 1.130 1.130 140 140
3 1.341 1.326 185 181
4 1.146 1.134 143 141
5 1.162 1.142 147 142
B. Lateral Displacement (δe)
The comparison of lateral displacements on each model is presented in Fig. 5.
0 2 4 6 8 10 12
0 10 20 30 40 50 60 70 80
S
to
rey
Lateral displacement, δ e(mm)
Model 1
Model 2
Model 3 Model 4
Model 5
(a) x direction
0 2 4 6 8 10 12
0 10 20 30 40 50 60 70 80
S
to
re
y
Lateral displacement, δe(mm)
Model 1
Model 2
Model 3
Model 4
Model 5
(b) y direction
Fig. 5 Lateral displacements
Model 1 has the highest lateral displacements which reach the amount of 63.09 cm for x direction and 78.39 cm for y direction. It means model 1 has the highest ductility compared to other models. On the contrary, model 3 has the lowest lateral displacement which reachess the amount of 21.78 cm for x direction and 21.84 for y direction. Then, model 3 is described as the model with the highest stiffness compared to other models. Model 3 has the greatest effectiveness in reducing lateral displacements compared to other models in the amount of 65.47% of model 1 for x direction and 72.14% of model 1 for y direction.
C. Storey Drift (∆)
TABLEII
THE COMPARISON OF STOREY DRIFT
Model ∆maks (cm)
Percentage of storey drift reduction to model 1 (%) x direction y direction x direction y direction
1 49.21 65.63 0 0
2 20.03 20.27 59.30 69.12
3 12.85 12.77 73.89 80.55
4 14.41 14.36 70.73 78.12
5 14.25 14.09 71.04 78.52
D. Drift Ratio
The result of storey drift analysis is used to estimate drift ratio. Drift ratio is used to estimate which floor will reach critical condition first. Drift ratio is the comparison of storey drift and storey height. Drift ratio on each model is presented in Fig. 6. Model 1 has the highest drift ratio that that reaches the value of 0.012 on the 4th floor for x direction and 0.0164 on 3rd floor for y direction. Model 3 has the lowest drift ratio that reaches the value of 0.0031 on the 4th floor for x direction and 0.0029 on 3rd floor for y direction. Model 3 has the greatest effectiveness in reducing drift ratio compared to other models in the amount of 74.59% for x direction and 82.35% for y direction.
0 2 4 6 8 10 12
0,000 0,003 0,006 0,009 0,012 0,015 0,018
S
to
re
y
Drift ratio
Model 1 Model 2 Model 3 Model 4 Model 5
(a) x direction
0 2 4 6 8 10 12
0,000 0,003 0,006 0,009 0,012 0,015 0,018
S
to
re
y
Drift ratio
Model 1 Model 2 Model 3 Model 4 Model 5
(b) y direction
Fig. 6 Drift ratio
E. Capacity Curve
Pushover analysis is used to determine control point on roof floor. The capacity curve is acquired from nonlinear static pushover analysis, and it describes the relation between the base shear and the displacements. The capacity curve on each model is presented in Fig. 7.
(a) y direction
(b) y direction
Fig. 7 Capacity curve
Model 3 has the highest strength to carry the forces of an earthquake compared to other models because model 3 has the highest base shear in the amount of 25% bigger than model 1 for the earthquake in x direction and 72% bigger than model 1 for the earthquake in y direction. Model 2 has the lowest strength to carry the forces of an earthquake compared to other models because model 2 has the lowest base shear in the amount of 27% smaller than model 1 for the earthquake in x direction and 10% smaller than model 1 for the earthquake in y direction. However, model 2 is stiffer than model 1.
F. Plastic Hinge Mechanism
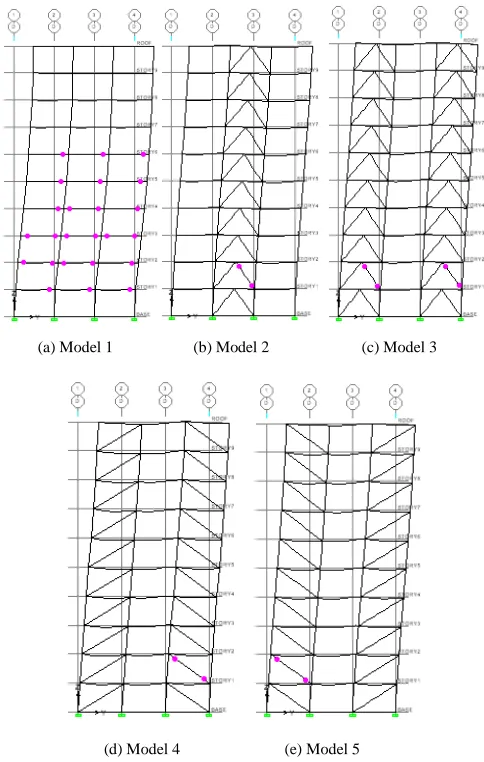
last step is shown in Table 3. The followings are the description of plastic hinge level for Fig. 8 to 11.
B : IO : LS : CP : C : D : E :
(a) Model 1 (b) Model 2 (c) Model 3
(d) Model 4 (e) Model 5
Fig. 8 The plastic hinge in the first step for earthquake in x direction
Based on Fig. 8, the plastic hinge in the first step of model 1 for the earthquake in x direction has 34 plastic hinges on beam. Model 2, 4, and 5 have 2 plastic hinges on bracing. Model 3 has 4 plastic hinges on bracing. All plastic hinges occur at B level.
In Fig. 9, the plastic hinge in the first step of model 1 for the earthquake in x direction has 24 plastic hinges on beam. Model 2, 4, and 5 have 2 plastic hinges on bracing. Model 3 has 4 plastic hinges on bracing. All plastic hinges occur at B level.
In
Fig. 10, the plastic hinge in the last step of model 1 for earthquake in x direction have 3 plastic hinges on beam at B level, 33 plastic hinges on beam, and 4 plastic hinges on column at IO level, 16 plastic hinges on beam at LS level, and 8 plastic hinges on beam at D level. Model 2 have 26 plastic hinges on beam at B level, 6 plastic hinges on beamat IO level, 4 plastic hinges on bracing at C level, 9 plastic hinges on bracing at D level, and 7 plastic hinges on bracing at E level. Model 3 have 16 plastic hinges on beam at B level, 4 plastic hinges on bracing at C level, and 23 plastic hinges on bracing at D level. Model 4 have 5 plastic hinges on bracing at IO level, 4 plastic hinges on bracing at C level, and 12 plastic hinges on bracing at D level. Model 5 have 9 plastic hinges on bracing at IO level, 4 plastic hinges on bracing at C level, and 17 plastic hinges on bracing at D level.
(a) Model 1 (b) Model 2 (c) Model 3
(d) Model 4 (e) Model 5
Fig. 9 The plastic hinges in the first step for earthquake in y direction
level. Model 5 have 9 plastic hinges on beam at B level, 12 plastic hinges on bracing at IO level, 2 plastic hinges on bracing at C level, and 16 plastic hinges on bracing at D level.
(a) Model 1 (b) Model 2 (c) Model 3
(d) Model 4 (e) Model 5
Fig. 10 The plastic hinges in the last step for earthquake in x direction
Based on Table 3, model 4 have the best effectiveness in terms of plastic hinge mechanism compared to other models because model 4 in the last step have the least plastic hinge and plastic hinge on the beam is not occur. It has 42 plastic hinges for the earthquake in x direction and 46 plastic hinges for the earthquake in y direction. In the last step, model 4 is able to reduce plastic hinge 84% from model 1 for the earthquake in x direction and 79% from model 1 for the earthquake in y direction.
TABLEIII
THE PERCENTAGE OF PLASTIC HINGE REDUCTION IN THE LAST STEP
Model
Total of plastic hinge Percentage of plastic hinge reduction to model 1 (%) Earthquake
in x direction
Earthquake in y direction
Earthquake in x direction
Earthquake in y direction
1 256 220 0 0
2 164 122 36 45
3 100 86 61 61
4 42 46 84 79
5 60 104 77 53
(a) Model 1 (b) Model 2 (c) Model 3
(d) Model 4 (e) Model 5
Fig. 11.The plastic hinges in the last step for earthquake in y direction
IV.CONCLUSIONS
The results of pushover analysis in this study conclude these six conclusions, as follows:
The performance level of five models structure for the earthquake in x direction and y direction according to ATC-40 is IO (Immediate Occupancy).
Model 4 have the best effectiveness in terms of plastic hinge mechanism compared to other models, and plastic hinge on the beam does not occur. In the last step, model 4 is able to reduce plastic hinge 84% from model 1 for the earthquake in x direction and 79% from model 1 for the earthquake in y direction.
Model 3 have the greatest cability to carry the forces of an earthquake compared to other models. It is 185% bigger than model 1 for x direction and 181% bigger than model 1 for y direction.
Model 3 have the greatest effectiveness in reducing lateral displacements compared to other models in the amount of 65.47% of model 1 for x direction and 72.14% of model 1 for y direction.
Model 3 have the greatest effectiveness in reducing storey drift compared to other models in the amount of 73.89% of model 1 for x direction and 80.55% of model 1 for y direction.
REFERENCES
[1] B. Cesar and R. C. Barros, “Seismic performance of metallic braced frames by pushover analysis,” ECCOMAS Thematic Conference on Computational Methods in Structural Dynamics and Earthquake Engineering, 2009, pp. 1-17.
[2] C. J. Chitte, “Effect of concentric braces on the behaviour of steel structure by pushover analysis,” IOSR-JMCE., vol. 11 (1), pp. 23-28, 2014.
[3] K. P. Juhilkumar, and D. G. Panchal, “Evaluation of response of OMF, CBF, and EBF to lateral loads using nonlinear pushover analysis,” IJLRET., vol. 1 (6), pp. 56-60, 2015.
[4] Khan, Ziaulla, B. R. Narayana, and Syed Ahamed Raza, “Effect of Concentric and Eccentric Type of Bracings On Performance Based Seismic Analysis of RC Building,” IJRET., vol. 4, pp. 278-283, 2015.
[5] R. Snehaneela and M. S. Karthiga, “Study of Eccentrically Braced Outrigger Frame under Seismic Exitation,” IJTET., vol. 5, pp. 48-53, 2015.
[6] A. S. Chethan, M. Ismail, and C. K. Sushma, “Evaluation of capacity of RCC framed structure with different brace configurations using pushover analysis”, IRJET., vol. 2 (2), pp. 855-859, 2015.
[7] Marquez, Edelis del V., William Lobo-Q, and Juan C. Vielma, “Comparative Analysis of the Energy Dissipation of Steel Buildings with Concentric and Eccentric Braces,” The Open Civil Engineering Journal., vol. 9, pp. 295-307, 2015.
[8] M. E. Kangavar, “Seismic propensity of knee braced frame (KBF) as weighed against concentric braced frame (CBF) utilizing ETABS and OPENSEES,” IJEAT., vol. 5, pp. 141-152, 2015.
[9] M. Mahmoudi and V. Eskandari, “The effects of height and length of link beam on response modification factors of eccentrically braced steel frames,” Research in Civil and Environmental Engineering, 1 (1): 41-53, 2013.
[10] Applied Technology Council, Seismic evaluation and retrofit of concrete buildings vol. 1, 1996.
[11] FEMA 440, Improvement of Nonlinear Static Seismic Analysis
Procedures, Applied Technology Council, Redwood City, California,
2005.