Research Journal
Volume 10, No. 32, Dec. 2016, pages 32–39
DOI: 10.12913/22998624/65110 Research Article
APPLICABILITY OF SELECTED GROUPS OF ROUGHNESS PARAMETERS
FOR DESCRIPTION OF SURFACE LAYER OF FLAT-TOP “PLATEAU”
STRUCTURES
Maciej Kowalski1, Magdalena Wiśniewska1, Paweł Karolczak1, Dana Stancekova2
1 Wrocław University of Science and Technology, Faculty of Mechanical Engineering, Łukasiewicza 5, 50-370
Wrocław, Poland, e-mail: [email protected]; [email protected]; [email protected]
2 University of Žilina, Faculty of Mechanical Engineering, Univerzitna 1, 010 26, Žilina, Slovakia, e-mail: dana.
ABSTRACT
The aim of this study is to determine the usefulness of selected 2D roughness pa-rameters for detecting changes of geometric features and the rate the quality of the surface generated in the process of honing combustion engines sleeves. The paper presents the importance of mathematical modeling of virtual surface topography with
different participation of determined and random factor. The possibilities of modeling the flat-top “plateau” surface roughness characteristic for honed surface was showed.
Suitability of application of the roughness parameter for description of the selected
variable characteristics of roughness profiles were determined using the correlation coefficient and the additional evaluation index designated as t. Indicator t was used for comparing the percentage change of the tested value of modeled profile characteristics
with changes selected for evaluation of the roughness parameters 2D. Keywords: roughness parameters, flat-top “plateau” surface, honing.
INTRODUCTION
Roughness is the natural state of any surface. Necessity for measurement of the inequality ap-peared when production requirements started growing, and evaluation with senses – visual or
tactile stopped being appropriate. It was showed
that 90% of all manufacturing defects have, in practice, their sources in surface from mechani-cal damage such as fatigue cracks, cracks due to stress induced by corrosion, abrasive –
cor-rosion wear, excessive abrasive wear, corcor-rosion,
erosion, etc.
The model of the object shown in the techni-cal drawings of machine parts assums that each surface of the object is perfectly smooth, it con-sists of ideal geometric surfaces and is clean. However, it is impossible to obtain such a sur-face, since individual machining processes leave characteristic traces on the surface [1, 2].
Nowadays components are manufactured for
specific applications. Any deviations from the ideal geometric surface have an influence on the func -tional behavior of the object, i.e. characteristics such as abrasion resistance, sliding and lubricant
properties, fatigue strength. A perfect example of
geometrical functional structure is the surface af-ter honing which is characaf-terized by a net of inaf-ter-
inter-secting grooves. It is used in the engine cylinder
sleeves. Too shallow cracks formed on the surface of the cylinder in the process of honing don’t pro-vide proper lubrication during engines work. Too smooth surface can result in premature wear of cylinder liners and piston rings. The actual surface roughness can be described by multiple parameters. Their selection in order to best describe of geomet-ric changes occure on the surface as a result of man-ufacturing processes is often a problem. To save the costs and time of real surface research mathemati-cal modeling of surface geometry can be used.
Received: 2016.08.30
Accepted: 2016.10.18
The use of mathematical modeling
simpli-fies and accelerates, while expanding, analyti
-cal capabilities [1, 2]. In this paper an attempt
to determine the suitability of the use of selected groups of roughness parameters for detecting changes of geometric features and evaluating the quality of performance of the engines cylinder liners was made.
HONING
Honing is the method of treatment, mainly holes or cylindrical surfaces, with the use of the abrasive honing stones mounted on the outer
or inner surface of the head. As a result of a
combination of stroke and rotation movement and the pressure of tool to the surface remov-ing material is takremov-ing place, and on the surface process generated structure with cross-hatch pattern. Regular crossing scratches have a
sig-nificant positive impact on the sliding piston
cooperate with the sleeve, eg. in the combus-tion engine. Such direccombus-tional signs arise as a result of the submission of the rotational
move-ment of the head with honing stone, with axial reciprocating movement. Significant honing ef -fects include the ability to obtain the structure
of “plateau”, which is characterized by a grid
of deep grooves on the smooth background. This structure provides good tribological con-ditions, which increase the durability of co-operating teams. Such a structure is obtained using in pretreatment coarse grained stone and
for finishing fine [3, 4]. Initially, it was recom -mended to receive the surface of the cylinder characterized by high smoothness. Their small
wear during break was stated. Advances in en -gine design led to the occurrence of seizing the
smooth surface of the cylinder. It was consid -ered that the resistance of the cylinder liner to seizure without additional surface treatment is greater with greater roughness height.
Howev-er, a significant increase in surface roughness is
also unfavorable: it calls for an increase in oil consumption and an increase wear of chromi-um-plated piston rings.
Smooth surface of the cylinder ensures their low wear during break-in, rough causes little
tendency to blur. In contrast, a smaller honing
angle reduces oil consumption (reduce
emis-sions of toxic components), what is an aim, es -pecially in engines with a spark self-ignition. Reduction of honing angle also reduces the
thickness of the oil film, leading to energy loss and wear increase. Due to the opposite effect on
the functional properties of high and low rough-ness height it became apparent search surfaces connecting sliding properties of smooth surfaces with high storage capacity of oil through the po-rous surfaces. This is how the structure of the cylinder surface are reached after two machining
treatments (“plateau” surfaces) [3, 4, 5].
The “plateau” structure combines the good
sliding properties of the smooth surface with good lubrication, which provide deep scratches, being
a kind of “pockets of oil” [3, 4, 5]. Relatively low
fuel consumption and engine oil contribute to the protection of the environment. Therefore, it aims to optimize the geometric structure of the surface of the cylinder liner.
Quality criteria for the cylinder surface are as follows:
• the corresponding value of the surface rough-ness parameters,
• the corresponding value of the angle of inter-section Figure 1a,
• regularly in both directions features honing, • the surface without distortion remaining after
its boring and without rolling of net of grooves, • outer layer not separated from the base
mate-rial [5, 6]
The value of the angle of intersecting
grooves should be 20°–40° measured from the
horizontal reference line. The angle of inter-secting grooves from the outside the specified range does not provide adequate lubrication of the cylinder liner and piston rings, which may
result in their premature wear. (Fig. 1a). More -over, scratches formed on the surface of the honed cylinder should be done symmetrically in both directions. Too broad and deep scratch-es or prevailing in only one direction can cause
the growth of oil consumption (Fig. 1b) [5, 6].
SOFTWARE FOR SURFACE MODELING
For surface modeling a computer program
Modeling_skr, which works in the MATLAB en -vironment was used. This program was developed
at the Department of Machine Tools and Mechani -cal Technology of Wroclaw University of Science and Technology. The program has been designed so that it was possible to simulate the interaction
of many factors affecting the constitution of tech
-nological surface layer occurring in different ma -terial removal processes and chipless machining processes. The program allows surface modeling by two methods:
• by mapping in shaped surface machining
marks in a continuous basis figures or geo -metric solids, so called as elementary shapes, which may be ellipse, ellipsoid, torus, pyra-mids, cones, or other optional components designed virtually or scanned, on the shape of the elementary can be superimposed, it can be enter the random noise of its size, height and position, with this method it can be simulate the formation of the surface obtained, eg. by means of turning, milling, grinding, honing; • by discrete “inprinting” in material elemen
-tary shapes in the form of figures or bodies de
-scribed above in a regular or random way, with the possibility of distortion of the position or size of elementary lumps with this method it can be simulate the formation of the surface obtained eg. by erosion treatments, sand blast-ing, shot peenblast-ing, burnishing.
The software allows for modeling of
rough-ness structures both 2D (single profiles) and 3D (surface fragments). This study describes only 2D
modeling.
Modeled surfaces can be repeatedly submit -ted with each other using mathematical functions: addition, subtraction, product, inversion, and the
choice of their maximum and minimum values.
This allows you to model and observe the chang-es in the geometry of the surface layer with over-lapping of successive machining operations.
An additional option enrichment developed
program is the ability to rotate modeled surface at any angle as in the direction of clockwise and in the opposite direction.
It is possible to send the modeled profile and the surface in the form of table to profilmeter to
calculate the parameters of surface roughness and generated surfaces waviness [8, 9, 10, 11].
ROUGHNESS PARAMETERS EVALUATION
INDICATORS FOR DESCRIPTION OF
GEOMETRIC MODELS PROFILE
To assess the suitability of individual roughness parameters to describe some geometric features of surface topography two indicators were used.
The first is the correlation coefficient ρ of the relationship between the two sets of data scaled
independently of the units of measurement. It
measures the strength of a linear relationship.
The properties of the correlation coefficient ρ: • is an absolute number;
• is in the range of <-1,1>;
• if ρ> 0, then for larger values of one feature
corresponds (average) greater values of the
second characteristic (dependence growing,
behave as properties);
• if ρ <0, then for values of one feature of the
corresponds(average) smaller values of the
second feature and vice versa (decreasing
re-lationship, features behave contrary);
• when ρ = 0, regardless of the values assumed by one of the features, the average value of the other features are the same – they are uncor-related;
Fig. 1. “Plateau” structure: a) the angle of intersection
of cracks, b) unidirectional grid pattern [7] a)
• correlation coefficient is a measure of the lin -ear relationship between features. When |ρ| is
closer to 1, the more “linear” is the relation -ship between features. [2, 8, 12, 13]
However, one should not draw conclusions
based on the value of the correlation coefficient
only. Therefore, trying to determine which of the roughness parameters describes best the change
in the characteristic profile also included evalu
-ation index takes into account the comparison of
percentage changes in the value of the test,
mod-eled profile feature witch change rates roughness
parameters. The following formula describes the dependence:
(1)
where: R max – maximum value of the examined
roughness parameter
R min – the minimum value of the exam -ined roughness parameter
R average – the average value of the exam -ined roughness parameters
Qualifying the roughness parameter, as one
that could be useful to describe the specific char
-acteristics of the roughness model taken into ac-count if the correlation coefficient ρ between the levels of the characteristic model, and the cor-responding parameters evaluated roughness is close to one and at the same time the increase in the value of the parameter t is greater than 30%
[2, 8, 14].
STAGES OF MODELING HONED SURFACE
To show the stages of modeling surface fin -ish after honing model was used, in which: step
along the x-axis is 0,1mm, disruption at 3%, and the characteristic grain size is 579μm, which is 550μm and 29μm respectively for rough honing and for the finish honing.
For creation of the final honed surface carry -ing several steps is necessary:
1. Modelling of the surface by using abrasive grains
for coarse honing with rotation angle 20°.
2. Modelling of the surface by using abrasive
grains for coarse honing treatment with rota-tion angle -20°.
3. The combination of an area of 1) and 2) using the “folding” function, to give the surface after
coarse honing.
4. Modelling of the surface by using abrasive grain for finishing honing treatment with ro ta-tion angle 20°.
5. Modelling of the surface using an abrasive grain for finishing honing treatment with -20°
angle of rotation.
6. The combination of 4) and 5) using the “fold
-ing” function, to give surface after finishing
honing.
7. The combination of surface 3) and 6) using the “folding” function to get the final surface after dual-procedure honing (Fig. 2).
SAMPLE TEST RESULTS
Variable grain size
For research surfaces with the changeable
size of the abrasive grain were chosen. In soft
-ware changeable size of elementar shape in the
x axis and in the z axis are on 5 levels which are
shown in sequential columns of Table 1. The
pro-file was shaped by moving, with the set step 0,1
mm, basic shape in the form of the ellipse. Dis-rupting are on 3% level.
Calculated 2D roughness parameters and in-dicators for assessing these parameters are given in Table 2.
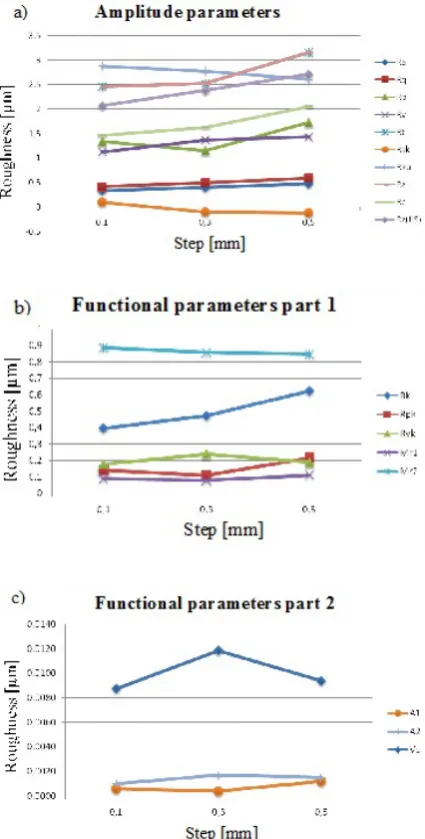
The correlation coefficient calculated for the
amplitude parameters tells us that the roughness parameters of this group are mostly correlated
with the size of the abrasive grain. After analysis
of factor t we confirm in above statement, because it is high practically in all parameters. The excep
-tion is the slope profile parameter Rku, which
correlation coefficient is 0,2 and the ratio t only
15%. Changes depending can best be seen in Fig -ure 3a. For parameter Rku change of the abrasive
Table 1. The abrasive grain size in the x-axis and z-axis
Rough honing
Characteristic dimension [μm] 2200 1100 550 280 130
x axis [mm] 0,7 0,4 0,2 0,09 0,04
z axis [μm] 1500 700 350 190 90
Finish honing
Characteristic dimension [μm] 53 45 29 17 13
x axis [mm] 0,018 0,015 0,01 0,006 0,004
z axis [μm] 35 30 19 11 9
Sum of the characteristic dimension [μm] 2253 1145 579 291 143
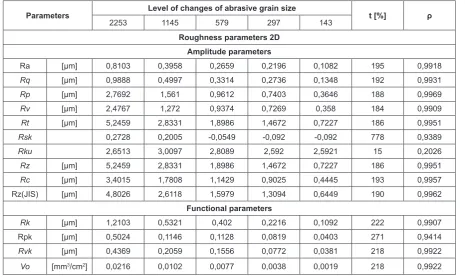
Table 2. Effect of abrasive grains size on roughness parameters 2D
Parameters Level of changes of abrasive grain size t [%] ρ
2253 1145 579 297 143
Roughness parameters 2D Amplitude parameters
Ra [µm] 0,8103 0,3958 0,2659 0,2196 0,1082 195 0,9918
Rq [µm] 0,9888 0,4997 0,3314 0,2736 0,1348 192 0,9931
Rp [µm] 2,7692 1,561 0,9612 0,7403 0,3646 188 0,9969
Rv [µm] 2,4767 1,272 0,9374 0,7269 0,358 184 0,9909
Rt [µm] 5,2459 2,8331 1,8986 1,4672 0,7227 186 0,9951
Rsk 0,2728 0,2005 -0,0549 -0,092 -0,092 778 0,9389
Rku 2,6513 3,0097 2,8089 2,592 2,5921 15 0,2026
Rz [µm] 5,2459 2,8331 1,8986 1,4672 0,7227 186 0,9951
Rc [µm] 3,4015 1,7808 1,1429 0,9025 0,4445 193 0,9957
Rz(JIS) [µm] 4,8026 2,6118 1,5979 1,3094 0,6449 190 0,9962
Functional parameters
Rk [µm] 1,2103 0,5321 0,402 0,2216 0,1092 222 0,9907
Rpk [µm] 0,5024 0,1146 0,1128 0,0819 0,0403 271 0,9414
Rvk [µm] 0,4369 0,2059 0,1556 0,0772 0,0381 218 0,9922
grains size slightly affects on the surface rough
-ness. Line picturing this is nearly parallel to the
x-axis and shows minimal variations. Significant
changes in the roughness can be see for parameter Rz, Rt and Rz (JIS). With the value of the
correla-tion coefficient and the ratio t also parameters Rc
and Rp are important. The biggest value t was cal-culated for the asymmetry parameter Rsk despite
lower correlation coefficient (as compared with other parameters), it was considered appropriate
to describe the surface with varying size of the abrasive grain.
In the group of functional parameters the cor
-relation coefficient closest to 1 was calculated for
the parameters: Rk, Rvk and Vo. On the basis of the indicator parameter t, Rpk can also be
use-ful in describing the surface after finish honing. Material shares (Mr1, Mr2) and surface recesses
and valleys (A1, A2), does not show practically
any changes depending on the changing abrasive grain size. Parameter Vo due to the fact that it is calculated on the basis of Rvk becomes important. The dependence of the functional parameters of roughness and the abrasive grain size is shown in Figure 3b and c. Summing up the results of re-search 2D roughness it can be concluded that a reduction of the abrasive grain size, which is el-ementary shape size, decreased all the amplitude parameters. However, there was little correlation
coefficient value of skewness Rsk and kurtosis
Fig. 3. The dependence of the roughness parameters from variable abrasive grain size
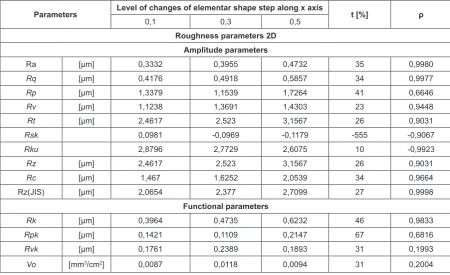
Fig. 4. The dependence of the roughness parameters for the modeled step size (a variable peripheral speed
Rku. Changing the size of the abrasive grain can not be described by these parameters.
Group of functional parameters have impor-tant parameters to describe the modeled surfaces.
High correlation coefficient has a core depth Rk
and reduced depth of the cavities Rvk. Due to the
fact that it is flat - top surface correlation coeffi -cient for reduced heights peak Rpk is slightly low-er, although the percentage indicator t is high that is why this was a useful parameter to describe the modeled changes. Vo parameter that is the volume of oil also deserves attention, but please remem-ber that it is calculated on the basis Rvk. Other
roughness parameters, due to the low coefficient
of correlation or a small value of t is less useful to the description of the modeled changes in the
roughness profile.
Variable peripheral speed
For researches surfaces with a variable step
size of the elementar shape of along the x-axis is selected. This value reflects the variable periph -eral speed. The higher the periph-eral speed is the lower step is, because traces of processing on the
large degree are overlapping each other. Profile
was modeled by displacement with a given step
elementary shape in a form of an ellipse in axes x = 0,21mm, z = 369μm. Step of displacement of elementar shape along the x-axis was adopted at
Table 3. Influence of the step size of the elementar shape along the x axis on roughness parameters 2D
Parameters Level of changes of elementar shape step along x axis t [%] ρ
0,1 0,3 0,5
Roughness parameters 2D Amplitude parameters
Ra [µm] 0,3332 0,3955 0,4732 35 0,9980
Rq [µm] 0,4176 0,4918 0,5857 34 0,9977
Rp [µm] 1,3379 1,1539 1,7264 41 0,6646
Rv [µm] 1,1238 1,3691 1,4303 23 0,9448
Rt [µm] 2,4617 2,523 3,1567 26 0,9031
Rsk 0,0981 -0,0969 -0,1179 -555 -0,9067
Rku 2,8796 2,7729 2,6075 10 -0,9923
Rz [µm] 2,4617 2,523 3,1567 26 0,9031
Rc [µm] 1,467 1,6252 2,0539 34 0,9664
Rz(JIS) [µm] 2,0654 2,377 2,7099 27 0,9998
Functional parameters
Rk [µm] 0,3964 0,4735 0,6232 46 0,9833
Rpk [µm] 0,1421 0,1109 0,2147 67 0,6816
Rvk [µm] 0,1761 0,2389 0,1893 31 0,1993
Vo [mm3/cm2] 0,0087 0,0118 0,0094 31 0,2004
three levels: 0,1mm; 0,3mm; 0,5mm. Interference at 4% (Table 3).
The height of the correlation coefficient cal -culated for the amplitude parameters can distin-guish the following parameters: Ra, Rq, Rku and Rz (JIS). However, after further analysis of factor t of these parameters as important for the descrip-tion of the changes, Rku parameter is rejected (t =
10%). The biggest value of t factor was calculated
for the parameter Rsk, however, due to a lower
correlation coefficient (as compared with other parameters) could not be considered as signifi
-cant. In the group of functional parameters cor
-relation coefficient closest to 1 is calculated only
for the parameter Rk. Depth of the core Rk be-comes useful to describe the changes in the mod-eled surfaces for the variable shape step size of
elementar parameter along the x-axis.
For all other parameters, the correlation
coef-ficient is lower. Percentage changes of indicator t for other parameters are also insignificant. The
dependence of the roughness and the step size is
shown in Figure 4.
Analyzing the obtained results of 2D rough -ness it can be concluded that an increase of the
step elementar shape along the x-axis, all param -eters increased amplitude param-eters. However, not all parameters of the value of the correlation
modeled changes can be described by the follow-ing parameters: Ra, Rq and Rz (JIS). Rku kurtosis,
despite the high correlation coefficient, was con
-sidered as not significant in the description due
to the low percentage change of t. In the group of functional parameters high correlation coefficient and significant volume of index t has only a depth of core Rk. This parameter is therefore useful in de-scribing surface changes. Other roughness
param-eters, due to the low coefficient of correlation or a
small value of t are less useful to the description of
the modeled changes in the roughness profile.
CONCLUSIONS
Mathematical modeling of geometrical char -acteristics of the surfaces can not fully replace the
experimental studies, but in many cases allows
for acceleration of parametric evaluation of the surface. Surface models are irreplaceable in cases
where the receipt of actual roughness profiles is too expensive or impossible to achieve by modern methods of machining. Article shows that bas -ing on the very simple functions and
mathemati-cal operations to model even the most complex
surfaces, including the surfaces of topographies similar to those obtained in real conditions.
Computer program presented in work is a mathematical tool that allows for rapid
prototyp-ing, basically of any surface. It has a very high
potential for shaping the models even very
com-plex topographies with a high degree of similar
-ity to the real surfaces. It can be useful in con -ducting analytical research and during develop-ing of shapdevelop-ing technologies of surface functional
characteristics in industrial environments. Its use should simplify, accelerate and expand the capa -bilities of assessing the suitability of roughness
parameters for describing the specific character -istics of the surface shape.
REFERENCES
1. Buj-Corral I., Vivancos-Calvet J.,
Rodero-de-Lamo L. and Marco-Almagro Ll. Comparison between mathematical models for roughness ob-tained in test machine and in industrial machine in
semifinish honing processes. Procedia
Engineer-ing, 132, 2015, 545–552.
2. Cichosz P. and Kowalski M. Modelowanie matematyczne topografii powierzchni płaskowierzchołkowych typu „plateau”. XXVII
Naukowa Szkoła Obróbki Ściernej. Koszalin-Sar
-binowo. Zeszyty Naukowe Wydziału Mechanicz
-nego, Politechnika Koszalińska, 2004 195–202.
3. Buj-Coral I., Vivancos-Calvet J. and Coba Salcedo
M. Use of roughness probability parameters to
quantify the material removed in plateau-honing.
International Journal of Machine Tools and Manu -facture, 50(7), 2010, 621–629.
4. Cabanettes F., Dimkovski Z. and Rosén B.-G.
Roughness variations in cylinder liners induced
by honing tools’ wear. Precision Engineering, 41, 2015, 40–46.
5. Resizer R. and Pawlus P. Modelowanie profile nierówności powierzchni cylindrów po gładzeniu płaskowierzchołkowym. Pomiary Automatyka Ro
-botyka, 6, 2012, 64–69.
6. Pawlus P., Cieslak T. and Mathia T. The study of
cylinder liner plateau honing process. Journal of
Materials Processing Technology, 209(20), 2009, 6078–6086.
7. Sunnen AG Official Website, (www.sunnen.pl).
8. Cichosz P., Kowalski M. and Kuzinowski M. Matematicko modelirane na topografijata na deter -ministicki povrsini. Matematyczne modelowanie topografii powierzchni zdeterminowanych.
Scien-tific conference with international participation. Conference proceedings. University “Ss. Cyril and Methodius”, Skopje, Republic of Macedonia, 2004, 106–111.
9. Sadílek M., Kratochvíl J., Petrů J., Cep R., Zlámal T. and Stančeková D. Cutting tool wear monitoring
with the use of impedance layers. Tehnicki
Vjesn-ik, 21(3), 2014, 639–644.
10. Goeldel B., El Mansori M. and Dumur D. Simula
-tion of roughness and surface texture evolu-tion at
macroscopic scale during cylinder honing process.
Procedia CIRP, 8, 2013, 27–32.
11. Sivatte-Adroer M., Llanas-Parra X., Buj-Corral I. and Vivancos-Calvet J. Indirect model for rough
-ness in rough honing processes based on artificial
neural networks. Precision Engineering, 43(1), 2016, 505–513.
12. Deepak Lawrence K. and Ramamoorthy B.
Multi-surface topography targeted plateau honing for the processing of cylinder liner surfaces of automo-tive engines.Applied Surface Science, 365, 2016,
19–30.
13. Fulemová J. and Řehoř J. Influence of form factor of the cutting edge on tool life during finishing mil
-ling. Procedia Engineering. Vídeň, Elsevier, 2015,
682–688.
14. Valášek P., Müller M. and Hloch S. Recycling of corundum particles – two-body abrasive wear of polymeric composites based on waste. Tehnicki
![Fig. 1. “Plateau” structure: a) the angle of intersection of cracks, b) unidirectional grid pattern [7]](https://thumb-us.123doks.com/thumbv2/123dok_us/8808137.1775691/3.595.74.284.71.356/fig-plateau-structure-angle-intersection-cracks-unidirectional-pattern.webp)