_____________________________________________________________________________________________________
*Corresponding author: Email: ochelleogbu1989@gmail.com;
Quality Characteristics of Bread from Wheat and
Garden Peas Flours
M. T. Ukeyima
1, H. Agoh
1and P. O. Ochelle
1*1Department of Food Science and Technology, University of Agriculture, Makurdi, Nigeria.
Authors’ contributions
This work was carried out in collaboration among all authors. All authors read and approved the final manuscript.
Article Information
DOI: 10.9734/EJNFS/2019/v10i330115 Editor(s): (1) Dr. Kristina Mastanjevic, Assistant Professor, Department of Process Engineering, Faculty of Food Technology,
Josip Juraj Strossmayer, University of Osijek, Croatia. Reviewers: (1) Ajay Singh, Sant Longowal, Institute of Engineering and Technology, India. (2) Ioana Stanciu, University of Bucharest, Romania. Complete Peer review History:http://www.sdiarticle4.com/review-history/51366
Received 01July 2019 Accepted 04 September 2019 Published 21 October 2019
ABSTRACT
The functional, physicochemical and sensory evaluation of bread from wheat and garden peas flours were investigated. Five (5) bread samples were produced from the proportion of wheat and garden pea flours as 90%:10% (B), 80%:20% (C), 70%:30% (D), 60%:40% (E) and 100% wheat was the control sample (A) using standard methods. All the functional parameters differed (p≤0.05) significantly. The moisture, crude protein, crude fat, Ash and crude fiber increased (p≤0.05) significantly while the carbohydrate content decrease (p≤0.05) significantly with corresponding increase in the percentage of the composite flour from 10-40%. The result of the physical properties showed that there was a significant difference in all the physical parameters. Also, sensory results showed that there were significant differences in all the sensory scores. However, consumers preferred the bread from 100% wheat flour and 90% and 10% (Sample B) of wheat and garden peas flours substitution.
Keywords: Wheat and garden peas flours; functional analysis; proximate analysis; physical analysis; sensory attributes.
1. INTRODUCTION
Bread is one of the most important staple foods and the second most widely consumed non-indigenous food products after rice in Nigeria [1]. It is one of the many convenient breakfast foods widely consumed by both old and young people in Nigeria [2]. Bread is a fermented confectionary product produced mainly from wheat flour, water, yeast and salt by series of processes involving mixing, kneading, proofing, moulding and baking [3]. The word bread is used to describe the whole range of different bread varieties which may vary in weight, shape, crust hardness, crumb cell structure, softness, colour and eating quality [4]. Wheat is the conventional flour used in the production of bread in Nigeria. It is however expensive because it is not grown in Nigeria due to unfavourable climatic conditions. It is imported from other countries using huge foreign exchange. Cases of increased number of people with celiac disease have been recorded Segura and Rosella [5] and Sampath et al. [6]. In the last few years, there is an increased trend towards healthy eating which has resulted in the development of many novel functional foods including use of other locally available crops for bread production. Partial or total substitution of wheat flour with the other cereals, legumes and fruits in non-wheat producing countries like Nigeria is on record [7,8,9]. The use of local agricultural fruit such garden peas fruit in bread production would diversify their use; enhance value addition and nutrients of the bread.
Peas are cool-season crop grown for their edible seed or seed pods [10]. Garden or green peas are recognized as nutritious sources of high quality plant-based protein rich in fiber, protein, Vitamin A, Vitamin B6, vitamin C, vitamin K, phosphorus, magnesium, copper, iron, zinc and lutein [11]. The high nutrient density of peas make them a valuable food commodity capable of meeting the dietary needs of the estimated 800-900 million undernourished individuals worldwide [12].
Previous studies have shown the incorporation of non-wheat flours in bread production.
Greene and Bovel-Benjamin [13] investigated the microscopic and sensory properties of bread supplemented with sweet potato and found that substitution level of 65% can be used in bread making.
Furthermore [14] evaluated the production of sour maize bread using soybean flour blends.
These workers suggested the addition of not more than 10% protein supplement in the form of soybean flour or other legumes (with amino acid profile comparable to that of soybean) is expected to give nutritionally balanced and acceptable maize-bread.
Composite flour technology refers to the process of mixing various flours from tubers with cereals or legumes with or without the addition of wheat flour in proper proportions to make use of local cultivated crops to produce high quality food products [15]. The incorporation of garden peas flour in wheat flour for the production of bread would increase the protein and nutrient contents of the bread, diversify the use of the crops, encourage farmers to produce local crops which would boost their economic power, add value to the local crops, reduce total dependence on imported wheat flour and save foreign exchange for Nigeria. The aim of the research was to produce bread from composite flour of wheat and garden peas flours, to determine the functional properties of the composite flour as well as the physicochemical and sensory properties of the bread.
2. SUBJECTS/MATERIALS AND
METHODS
Wheat and garden peas flours, margarine, sugar, water, yeast and salt were obtained from North Bank Market, Makurdi, Nigeria.
2.1 Flow Chart for the Preparation of Garden Peas Flour
Garden Pea flour was prepared according to the modified method of Uchechukwu et al. [16]. The flow chart for the production of Garden pea flour is shown in Fig. 1.
2.2 Composite Flour Preparation
Composite flour was prepared according to the modified method Igbabul et al. [17] as shown in Fig. 2.
2.3 Blend Formulation of Wheat and Garden Pea Flours
were packaged in black low density polyethylene bags and stored at room temperature until use for analyses and bread production.
2.4 Baking Process
The five blends of composite flour were baked into bread using the method of Badifu and Akaa [18]. The wheat flour and composite flour were mixed with 2.5 g salt, 5 g yeast, 40 g sugar and 20 g fat in 250 ml water followed by manual mixing for 5 min to obtain adough. The dough was kneaded for some minutes. The kneaded dough was transferred into the baking pans greased with plasticized fat and covered with basins. The dough was allowed to ferment for 35 mins at room temperature in the baking pans. The fermented dough was then allowed to undergo proofing for (25min) at relative humidity. The bread samples were cooled to room temperature and used for analysis.
Fig. 1. Flow chart for production of garden peas flour
Source: [16]
2.5 Determination of the Functional Properties of Wheat and Garden Peas Composite Flour
The method of AOAC [19] was used to determine the bulk density of the composite flours. A 10 ml capacity graduated measuring
cylinder was gently filled with the sample and the bottom of the cylinder was tapped on the laboratory bench several times until there was no further dimunition of the sample level after filling to the 10ml mark. Foaming capacity (FC) was determined according to Narayana and Narsinga [20]. One gram flour sample was added to 50 ml distilled water at ambient temperature in a graduated cylinder. The suspension were mixed and shaken for 5min to foam. The volume of foam at 30secs after whipping was expressed as foam capacity. Swelling index was determined according to the method of AOAC [19]. One gram of the sample was poured into a 10 ml measuring cylinder and the volume it occupied recorded. Distilled water was added up to the 10 ml mark and the measuring cylinder allowed to stand for 45min, after which the new volume of flour was recorded. The ratio of the initial volume to the final volume gave the swelling index and Gelation capacity was determined by the method of Onwuka [21]. Suspensions of samples in 5 ml of distilled water in test tubes were prepared using 2-20% (W/V) of the samples in 5 ml of distilled water in test tubes. The sample test tubes were heated for an hour in a boiling water bath followed by rapid cooling under running cold tap water. The test tubes were further cooled for 2 hours at 4ºC to get the gelation capacity for each sample.
2.6 Determination of the Proximate Composition of Bread from Wheat and Garden Peas Flours
alkali hydrolysis. While Carbohydrate content was determined by difference according to Ihekoronye and Ngoddy [22] as thus:
% ℎ = 100 − (% +
% + % + % ℎ + % )
Fig. 2. Flow chart for the production of composite flours
Source: [17]
2.7 Determination of Physical Properties of Dough and Bread Loaves
Dough development in terms of increase in volume as affected by fermentation was determined according [22]; a portion of the dough was placed inside a 500 ml graduated beaker and placed on level surface (laboratory table). Initial and final volume at the beginning and end of fermentation was determined.
Fermentation and proofing rates were calculated by dividing the average volume increase due to fermentation [23]. Bread characteristics were evaluated by measuring the loaf weight, loaf volume and specific volume. Loaf weight was measured 30 minutes after the loaves were removed from the oven using a weighing balance whereas loaf volume was measured using the rapeseed displacement method as modified by Giami et al. [24] as follows: A weighed loaf was placed in the container and the weighed seeds was used to fill the container and leveled off as before. The overspill was weighed and from the weight obtained, volume of seed displaced by the loaf was then calculated. The specific volume was determined by dividing the loaf volume by its corresponding loaf weight (cm3/g).
2.8 Sensory Evaluation of the Bread Samples
The sensory evaluation of the breads including the one made from 100% wheat flour and the composite flours were evaluated for texture, flavour, aroma, crust colour, crumb colour and general acceptability of the product by a 20 man panel on a 9 point hedonic scale to obtain a duplicate (1=extremely disliked and 9= extremely liked) as described by Iwe [25].
2.9 Statistical Analysis
Data obtained was subjected to Analysis of Variance (ANOVA) followed by Duncan’s new multiple range test (DNMRT) to compare treatment means. Statistical significance was accepted at (p≥0.05) [26].
3. RESULTS AND DISCUSSION
3.1 Functional Properties of Wheat and Garden Peas Composite Flour
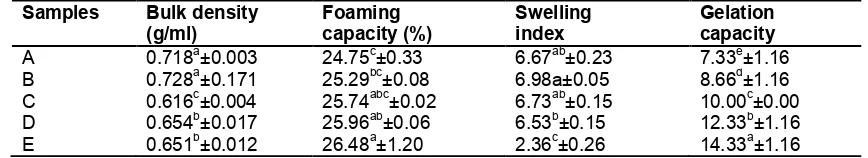
Decrease in swelling index was attributed to the weak bond forces in garden pea flour. Also, Variation in gelation capacity among the samples was attributed to compositional differences with respect to their starch content.
3.2 Results of Proximate Composition of Bread from Wheat and Garden Peas Flours
The proximate composition of bread samples is presented in Table 2. The moisture, crude protein, crude fat, Ash and crude fiber increased (p≤0.05) significantly with increase substitution of 10-40% garden peas flour. The moisture content varied from 18.88-28.88%, protein from 13.25-16.16%, fat 5.11-6.89%, Ash 5.67-6.87% and fiber 1.20-1.71% respectively. The increase in ash and fiber content of the bread samples may be attributed to high ash content of the garden peas flour which indicates the high mineral contents in it. While the carbohydrates content on the other hand decreased (p≤0.05) significantly with increase in garden peas substitution. The lower content of carbohydrate in the composite flour could be due to addition of
garden peas flour. This result is similar with the one reported by Islam et al. [28].
3.3 Physical Properties of Dough and Bread Loaves
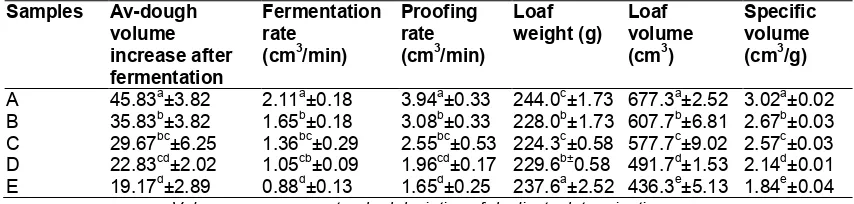
Results of the physical properties of dough and bread samples is presented in Table 3. The average dough volume decrease as the concentration of garden peas flour increase with respect to fermentation and proofing rates. The values decrease from 45.83-19.17 cm3 as the proportion of garden peas flour increased after 35min of fermentation and the rate of fermentation and proofing decreased from 2.11-0.88 cm3/min and 3.94-1.65 cm3/min. The result is in line with Olaoye et al. [29]. The loaf volume and specific volume was observed to decreased (p≤0.05) significantly this could be due to reduction of the quantity of gluten in the dough with addition of composite flour resulting to less retention of carbon dioxide. The loaf weight was also found to decrease with increasing proportion of garden peas flour increased from 10-40%. This result is similar with the one reported by Bojnanska et al. [30].
Table 1. Functional properties of wheat and garden peas flours
Samples Bulk density
(g/ml)
Foaming capacity (%)
Swelling index
Gelation capacity
A 0.718a±0.003 24.75c±0.33 6.67ab±0.23 7.33e±1.16 B 0.728a±0.171 25.29bc±0.08 6.98a±0.05 8.66d±1.16 C 0.616c±0.004 25.74abc±0.02 6.73ab±0.15 10.00c±0.00 D 0.654b±0.017 25.96ab±0.06 6.53b±0.15 12.33b±1.16 E 0.651b±0.012 26.48a±1.20 2.36c±0.26 14.33a±1.16
Values are means ± standard deviation of duplicate determinations
Means with same superscript down the column are not significantly (P≥0.05) different
Keys: A = (100 % Wheat flour control), B = (90% wheat and 10% garden peas flours), C = (80 % Wheat and 20% garden peas four), D = (70 % wheat and 30 % garden peas flours) and E = (60 % wheat and 40% garden
peas flours)
Table 2. Percentage proximate composition of bread from wheat and garden peas composite flour
Samples Moisture Protein Fat Ash Fiber Carbohydrate
A 18.88d±0.14 13.25e±0.02 5.11e±0.02 5.67e±0.03 1.20e±0.02 74.75a±0.02 B 19.16d±0.07 13.86d±0.02 6.04d±0.01 5.81d±0.01 1.35d±0.01 72.95b±0.02 C 22.16c±0.03 14.84c±0.13 6.27c±0.03 6.09c±0.01 1.52c±0.02 71.29c±0.13 D 26.57d±1.28 15.66d±0.02 6.77b±0.02 6.36b±0.01 1.65b±0.02 69.58d±0.02 E 28.88e±0.66 16.16e±0.18 6.89a±0.76 6.87a±0.02 1.71a±0.06 68.42e±0.09
Values are means ± standard deviation of duplicate determinations
Means with same superscript down the column are not significantly (P≥0.05) different
Keys: A = (100 % Wheat flour control), B = (90% wheat and 10% garden Peas flours), C = (80 % Wheat and 20% garden peas four), D = (70 % wheat and 30 % garden Peas flours) and E = (60 % Wheat and 40% Garden
Table 3. Physical characteristics of dough and bread from wheat and garden peas flour
Samples Av-dough
volume increase after fermentation
Fermentation rate
(cm3/min)
Proofing rate (cm3/min)
Loaf
weight (g) Loaf volume (cm3)
Specific volume (cm3/g)
A 45.83a±3.82 2.11a±0.18 3.94a±0.33 244.0c±1.73 677.3a±2.52 3.02a±0.02 B 35.83b±3.82 1.65b±0.18 3.08b±0.33 228.0b±1.73 607.7b±6.81 2.67b±0.03 C 29.67bc±6.25 1.36bc±0.29 2.55bc±0.53 224.3c±0.58 577.7c±9.02 2.57c±0.03 D 22.83cd±2.02 1.05cb±0.09 1.96cd±0.17 229.6b±0.58 491.7d±1.53 2.14d±0.01 E 19.17d±2.89 0.88d±0.13 1.65d±0.25 237.6a±2.52 436.3e±5.13 1.84e±0.04
Values are means ± standard deviation of duplicate determinations
Means with same superscript down the column are not significantly (P≥0.05) different
Keys: A = (100 % Wheat flour control), B = (90% wheat and 10% garden peas flours), C = (80 % wheat and 20% garden peas four), D = (70 % wheat and 30 % garden peas flours) and E = (60 % wheat and 40%
garden peas flours)
Table 4. Sensory evaluation of bread from wheat and garden peas composite flour
Samples Taste Flavour Texture Crumb colour
Crust colour Overall acceptability
A 7.73ab±1.4 8.07a±1.03 7.33ab±1.16 8.00a±1.25 7.93a±1.22 8.00a±1.19 B 8.07a±1.3 7.53a±1.69 8.20a±1.08 8.00a±1.41 7.47ab±2.20 7.87ab±1.64 C 7.47ab±0.8 7.33ab±0.81 7.47abc±1.00 7.53ab±1.10 7.67ab±0.81 7.40c±0.91 D 7.20ab±1.4 7.20ab±1.11 6.93bc±1.79 7.07ab±1.62 7.07ab±1.84 7.20d±2.01 E 6.93b±1.4 6.47b±1.88 6.67c±1.63 6.53b±2.23 6.73b±1.49 6.87d±1.46
Values are means ± standard deviation of duplicate determinations
Means with same superscript down the column are not significantly (P≥0.05) different
Keys: A= (100% Wheat flour control), B = (90% wheat and 10% garden peas flours), C = (80% wheat and 20% garden peas four), D = (70% Wheat and 30% garden peas flours) and E = (60% wheat and 40% garden peas
flours)
3.4 Sensory Scores of Bread Loaves
Result of the sensory attributes of Bread made from wheat and soybean composite flour is presented in Table 4. The mean sensory scores for the taste ranged between 6.87 to 8.00. Sample B had the highest taste score (8.07). However, the taste scores decreased (p≤0.05) significantly with increase in the quantity of garden pea flours. Taste is an important sensory attributes of any food. The consumption of bread is often enhanced by taste Sim and Nya [31]. The decrease in taste score maybe due to the change in taste sensation due to increased quantity of garden peas flour and flavour ranged between 6.47-8.07. The scores for texture, crumb colour and crust colour varied between 6.67-7.33, 6.53-8.00 and 6.73-7.93 respectively. In terms of the overall acceptability, the mean scores ranged between 6.87-8.00. There was significant (p≤0.05) difference in all the sensory attributes and their scores decreased with addition of garden peas flour. The decrease in the scores for texture with addition of garden peas flour was found to correlate with the decrease in overall acceptability of the bread.
Sample A with 100% followed by 90% wheat flour and 10% garden peas flour had the highest sensory scores for all the sensory attributes.
4. CONCLUSION
COMPETING INTERESTS
Authors have declared that no competing interests exist.
REFERENCES
1. Shittu TA, Raji AO, Sanni LO. Bread from composite cassava wheat flour: I. Effect of baking time and temperature on some physical properties of bread loaf. Food Research International. 2007;40: 280–290. 2. Gernah DI, Ukeyima TM, Azenda NT. Effect of Vitamin C addition on some quality aspects of wheat bread. Nigerian Journal of Nutritional Sciences. 2012;33 (1):37-41.
3. Deweettinck K, Van-Bockstaele F, Kuhne B, Walle CT, Gellynck X. Nutritional value of bread: Influence of processing, food interaction and consumer perception. Rev. J. Cereal Sci. 2008;48:243-257.
4. Ochelle PO, Ibrahim S, Ukeyima MT. Effect of water yam and soybean composite flour addition on the quality of wheat based Bread. International Journal of Science and Research. 2019;3:1-3. 5. Segura MEM, Rosell CM. Chemical
composition and starch digestibility of different gluten free breads. Plant Foods for Human Nutrition. 2011;66:224-230. 6. Sampath Kumar KP, Debjit Bhowmik,
Duraivel S, Umadev M. Traditional and medicinal uses of banana. Journal of Pharmacognosy and Phytochemistry. 2012;1(3):51-63.
7. Badifu GIO, Chima CE, Ajayi YI, Ogori AF. Influence of mango mesocarp flour supplementationto micronutrient, physical and organoleptic quality of wheat based bread. Nig. Food J. 2005;23:59-67 8. Igbabul BD, Adole D, Sule S. Proximate
composition, functional and sensory properties of Bambara Nut (Voandzeia subterranean), Cassava (Manihot esculentus) and Soybean (Glycine max) Flour Blends for “Akpekpa” Production. Current Research in Nutrition and Food Science. 2013;1(2):147-155.
9. Ameh MO, Gernah DI, Igbabul BD. Physico-chemical and sensory evaluation of wheat bread supplemented with stabilized undefeated rice bran. Journal Food and Nutrition Sciences. 2013;4:43-48.
10. Brijesh KT, Aoife G, Irian M. Pulse foods: Processing Quality and Nutraceutical Applications; 2011.
11. Powall TL, Udenigwe CC, Aluko RE. Amino acid composition and anti-oxidant properties of pea seed (Pisum saturum L.) enzymatic protein hydrolysate fractions. Journal of Agricultural and Food Chemistry. 2010;55(8):4712-4718.
12. Wendy JD, Lauren MF, Robert TT. Review of the health benefits of peas (Pisum sativum L.). British journal of Nutrition. 2011;3(1):22.
13. Greene JL, Bovel-Benjamin AG. Microscopic and sensory evaluation of bread supplemented with sweet potato flour. J. Food Science, 2004;69:167-173. 14. Ederma MO, Sanni LO, Sanni AI.
Evaluation of maize soybean flour blends for sour dough maize bread production in Nigeria. African Journal of Biotechnology. 2005;14(9):911-918.
15. Tharise N, Julianti E, Nurminah M. Evaluation of physico-chemical and functional properties of composite flour from cassava, rice, potato, soybean and xanthan gum as alternative of wheat flour. International Food Research Journal. 2014; 21(40):1641-1649.
16. Uchechukwu IO, Adebunkole MO, Adewale OO, Mobolaji OB, Samuel AOA. Nutritional composition and antinutritional properties of maize ogi cofermented with pigeon pea. Food Science and Nutrition Journal. 2017;6:424-439.
17. Igbabul BD, Amove J, Okoh Abah. Quality evaluation of composite bread produced from wheat, defatted soy and banana flours. International Journal of Nutrition and Food Science. 2014;3(5):471-476. 18. Badifu GIO, Aka S. Evaluation of
performance of shea fat as a shortening in bread making. Journal of Food Science and Technology. 2001;39:149-151. 19. AOAC. Official Methods of Analysis, 17th
Ed. Association of Official Analytical Chemists, AOAC International, Gaithersburg, MD, USA; 2012.
20. Narayana K, Narasinga M. Functional properties of raw and heat processed winged bean flour; 1982.
21. Onwuka GI. Food Analysis and Instrumentation: Theory and Practice. Surulere: Naphthali Prints. 2005;89(97): 133-139.
23. Chauhan GS, Zilliman RR, Eskin NAM. Dough mixing and bread making properties of quimoa-wheat flour bends. Int. J. Food Science and Tech. 1992;27: 701-705.
24. Giami SY, Amasisi T, Ekiyor G. Comparison of bread making properties of composite flour from kernels of roasted and boiled African breadfruit (Treculia africana Decne) seeds. Journal Raw Material Resources. 2004;1:16–25. 25. Iwe MO. Handbook of sensory methods
and analysis. Projoint Communications Services Ltd, Enugu. 2002;70-72.
26. Steele RGD, Torrie JH. Principles and procedures of statistics. 2nd Ed. McGraw hill book co. Inc.New York; 1980.
27. Nwosu JN, Owuamanam CI, Omeire GC, Eke CC. Quality parameters of Bread from substitution of wheat flour with Cassava flour using Soybean as improver.
American Journal of Research Communication; 2014.
28. Islam T, Chowdhury A, Islam M. Standardization of bread preparation from soy flour. International Journal of Sustainable Crop Production. 2007;2:15-20.
29. Olaoye OA, Onilude AA, Idowu OA. Quality characteristics of bread production from composite flours of wheat, plantain and soybean. African Journal of Biotechnology. 2006;11:1102-1106.
30. Bojnanska T, Francakova H, Liskova M, Tokar M. Legumes. The alternatives raw materials for bread production. Journal of Microbiology, Biotechnology and Food Science. 2012;1:876-886.
31. Sim J, Nya T. Eating qualities of muffins prepared with 10% and 30% soy flour. J. Nutr Recipe Menu Dev. 2001;3:2.
© 2019 Ukeyima et al.; This is an Open Access article distributed under the terms of the Creative Commons Attribution License
(http://creativecommons.org/licenses/by/4.0), which permits unrestricted use, distribution, and reproduction in any medium,
provided the original work is properly cited.
Peer-review history: