_____________________________________________________________________________________________________ 7(1): 84-100, 2017; Article no.EJNFS.2017.005
ISSN: 2347-5641
Extraction and Concentration of Bioactive
Compounds of Cola nitida Using Membrane
Processes: Analysis of Operating Parameters and
Membrane Fouling
Yves Nyamien
1,2*, Marie-Pierre Belleville
2, Adama Coulibaly
3, Augustin Adima
4and Godi Henri Biego
11
Laboratory of Biochemistry and Food Science, Training and Research Unit of Biosciences, Felix HOUPHOUËT-BOIGNY University, Abidjan, 22 BP 582 Abidjan 22, Côte d’Ivoire.
2Institut Européen des Membranes, IEM, UMR-5635, Université de Montpellier, ENSCM, CNRS,
Place Eugène Bataillon, 34095 Montpellier Cededx 5, France.
3
Training and Research Unit of Biological Sciences, Peleforo Gon Coulibaly University, BP 1328 Korhogo, Côte d’Ivoire.
4Laboratory of Water Chemistry and Natural Substance, Training and Research Department of GCAA,
Felix Houphouët-Boigny National Polytechnic Institute, BP 1093 Yamoussoukro, Côte d’Ivoire.
Authors’ contributions
This work was carried out in collaboration between all authors. Author YN designed the study, performed the statistical analysis, wrote the protocol and wrote the first draft of the manuscript. Authors MPB, AC, AA and GHB managed the analyses of the study. Author YN managed the literature searches. All authors read and approved the final manuscript.
Article Information
DOI: 10.9734/EJNFS/2017/34857
Received 15th June 2017 Accepted 28th June 2017 Published 11th July 2017
ABSTRACT
Aims: Kola nut is a natural product that is rich in biological active compounds. This work was aimed at evaluating the potential of an integrated system based on the combination of membrane processes for the purification and concentration of kola extract bioactive compounds.
Place and Duration of Study: Mature kola seeds were collected in October 2014-February 2015 in South of Côte d’Ivoire and the membranes performances were carried out from May to November 2016 at the European Institute of Membranes, France.
Methodology: Kola extract obtained by ethanol-water mixture were clarified by Microfiltration (0.2 µm) and Ultrafiltration (5, 15 and 50 kDa). The choice of ultrafiltration membrane was carried out on a pseudo-tangential pilot and membranes chosen are characterized and validated on a
Nyamien et al.; EJNFS, 7(1): 84-100, 2017; Article no.EJNFS.2017.005
tangential filtration pilot before the concentration of the extracts by nanofiltration (200-400 Da). The effect of crossflow velocity and transmembrane pressure was performed in recycle mode for each membrane. Fractions coming from the membrane processes were analyzed for their content in total polyphenols, proteins, caffeine, catechin and epicatechin.
Results: Microfiltration (0.2 µm) coupled with ultrafiltration (50 kDa) produced the purified extract and was submitted to a nanofiltration process to produce a concentrated fraction enriched in active compounds such as polyphenols and caffeine. Permeate flux significantly decreased with time until a steady-state was established due to the membrane fouling. The high retention of proteins in microfiltration (35.71%) and ultrafiltration (35.29%) favors a purity gain of the compounds of interest suh as total polyphenols, caffeine and catechin. However, there is a loss of total polyphenols during ultrafiltration step due to its high retention (29.17%). This result in a low concentration factor in the final retentate (2.56) during the coupling of microfiltration/ ultrafiltration/nanofiltration compared to that observed during the direct concentration of the crude extract (4.27). The opposite is observed for caffeine, catechin and epicatechin.
Conclusion: The membrane processes favor the purification and concentration of the bioactive compounds of Cola nitida nuts. However, the ultrafiltration step has the disadvantage of retaining a high proportion of polyphenols and therefore of reducing the antioxidant capacity of the final product.
Keywords: Cola nitida; kola extract; microfiltration; ultrafilitration; nanofiltration; membrane fouling.
1. INTRODUCTION
In the last decade there has been an increased interest in the extraction and separation of natural compounds with biological activity and potential benefits for human health [1-3]. Thus, the recovery of natural extract has been implemented successfully and has attracted considerable economical interest. Polyphenols are the most abundant antioxidants in human diet and the largest and best studied class of polyphenols is flavonoids, which include several thousand compounds [4-6]. As antioxidants, they protect cell constituents against oxidative damage and, therefore, limit the risk of various degenerative desease associated to oxidative stress [3,6]. The main dietary sources of polyphenols are fruits, vegetables, cereals, olive, dry legumes, chocolate and beverages such as tea, coffee and wine [1,4,5,7].
Kola nut is a tropical seed which is important for its tonic and stimulating effect as coffee and tea [8-10]. Kola nuts are greatly accepted among consumers due to is high levels of phenolic compounds, such as flavonoids and phenolic acids; xanthines, such as caffeine and theobromine [9,11,12,13]. There are also received great interest due to their phamacological properties such as physical and intellectual stimulant, vomiting control, hunger and thirst conteracting effects [11,14,10,15]. Before being introduced in foods or beverage, these substances need to be extracted preferably from their natural sources and stabilized [16]. To increase their value and
properties the extract could be purified and concentrated.
Among separation processes, membrane processes and more specially pressure driven membrane separation processes offer several advantages in various sectors of production for their capacity to operate at room temperature under low energy consumption when compared with conventional technologies for concentrating and/or fractionating bioactive compounds from different vegetables sources [17-18]. Particularly, microfiltration (MF) is generally used for fine particles or bacteria removal or turbidity reduction processes [19-23], while, ultrafiltration (UF) is used for macromolecule concentration and fractionation [24-28]. Nanofiltration (NF) and reverse osmosis are mainly used in water treatment area (ie desalination and/or demineralization) but these techniques also permit the concentration of plants extracts or fruit juices [29-33]. The combination of at least two pressure-driven membranes (MFT/RO, UF/NF, UF/RO, MF/UF, etc.) permits to achieve better separation [34-38].
Nyamien et al.; EJNFS, 7(1): 84-100, 2017; Article no.EJNFS.2017.005
pseudo-tangential filtration pilot operating in concentration mode. After determining the optimal conditions (i.e. transmembrane pressure, tangential velocity) for the selected membranes, the clarification of the extract was carried out in a tangential filtration pilote operating in concentration mode. The final UF permeate was then submitted to a NF process in order to obtain a concentrated phenolic extract enriched in caffeine. The crude kola extract was also concentrated by nanofiltration in order to know the efficiency of the previous coupling process. All permeates and retentates obtained from MF, UF and NF steps were analyszed for their content in total polyphenols, proteins, caffeine, catechin and epicatechin in order to assess the selectivity of each membrane step towards compounds of interest.
2. MATERIALS AND METHODS
2.1 Plant Material and Pre-treatments
Kola extract was prepared from mature kola seeds (Cola nitida Schott & Endl.) harvested from October to February 2015 in south of Côte d’Ivoire. Nuts were washed with distilled water, cut in smaller pieces and dried at room temperature (30±2°C) for two weeks. The dried sample was milled into powder using an electric blender and stored in plastic bags until being used for extraction. The extract was obtained by infusion of 1 g of kola nut powder (Ø < 100 µm) in 100 mL of EtOH 50% for 24 h at room temperature as described by Nyamien et al. [39]. The extract obtained was filtered through filter paper (mm) for pseudo-tangential filtration
pilot or sintered glass (40-100 µm) for tangential filtration pilote before use as crude
extract (CE).
2.2 Chemical Reagents
All reagents used in this study were of pure analytical grade, unless otherwise specified, were purchased from Sigma Aldrich (Germany): ethanol (CH3CH2OH), methanol (CH3OH),
hydrocholric acid (HCl), Folin-Ciocalteu’s phenol reagent, sodium carbonate salt (Na2CO3),
sodium hydroxide (NaOH), aluminium chloride (AlCl3), Gallic acid, catechin, epicatechin,
vanillin, sulfuric acid (H2SO4), nitric acid (HNO3),
sodium nitrite (NaNO2), copper (II) sulfate
(CuSO4), potassium sodium tartrate
(C4H4KNaO6), serum albumin, caffeine, catechin
and epicatechin.
2.3 Membranes and Filtration Devices
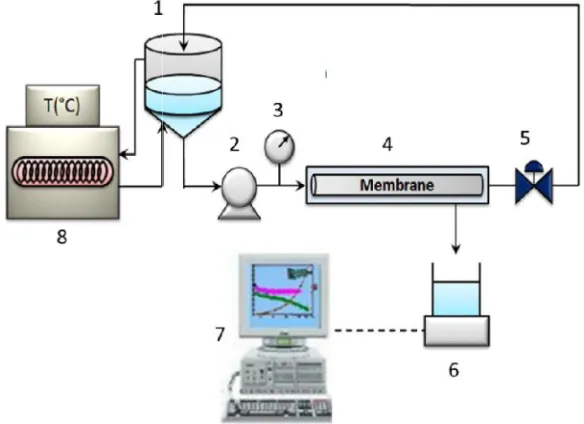
The ceramic micro- and ultrafiltration (CeramInside®) were purchased from Tami Industries (France) while the nanofiltration membrane used was the Fimtec NF270 membrane from Dow Chemical Compay (The charachteristics of the different membranes tested are presented in Table 1). Two different filtration were used: a SPIRLAB® cell (Tami Industrie) designed flat ceramic membranes and a versatile lab-scale pilot plant (Fig. 1) which can be equiped with either tubular (home-made stainless steel module) or flat sheet membranes (SEPA CF Membrane Cell nanofiltration device (OSMONIC, Minnetonka, MN, USA).
2.3.1 Filtration experiments
The selection of ceramic membranes were realised with the SPIRLAB® cell. Firstly, an ethanol solution (50%) was filtered at different pressure in order to determine the solvent permeability of the clean membrane (Lp1) defined
according to the following equation (Eq. 1):
Jp = Lp.ΔP (1)
Where J pis the permeate flux (L.h-1.m-2), ΔP the transmembrane pressure (bar) and Lp the solvent permeability (L.h-1.m-2.bar-1).
Then the ethanol solution was replaced by the crude extract and the permeate flux (Js) was monitored versus the volume reduction factor (VRF) which was calculated as the ratio between the initial fedd volume of remaining concentrate after the considered operation time (Eq. 2)
= (2)
Where Vf is the feed volume (L) and Vp the permeate volume (L).
Finaly, the installation was rinsing with deionized water and the solvent pêrmeability (Lp,f) was
measured in the same conditions as previously. The loss of the permeability was estimated according to the following equation (Eq. 3):
Permeability loss=Lpi-Lpf
Lpi x 100 (3)
transmembrane pressure of 0.5 bar and 25°C. Ultrafiltration experiments were carried out either with crude kola extract or with permeate obtained from microfiltration step. Three different membrane cut-off were investigated (5, 15 and 50 kDa), the operating conditions were the same as those used for the microfiltration experiments except for the transmembrane pressure which was set at 2 bar. In order to estimate the selectivity of membranes, samples of permeate were withdrawing for further analysis. The apparent rejection rate (R) was defined as follow (Eq. 4):
R= 1-Cp
Cf x 100
Where Cp and Cf are the concentration of the compound in the permeate and feed stream, respectively.
The effect of operating parameters (tangential velocity, transmembrane pressure) on the
Table 1. Characteristics of the membranes studied MWCO Membrane
/Type
Microfiltration 0.2 µm Plane/tubular Ultrafiltration 50 kDa
15 kDa 5 kDa
Nanofiltration 200-400 Da Plane
*Determined in our laboratory at 25°C,
Fig. 1. Tangential filtration pilot (1) tunk, (2) pump, (3) manometer, (4) membrane cell, (5) valve, (6) permeate, (7) computer, (8) thermostatic bath
Nyamien et al.; EJNFS, 7(1): 84-100, 2017; Article no.
transmembrane pressure of 0.5 bar and 25°C. Ultrafiltration experiments were carried out either with crude kola extract or with permeate obtained from microfiltration step. Three different vestigated (5, 15 and 50 kDa), the operating conditions were the same as those used for the microfiltration experiments except for the transmembrane pressure which was set at 2 bar. In order to estimate the selectivity of membranes, samples of permeate e withdrawing for further analysis. The ) was defined as follow
(4)
Where Cp and Cf are the concentration of the compound in the permeate and feed stream,
The effect of operating parameters (tangential velocity, transmembrane pressure) on the
filtration performance were studied with lab pilot plant in recycle mode (both permeate and retentate were recycled). TMP and cross velocity (CFV) were varied in the range of 1 to 4 bar and 1 to 4 m.s-1, respectively for MF and UF experiments. For the NF filtration, the ranges of variation were 5 – 20 bar and 0.5 to 2 m/s for the pression and velocity, respectively. Before the filtration of kola extract, the membrane was conditionned by filtrating pure solvent at 2, 3 and 25 bar, respectively for MF, UF and NF until the flux raeched a constant value [40]. The filtration of kola extract was carried out according to the following procedure. The cross
(respectively the membrane pressure) was kept constant and the pressure (respectively the cross-flow velocity) was successively increased up to the higher value then decrease to the lower value. Each setting was kept constant for about 30 min until the permeate flux reached a constant value. The production of the concentrated extract involved three successive
Table 1. Characteristics of the membranes studied Membrane
/Type
Area of the membrane (cm2)
Pression maximum (bar)
EtOH 50% perme (L/h m
Plane/tubular 56.5 / 101.2
177 320
146 nd nd
Plane 155 45 38
*Determined in our laboratory at 25°C, a :determined at 1 bar; b :determined at 2 bar; c : determined at 10 bar
Tangential filtration pilot (1) tunk, (2) pump, (3) manometer, (4) membrane cell, (5) valve, (6) permeate, (7) computer, (8) thermostatic bath
; Article no.EJNFS.2017.005
filtration performance were studied with lab-scale pilot plant in recycle mode (both permeate and retentate were recycled). TMP and cross-flow were varied in the range of 1 to 4 1, respectively for MF and UF experiments. For the NF filtration, the ranges of 20 bar and 0.5 to 2 m/s for the pression and velocity, respectively. Before the ract, the membrane was conditionned by filtrating pure solvent at 2, 3 and 25 bar, respectively for MF, UF and NF until the flux raeched a constant value [40]. The filtration of kola extract was carried out according to the following procedure. The cross-flow velocity (respectively the membrane pressure) was kept constant and the pressure (respectively the flow velocity) was successively increased up to the higher value then decrease to the lower Each setting was kept constant for about until the permeate flux reached a constant value. The production of the concentrated extract involved three successive
EtOH 50% permeability (L/h m2)*
320a 146 b
c
: determined at 10 bar
membrane filtration steps carried out in batch mode (the retentate was recycled while the permeate was collected). At the end of the first step (MF step), the permeate recovered was used as feed solution in the second filtration step (UF step), finaly the permeate of the UF step was nanofiltered (NF step) (see F
filtration were carried out at the nominal conditions previously determined. Membranes performances were evaluated with respect to two mains parameters : permeate flux and rejection of target compounds (total phenols, proteins, caffeine, catechin and epicatechin). For that samples of feed solution, as well as permeate and retentate were collected at the end of each filtration and stored at +4°C until being analysis.
The crude extract was also directly concentrated by NF in the same operating conditions (Fig. 2).
Fig. 2. Preparation of concentrated kola extratcs: Scematic flow sheets of the membrane
Nyamien et al.; EJNFS, 7(1): 84-100, 2017; Article no.
membrane filtration steps carried out in batch etentate was recycled while the permeate was collected). At the end of the first step (MF step), the permeate recovered was used as feed solution in the second filtration step (UF step), finaly the permeate of the UF step was nanofiltered (NF step) (see Fig. 2). The filtration were carried out at the nominal conditions previously determined. Membranes performances were evaluated with respect to two mains parameters : permeate flux and rejection of target compounds (total phenols, proteins, in and epicatechin). For that samples of feed solution, as well as permeate and retentate were collected at the end of each filtration and stored at +4°C until being analysis.
The crude extract was also directly concentrated nditions (Fig. 2).
2.3.2 Membranes cleaning
At the end of the experiments, the ceramic membranes were soaked in a NaClO solution (2,6% of active chlorine) at 40°C for 15 min, rinsed with deionised water and then subjected to a chemical washing before thei
washing was carried out according to a precise protocol and fabricant recommendations. The fouled membranes were cleaned in full recirculation by hydroxide sodium solution (NaOH 2%) at 80°C without pression for 15 min and 20 min at 2 bar, follows by nitric acid solution (HNO3, 2%) at 60°C without pression for 10 min
and 15 min at 2 bar. The system was extensively rinsed with fresh water between the two washing steps and the flux recovery was checked at the end of the membrane cleaning. The NF
reused.
Preparation of concentrated kola extratcs: Scematic flow sheets of the membrane processes
; Article no.EJNFS.2017.005
At the end of the experiments, the ceramic membranes were soaked in a NaClO solution (2,6% of active chlorine) at 40°C for 15 min, rinsed with deionised water and then subjected to a chemical washing before their reuse. This washing was carried out according to a precise protocol and fabricant recommendations. The fouled membranes were cleaned in full recirculation by hydroxide sodium solution C without pression for 15 min lows by nitric acid solution C without pression for 10 min and 15 min at 2 bar. The system was extensively rinsed with fresh water between the two washing steps and the flux recovery was checked at the end of the membrane cleaning. The NF were not
Nyamien et al.; EJNFS, 7(1): 84-100, 2017; Article no.EJNFS.2017.005
2.4 Analytical Method
2.4.1 Total content of phenols
Total polyphenols were determined by colorimetry, using the Singleton and Rossi method [41] modified by Wood et al. [42]. Diluted Folin-Ciocalteu reagent (1/10, v/v, 2.5 mL) was added to 30 µL of sample. After 2 min of incubation in the dark at room temperature, 2 mL of aqueous sodium carbonate (75 g/L) was added. After gentle stirring, the mixture was incubated in a water bath at 50°C for 15 min and rapidly cooled down to stop the reaction. The absorbance was measured at 760 nm with distilled water as blank. A calibration curve was performed with gallic acid at different concentrations (0-1 g/L). Analyses were performed in triplicate and polyphenols level was expressed in grams of gallic acid equivalent per liter of extract (g/L GAE).
2.4.2 Total content of proteins
The proteins were determined according to the Lowry et al. [43] method after precipitation of the proteins with tricholoroacetic acid (TCA). 200 μL of sample are pipetted into an eppendorf tubes, and 500 μL of a diluted TCA (1/10) solution are added. After vortexing, the tubes are centrifuged for 15 min at 5000 rpm. Subsequently, the supernatant is aspirated by means of a water-jet tube and then the pellet is neutralized by adding 200 μL of sodium hydroxide solution (0.2 N). The mixture is well stirred by vortexing and then incubated in a water bath at 60°C. for 30 minutes. Finally, one milliliter of a solution prepared extempraneously by adding 250 µL of CuSO4, 5 H2O (1%, (w/v) in distilled water) + 250
µL sodium potassium tartrate (2% (w/v) in distilled water) to 24.5 mL of Na2CO3 solution
(2% (w/v) in NaOH 0,1 N) is added to the reaction medium. After vortexing and incubation at room temperature for 10 minutes, 0.1 mL of Folin Ciocalteu reagent (1/2) prepared extemporaneously is added and the mixture is maintained at room temperature for 30 minutes until the absorbances measurement at 750 nm against a blank prepared under the same conditions. A calibration curve was performed with bovine serum albumin (BSA) at differents concentrations (0-100 µg.ml-1). Analyses were performed in triplicate.
2.4.3 Analysis of caffeine, catechin and epicatechin by HPLC
The chromatographic analysis was performed on a liquid chromatographic system equipped with a
Waters Alliance 2695 HPLC module (Milford, MA, USA) connected to a Waters 996 photodiode array (PDA) detector and column oven with a variable UV-vis detector. A quaternary pump, Waters 600 E, was used for high-pressure gradient elution. Data were collected, stored and analyzed using the EMPOWER software version 5.0 from Waters (Milford, MA, USA). Injections were made with an automatic injector Waters W717. The column used was a C18 Macherey-Nagel (250 mm x 4.6 mm – 5 μm Nucleodur - 100A°). 20 μL of sample are injected and the elution is carried out at a constant flow rate (0.8 ml / min) with a mobile binary phase consisted of A (95/5, H2O/MeOH +
0.1% TFA) and B (100% ACN + 0.1% TFA). A gradient elution was performed by varying the proportion of solvent A to solvent B. The mobile phase composition started at 100% solvent A for 19 min, followed by a linear increase of solvent B to 6% for 31 min, 20% for 0.1 min and 100% for 9.9 min, and the bring mobile phase composition back to the initial conditions in 9.9 min for the next run. The washing cycle of the column is carried out after each injection. All the prepared solutions were filtered through 0.45 µm membranes (Fisher scientific). Absorption wavelength was selected at 274 nm. Chromatographic peaks in the samples were identified by comparing their retention time and UV spectrum with those of the reference standards. Working standard solutions (0 to 50 ppm) were injected into the HPLC, and peak area responses were obtained.
3. RESULTS AND DISCUSSION
3.1 Batch Concentration on a Pseudo-tangential Pilot
Nyamien et al.; EJNFS, 7(1): 84-100, 2017; Article no.EJNFS.2017.005
flow through the membrane and can act as the second membrane which overlaps in the original membrane [45]. Balakrishnan et al. [46] demonstrated that the significant flux decline was due to the deposition of small particles and colloidal on the membrane surface which led to membrane fouling. According to Vladisavljevic et al. [47], the most problematic consequence of the membrane fouling when a membrane system is operated at constant pressure and cross flow velocity is a decrease, often accentuated sharp decline of the flow of permeation with time.
On the other hand, the permeate flux gradually decreases during the ultrafiltration of microfiltered extract. This permeate flux decrease would be due to elimination of a part of macromolecules and particles responsible of the rapid decrease when crude extract is used.
The concentration polarization was therefore implemented gradually. Similar flux decrease
with MF and UF ceramic membranes have been observed in clarification of buckthorn berries juice with 0.2 µm ceramic membrane [35], orange juice with PVDF/PMMA 0.2 µm [48], artichoke wastewaters with 15 kDa ceramic membrane [17].
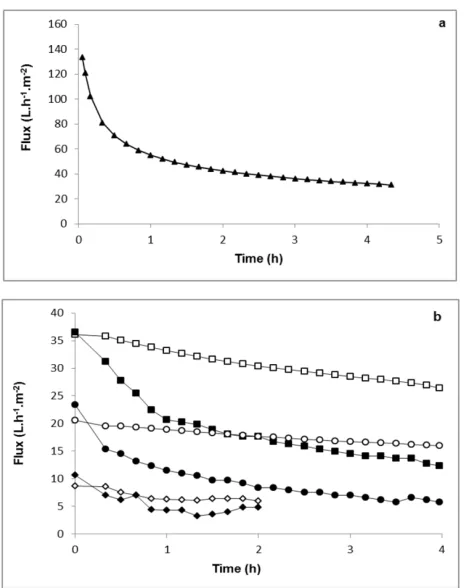
During ultrafiltration, the permeate fluxes were greater with the 50 kDa membrane than the 15 and 5 kDa. This is explained by the difference in the pore sizes of the membranes. In fact, during filtration through porous membrane, the permeability is proportional to the membrane pore size and the diameter of the molecules of the feed solution [49]. More the size of the pores of the membrane is important, bigger is its permeability, and smaller is the corresponding hydraulic resistance [47-48]. This result in a greater volumetric reduction factor (VRF) for UF 50 kDa than 15 and 5 kDa. Similar statements have been observed with UF ceramic membranes (15 and 50 kDa) in clarification of apple juice [50].
Fig. 3. Effect of MWCO and the coupling step on pseudo-tangential pilot on relative flux of kola extract filtered through (a) MF 0.2 µm, TPM 0.6 bar, (b) UF at TPM= 2 bar. The crossflow velocity has been set at 2.8 m/s and Temperature at 25°C. ( ) crude extract with 0.2 µm, time =
6 h ( ) crude extract with UF 5 kDa, time = 2 h, ( ) permeate MF with UF 5 kDa, time = 2 h ( ) crude extract with UF 50 kDa, time = 4 h ( ) permeate MF with UF 5 kDa, time = 4 h ( ) crude
Nyamien et al.; EJNFS, 7(1): 84-100, 2017; Article no.EJNFS.2017.005
The flux values as well as the VRF remain nevertheless greater in UF after previous filtration by MF. During the filtration of the crude extract through UF membranes, the initial flux values were 36, 24 and 10 L.h-1m-2 compared to 10, 6 and 4 L.h-1.m-2 at the steady-state for the UF 50, 15 and 5 kDa, respectively. This is equivalent to flux decreases of 73, 40 and 60%, respectively. The stabilized flux corresponded to 13, 8 and 5 L.h-1.m-2 for UF 50, UF 15 and UF 5 kDa, respectively. Stabilization of this flow occured much earlier with membranes of 5 and 15 kDa (60 and 150 min) compared to 260 min for UF 50. On the other hands, during the filtration of the MF permeate, the initial values were 36, 20 and 8 L.h-1.m-2 compared to 27, 16 et 5 L.h-1.m-2 at the end of the filtration for the UF 50, 15 and 5 kDa, respectively. Which corresponds to flux decrease of 25, 20, 37%, respectively. These various claims are confirmed by the retention rates of the compounds during concentration mode. During the filtration, molecules are more or less retained by the membranes (Table 2). In general, for each UF membrane, the retention rates of the compounds were lower during the filtration of the MF permeate. For each compound, the retention rate was lower with the UF 50 kDa. This would be justified by the fact that the permeation of the compounds is facilitated by the large molecular weight cut-off (MWCO) of the 50 kDa with respect to the 15 and 5 kDa. The clogging of the membrane increase rapidly with the membranes
of 5 and 15 kDa but gradually with the 50 kDa. The permeability of the latter was
therefore greater during the filtration period. The highly retained compounds at each filtration step were proteins and total phenols. This is explained by their high molecular weight, their affinity with the membranes and the ease of formation of aggregates [44]. According to
Vernhet et al. [51] and Ulbricht et al. [20], total phenols react as acidic compounds
(acceptor of electron pair or donor of H+) due to their hydroxyl (OH) groups of phenolic nuclei and highlight the importance of the formation of H bonds in their physico-chemical reactivity. They also noted that once the number of nuclei phenols is greater than two, the affinity of compounds to surfaces is greatly increased regardless of the polarity of the latter. Work carried out on the extraction and concentration of certain fruit juices also showed that the proteins, by their high molecular weights, participated in the formation of a gel on the surface of the membranes and also in the blocking of the pores [52-54].
Caffeine, catechin and epicatechin were poorly retained by the membranes. This indicates that their molecular weight is less than the membrane pores size. However, retention rates still remain high. In Table 3 the mass balance of the MF and UF process for all compounds analyzed is reported. The general observation was that during the microfiltration or ultrafiltration of the crude extract of kola, the extraction yields were greater in the permeate MF. It can be noted that 66.06%, 67.56%, 46.21%, 70.98%, 71.44% and 70.77% of initial content of dry matter, total phenols, proteins, caffeine, catechin and epicatechin, respectively, were maintained in the permeate of the microfiltration process. Moreover, by comparing the quantities in each permeate UF during the filtration of this permeate, it is founded that the mass recovery of the compounds was greater in the permeate of 50 kDa. More than 70% of the compounds are present in this permeate. This higher content would be due to the higher volumetric reduction factor (VRF) of 7.4 for UF50 compared to 4.7 and 1.4 for UF15 and UF5 kDa, respectively. Consequently, the coupling of steps (MF/UF) favored a greater covering of the molecules compared to the direct filtration on ultrafiltration.
3.2 Effect of Operating Parameters on Tangential Pilot Filtration
3.2.1 Effect of crossflow velocity on permeate flux
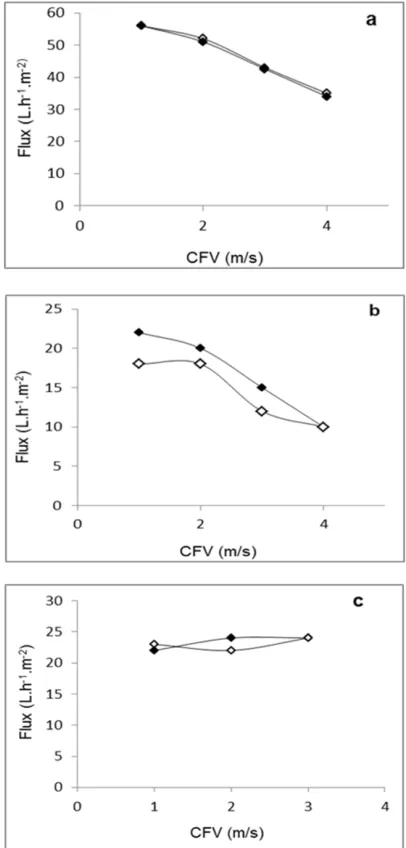
When tests were performed on recycle mode and various cross-flow velocities (CFV) some unexpected results were produced. Fig. 4 show data obtained for selected membrane under otherwise identical filtration conditions for each step. The permeate flux at constant pressure of 10 bar remains constant during lowest to highest CFV from 0.5 to 1.5 m/s in nanofiltration (Fig. 4c). Similar statement was observed on the highest to lowest (from 1.5 to 0.5 m/s). The permeate flux was therefore independent of crosflow velocity applied. According to [55], natural organic matter permeate flux remains constant when crossflow velocity increase from 4 to 40.4 cm/s. This could be explained by the fact that the membrane, due to the small diameter of its pores, is preferably permeable to the solution than to the solutes. As a result, only the applied pressure could influence the flow rate of the solvent through the membrane.
Nyamien et al.; EJNFS, 7(1): 84-100, 2017; Article no.EJNFS.2017.005
Table 2. Retention of compunds coming from pseudo-tangentiel filtration
MF/UF5 MF/UF15 MF/UF50 UF5 UF15 UF50
Total phenols (%) 24.73 14.29 17.14 66.84 47.06 20.00
Proteins (%) 28.73 13.33 14.29 72.63 56.25 24.73
Caffeine (%) 9.31 5.00 0.31 16.05 2.34 1.28
Catechin (%) 15.7 5.67 2.03 21.46 8.70 2.54
Epicatechin (%) 12.97 7.53 2.24 24.98 12.48 2.74
MF/UF : Microfiltration coupled with ultrafiltration
Table 3. Mass balance (%) during batch concentration on pseudo-tangential pilot MF MF/UF5 MF/UF15 MF/UF50 UF5 UF15 UF50
Dry matter (%) 66.06 7.25 78.17 86.21 5.91 20.57 49.85
Total phenols (%) 67.56 7.1 67.35 71.61 2.32 12.71 44
Proteins (%) 46.61 6.72 68.09 74.08 1.91 10.5 41.4
Caffeine (%) 70.98 8.55 74.64 86.16 5.87 23.44 54.29
Catechin (%) 71.44 7.95 74.11 84.68 5.5 21.91 53.6
Epicatechin (%) 70.77 8.21 72.66 84.5 5.25 21 53.49
The results presented are those of the balance sheet of the various permeates
the recorded permeate fluxes remain stable from 0 to 2 m/s and then decrease for the highest velocities. Similar statements have been observed by Tarleton and Wakeman [53] during filtration of finer calcite suspensions through microfiltration (0.2 µm) membrane. According to Tarleton and Wakeman [56], when the challenge stream contained a greater proportion of larger, unground, particles the filtration rate was seen to fall with increasing cross-flow velocity despite a substantial thinning of the fouling layer at the higher crossflows. A possible explanation for the phenomenon might be in terms of a particle classification near the filtering surface. It is known that the membrane deposits which appear during microporus membranes are formed from the finer particle species present in the feed stream [57]. The axial velocity gradient which is generated across the flow channel would seem to cause a preferential deposition of the finer material from the feed a the membrane surfaces. This no entirely unknown mechanism (s) would preferential removed a larger particles from the foulant layers by the scouring action of the crossflow stream. The deposits responsible for fouling could thus have a resistance considerably higher than that which might be expected from a simplistic approach [54]. Moreover, during the decrease in the intensity of the velocity, the permeability of the membrane is not totally recovered during ultrafiltration compared to what is observed in microfiltration and nanofiltration. This could be explained by internal clogging of the UF membrane during the filtration of the permeate MF. Indeed, ultrafiltration is more prone to clogging by adsorption [49]. According to Azarte [49], El Rayess et al. [44] and Cardoso
de oliveira et al. [58], membrane fouling could be divided in function of its localization relative to the membrane structure: (i) internal fouling, caused by the adsorption and deposition of small particles and macromolecules within the internal structure of the pores, the irregularity of pore passages causes the particle to become tightly fixed blinding the pore (ii) external fouling, caused by the deposition of large macromolecules and particles on the top of the membrane. External fouling can be removed by relaxation of the considered parameter [26].
The optimum cross-flow determined for each membrane was 2 m/s for microfiltration and ultrafiltration, and 1 m/s for nanofiltration. This cross-flow makes it possible to obtain a large flux of permeate while minimizing the clogging of the membranes.
3.2.2 Effect of transmembrane pressure on permeate flux
Nyamien et al.; EJNFS, 7(1): 84-100, 2017; Article no.EJNFS.2017.005
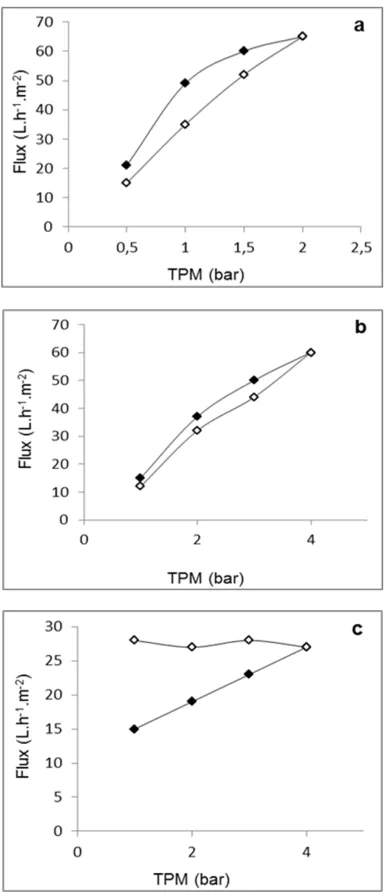
[62] and El-Rayess et al. [44], the permeate flux increases linearly with pressure until a maximum limit value or limit flux is reached. Beyond this value, a pressure difference is created on each side of the membrane which will lead to an increase in the concentration of solutes in the vicinity of the membrane. This over-concentrated polarization layer will oppose the transfer of the particles and thus reduce the permeate flux. In UF, this phase is reached from 2 bar, the flow tends to stabilize and thus becomes independent of the applied pressure. When the pressure is decreased (step 2), as seen during CFV effect, internal pores blocking of the membranes of MF and UF occurs, which results in flux values lower than the initial values. The observation is a slightly different in NF. Indeed, a stability of the permeate flux is noted during highest to lowest pressure (Fig. 5c). This phenomonen could be explained by the compaction or conditionnement of the NF membrane before reducing transmembrane pressure (step 2). According to Azarte [49], a preconditioning of the membrane under a precise pressure of the maximum pressure is often recommended to obtain reproducible performances in terms of permeability.
The optimum pressure of each membrane is thus determined, which is the applied pressure value allowing a high permeate flux to be obtained while inducing a low clogging of the membranes. This pressure value is 1, 3 and 10 bar for the MF, the UF and the NF, respectively.
3.3 Batch Concentration Mode on
Tangential Pilot Filtration
By applying the optimum filtration conditions previously determined, the MF, UF and NF membranes were used for the clarification-purification-concentration of a crude cola extract. In general, as seen previously, results showed that the permeate flux in microfiltration and ultrafiltration decreased with the operating times by increasing of the volumetric reduction factor (VRF) due to polarization and gel formation (Fig. 6a, 6b). The initial permeate flux of about 133 and 52 L.h-1.m-2 reached a steady-state value of about 36 and 33 L.h-1.m-2 when the VRF was 4.4 and 6.8, for MF and UF, respectively. Thus, after filtration and rinsing of the reversible fraction with deionized water, membranes performances determined (Table 4) reveal the lower permeability coefficients Lp1 of 132.8 and 12.53
compare to initial value Lp0 which are 261.2,
67.33 L.h-1.m-2.bar-1. This induces an additional resistance of these membranes (irreversible
resistance Rirrev): 1.1x10¹² and 2.03x10¹³ m-1 for microfiltration and ultrafiltration, respectively. This translates a membrane permeability loss of 43 and 80%. Kola extract therefore contains molecules capable of reducing the permeabilities of the membranes during the microfiltration and ultrafiltration.
Fig. 4. Effect of initial permeate flux on molecules fouling for various crossflow velocities: ( ) low to high crossflow and ( ) high to low crossflow. Results are presented flux vs cross-flow: (a) microfiltration, TPM =
1bar, T= 25°C, Q= 150 l/h, (b) ultrafiltration, TPM = 2 bar, T= 25°C, Q= 150 l/h (c) nanofiltration, TPM = 10 bar, T= 25°C, Q= 120
Nyamien et al.; EJNFS, 7(1): 84-100, 2017; Article no.EJNFS.2017.005
Fig. 5. Effect of initial permeate flux on molecules fouling for various pressions: ( )
low to high pression and ( ) high to low pression. Results are presented flux vs pression: (a) microfiltration at 2 m/s, (b) ultrafiltration at 2 m/s, (c) nanofiltration at 1
m/s
The clarified kola extract by coupling MF/UF was concentrated by nanofiltration in optimal operating conditions (Fig. 6c). It showed the evolution of the permeate flux according to batch concentration mode in which, starting from 2.05 L of clarified extract, 1.52 L of permeate were produced (final VRF, 3.8). The initial permeate
flux of 20 L.h-1.m-2 decreased rapidly in the first 17 min; then permeate flux reached a steady-state permeate value of about 17 L.h-1.m-2 until to the final VRF, ie a flow loss of 15%. This decrease in flux could be attributed to the polarization concentration and fouling of membrane This behavior was similar to that observed by Diaz-Reinoso et al. [27] and Murakami et al.[32] in the nanofiltration process of (1st) aqueous extracts from distilled fermented grape pomace when using pressure between 2 and 4 bar (2nd) aqueous mate from Ilex paraguariensis at 3 bar.
This gradually decrease could be explained by the concentration polarization and subsequent cake layer formation [63]. Thus, the coefficient of permeability observed after rinsing the membrane (Lp1 = 0.4 L/h m
2
bar) was lower than initial value (Lp0 = 1.14 L/h m2 bar). This
indicates a Rirrev = 6.2 x 10¹⁴ m-1, 100 times greater than that obtained during microfiltration. This being due to the smaller pore size in NF and the operating conditions applied for each membrane. According to Pagliero et al. [48] permeability is higher; greater is the membrane pores size, compared to the hydraulic resistance which is all the greater when the pore size is small.
It can be seen that microfiltration and ultrafiltration steps therefore influence the performance of the NF membrane. According to Paraskeva et al. [64] the pretreatment of the extract by ultrafiltration would be a prerequisite for concentration by nanofiltration due to the elimination of colloids and particles responsible of membrane fouling. Differences observed in permeate fluxes and VRFs showed that the direct concentration of the prefiltered kola extract could be an alternative to step coupling. It remains to be seen which of the procedures would favor a high recovery of the different compounds of interest.
The recovery rates determined are between 96 and 99%, which reflects the effectiveness of the washing method used.
3.4 Impact of Microfiltration and
Ultrafiltration on Kola Extract Quality
Nyamien et al.; EJNFS, 7(1): 84-100, 2017; Article no.EJNFS.2017.005
rejection coefficients are 35.71, 6.82, 2.35, 2.10 and 1.46% for proteins, total phenols, epicatechin, caffeine and catechin, respectively. According to El-Rayess et al. [44], the high retention of proteins and other suspended particles promotes clarification of the extract tested. Consequently, a purity gain of the other interest compounds transmitted in the permeate
is observed. The microfiltration jointly promotes the retention of the macromolecules
and a gain in purity of the total phenols and caffeine. During the ultrafiltration, similar results are observed. However, nearly 30% of polyphenols are retained by the membrane. Which results in a decrease in the purity of the latter in the final permeate.
3.5 Concentration by Nanofiltration
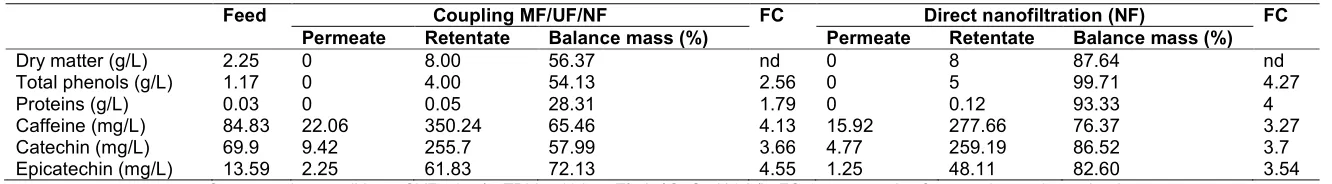
Table 6 shows the different extraction yields of the compounds during MF/UF/NF coupling and direct concentration of crude extract through NF. In general, there is a decrease in the content of the compounds analyzed when passing from the feed stream to the permeate. This indicates compounds retention by the various membranes tested. The highly retained compounds at each experiment step are proteins and total phenols with retention index (R) of 100 when VRF was
3.6 and 3.8 for direct concentration by NF and coupling MF/UF/NF, respectively. These
compounds are responsible of the membrane fouling observed previously. This indicates that their molecular weight is greater than the pore
size of the NF 270 membrane used. This result was better than those observed by
Murakami et al. [32] and Bras et al. [40] in the concentration of phenolic compounds of aqueous
propolis extract and Cynara cardunculus
through nanofiltration, acheving an R of 84% and near 100%, respectively, of phenolic compounds.
In the other hands, as seen in Table 6, it is possible to see that of all the catechin, epicatechin and caffeine, present in the initial solution (UF permeate), only 13.89%, 16.07% and 27.42%, respectively, were loss to the permeate. These data are for the most part less than those observed during the direct concentration of the crude extract. There are, in fact, 6.83%, 9.26% and 18.76% for catechin, epicatechin and caffeine, respectively. Thus, the passage of these compounds through the membrane is due to their low molecular mass which is near the the cut-off membrane (200 – 400 Da). Differences in retention rates are the
result of a different chemical composition of the feed solutions.Despite the lost of compounds, the value obtain represent a high retention index and corroborate that the NF process is suitable for the concentration of water-ethanol mixture extract of kola nut.
Fig. 6. Shematic representation of kola extract filtration at 25°C (A) microfiltration, TMP =1 bar, CFV=2 m/s, flow = 150 l/h), (B) ultrafiltration, TMP =3 bar, CFV= 2 m/s, flow =
Nyamien et al.; EJNFS, 7(1): 84-100, 2017; Article no.EJNFS.2017.005
96
Table 4. Membranes performances during batch concentration
Permeability Lp0
(L/h m².bar)
Permeability Lp1
(L/h m².bar)
Permeability loss (%) Rirrev
(m-1)
Recovery rate%
MF 0.2 µm 261.2 132.8 43 1.1x10¹² 99
UF 50 kDa 67.33 12.53 80 2.03x10¹³ 96
NF* 1.14 1.14 0 0 nd
NF** 0.4 65 6.2 x10¹⁴
Mean values ± standard deviation of duplicate determinations, µEtOH50% = 9,82.10-4 ; Temperature: 25°C
Lp0 = membrane initial permeability, Lp1 = permeability after filtration of the extract and rising
* : filtration of UF permeate (MF/UF/NF), ** : filtration of crude extract
Table 5. Retention coefficient and purity of compounds during microfiltration and ultrafiltration
Crude extract MF permeate %R MF retentate Purity UF permeate %R UF retentate Purity
Dry matter (g/L) 2.25 2.05 8.89 2.68 - 1.96 4,54 2,49 -
Total phenols (g/L) 1.17 1.09 6.82 1.41 1 0.77 29,17 1,49 0.7
Proteins (g/L) 0.03 0.02 35.71 0.08 0.7 0.01 35,29 0,05 0.6
Caffeine (mg/L) 84.83 83.05 2.10 90.07 1 80.45 3,13 99,66 1
Catechin (mg/L) 69.9 68.88 1.46 74.84 1 67.80 1,56 84,18 1
Epicatechin (mg/L) 13.59 13.27 2.35 14.62 1 12.76 3,84 17 1
Filtration conditions: Microfiltration (MF): TPM = 1 bar, CFV = 2 m/s, T= 25°C, Ultrafiltration (UF): TPM = 3 bar, CFV = 2 m/s, T= 25°C, %R: rejection coefficient
Table 6. Content of filtered kola extract
Feed Coupling MF/UF/NF FC Direct nanofiltration (NF) FC Permeate Retentate Balance mass (%) Permeate Retentate Balance mass (%)
Dry matter (g/L) 2.25 0 8.00 56.37 nd 0 8 87.64 nd
Total phenols (g/L) 1.17 0 4.00 54.13 2.56 0 5 99.71 4.27
Proteins (g/L) 0.03 0 0.05 28.31 1.79 0 0.12 93.33 4
Caffeine (mg/L) 84.83 22.06 350.24 65.46 4.13 15.92 277.66 76.37 3.27
Catechin (mg/L) 69.9 9.42 255.7 57.99 3.66 4.77 259.19 86.52 3.7
Epicatechin (mg/L) 13.59 2.25 61.83 72.13 4.55 1.25 48.11 82.60 3.54
Nyamien et al.; EJNFS, 7(1): 84-100, 2017; Article no.EJNFS.2017.005
During the concentration of the ultrafiltration permeate, 56.73%, 54.13%, 28.31%, 65.46%, 57.99% and 72.13% of initial content of dry matter, total phenols, proteins, caffeine, catechin and epicatechin, respectively, were maintained in the final retentate (concentrate 1) of the process. These extraction yields are, however, lower than those obtained during the direct concentration of the feed stream (76 - 99%). This implies that a large fraction of these compounds is retained in the prior steps of microfiltration and ultrafiltration, as seen before. The concentration factors observed during nanofiltration (Table 5) indicate higher concentrations of the molecules of low molecular masses that are caffeine (4.13), catechin (3.66) and epicatechin (4.55) during the coupling mode compared to those obtained in concentrate 2. While the inverse is observed for total phenols and proteins. This could be explained by the fact that the retention of the macromolecules and colloids during the MF/UF steps would have favored the purification of the kola extract. Thus, at identical VRF and dry matter, reducing the feed volume promotes a higher concentration of the purified extract compounds relative to the crude extract. Previous studies for the concentration of compounds present in aqueous or water alcohol mixture plant extract through nanofiltration, using a membrane with a MWCO of 150-300 Da [32,65] achieving a concentration factor (CF) of 5 with a VRF of 4. This CF was higher than that obtained in our study. According to authors, modifications in the equipment’s operational parameters such as pressure, temperature, duration of the process, membrane type and pore size, raw material, and VRF cause different behaviors in a process of separation through membranes [32,40,22].
4. CONCLUSION
The objective of this study was the study of membrane potential in the context of the extraction, purification and concentration of a hydro-alcoholic extract of kola. It can be inferred that the kola nut extract can be concentrated by membrane separation. The operating conditions defined for each stage allowed the purification - concentration of the kola extract and better performances of these membranes. Kola extract filtration through microfiltration and ultrafiltration membranes was perfect; the fouling of the membrane was rapid in MF and gradually in UF. A large amount of proteins was retained in these two steps. This retention promotes a gain of
purity of compound of interest such as caffeine, catechin and epicatechin. On the other hand, the high retention of the polyphenols during the ultrafiltration, impacts on the extraction yield of these compounds during the final concentration. However, direct concentration of the extract has more advantageous data on extraction yields and operating time. But, membrane clogging is significant and requires subsequent physical or chemical treatment before any reuse. Thus, the steps of microfiltration and ultrafiltration contribute to the purification of the feed stream but significantly reduce the content of the compounds, especially the polyphenols during ultrafiltration. However, the high extraction yield observed for each compound at the end of the concentration justifies the industrial interest that could be the extract of kola. The process could easily be adapted for other extract types. Taking into account the transmission of the compounds by the NF membrane, further studies should be done to separate extracts into different fractions of interest more or less important for the different industries.
COMPETING INTERESTS
Authors have declared that no competing interests exist.
REFERENCES
1. Scalbert A, Manach C, Morand C, Rémésy C. Dietary polyphenols and the prevention of diseases. Crit Rev Food Sci Nutr. 2005;45:287-306.
2. Naczk M, Shahidi F. Phenolics in cereals, fruits and vegetables: Occurrence, extraction and analysis. J Pharm Biomed Anal. 2006;41:1523-1542.
3. Campos M, Gomez K, Ordonez Y, Ancona D. Polyphenols, ascorbic acid and carotenoids contents and antioxidant properties of Habanero Pepper (Capsicum chinense) fruit. Food Nutr Sci. 2013;4:47-54.
4. D’Archivio M, Filesi C, Di Benedetto R, Raffaella Gargiulo, Claudio G, Masella R. Polyphenols, dietary sources and bioavailability. Ann Ist Super Sanità. 2007; 43(4):348-361.
Nyamien et al.; EJNFS, 7(1): 84-100, 2017; Article no.EJNFS.2017.005
and anticancer properties. Molecules. 2010;15:7313-7352.
6. Lima G, Vianello F, Corrêa C, Campos R, Borguini M. Polyphenols in fruits and vegetables and its effect on human health. Food Nutr Sci. 2014;5:1065-1082.
7. Bouterfas K, Mehdadi Z, Benmanssour D, Khaled M, Boterfas M, Latreche A. Optimization of extraction conditions of some phenolic compounds from white horehound (Marrubium vulgare L.) leaves. Int J Org Chem. 2014;4:292-308.
8. Odebode A. Phenolic compounds in the kola nut (Cola nitida and Cola aculinata) (Sterculiaceae) in Africa. Revista de Biologia Tropical. 1996;44(2):513-515. 9. Niemenak N, Onomo P, Fotso, Lieberei R,
Ndoumou D. Purine alkaloids and phenolic compounds in three Cola species and
Garcinia kola grown in Cameroon. S Afr J Bot. 2008;74:629-638.
10. Biego H, Yao D, Ezoua P, Chatigre O, Kouadio L. Niveaux de contamination en pesticides organochlorés des noix de Cola nitida. Int J Biol Chem Sci. 2009;3(6):1238-1245.
11. Atawodi S, Pfundstein B, Haubner R, Spiegelhalder B, Bartsch H, Owen R. Content of polyphenolic compounds in the Nigerian stimulants Cola nitida ssp, Cola nitida ssp. rubra A. Chev, and Cola acuminata Schott & Endl. and their antioxidant capacity. Agric Food Chem. 2007;55:9824-9828.
12. Boudjeko T, Rihouey C, Ndoumou D, El Hadrami I. Characterisation of cell wall polysaccharides, arabinogalactans-proteins (AGPs) and phenolics of Cola nitida, Cola acuminata and Garcinia kola
seeds. Carbohydr Polym. 2009;78:820-827.
13. Prohp T, Ekpo K, Osagie E, Osagie A, Obi H. Polyphenol contents and polyphenol oxidase activities of some Nigerian kolanuts. Pak J Nutr. 2009;8(7):1030-1031. 14. Tende A, Ezekiel I, Dare S, Okpanachi O, Kemuma O, Goji T. Study of the effect of aqueous extract of kolanut (Cola nitida) on gastric acid secretion and ulcer in the white wistar rats. Br J Pharmacol Toxicol. 2011; 2(3):132-134.
15. Atanda O, Olutayo A, Mokwunye F, Oyebanji A, Adegunwa M. The quality of
Nigerian kola nuts. Afr J food Sci. 2011; 5(17):904-909.
16. Azmir J, Zaidul I, Rahman M, Shari K, Mohamed A, Sahena F, Jahurul M, Ghafoor K, Norulaini N, Omar A. Techniques for extraction of bioactive compound from plant material: A review. J Food Eng. 2013;117:426-436.
17. Conidi C, Rodrigues A, Garcia-Castello E, Cassano A. Purification of artichoke polyphenols by using membrane filtration and polymeric resins. Sep Purif Technol. 2015;144:153-161.
18. Milani P, Prato A, Monteiro A, Maioral L, Costa S. Assessment of operating parameters, membrane fouling and juice quality during Acerola ultrafiltration. Chem Eng Trans. 2015;44:325-330.
19. Vernhet A, Moutonet M. Fouling of organic microfiltration membranes by wine constituents: Importance, relative impact of wine polysaccharides and polyphenols and incidence of membrane properties. J Membr Sci. 2002;201:103-122.
20. Ulbricht M, Ansorge W, Danielzik I, Konig M, Shuster O. Fouling in microfiltration of wine: The influence of the membrane polymer on adsorption of polyphenols and polysaccharides. Sep Purif Technol. 2009; 68:335-342.
21. Adjé F. Production par procédés membranaires couplés d'extraits polyphénoliques de Carapa porcera,
Delonix regia et Hibiscus sabdariffa. Détermination des structures moléculaires et des activités. France: Université Paul Cezanne. French. 2009;213.
22. Cissé M, Vaillant C, Pallet D, Dornier M. Selecting ultrafiltration and nanofiltration membranes to concentrate anthocyanins from roselle extract (Hibiscus sabdariffa
L.). Food Res Int. 2011;44:2607-2614. 23. Machado M, Mello B, Hubinger M. Study of
alcoholic and aqueous extraction of pequi (Caryocar brasiliense Camb.) natural antioxidants and extracts concentration by nanofiltration. J Food Eng. 2013;117:450-457.
24. Mehta A, Zydney A. Permeability and selectivity analysis for ultrafiltration membranes. J Membr Sci. 2005;249:245-249.
Nyamien et al.; EJNFS, 7(1): 84-100, 2017; Article no.EJNFS.2017.005
seeds and concentration by ultrafiltration. Sep Purif Technol. 2006;48(1):176-181. 26. Cassano A, Donato L, Drioli E.
Ultrafiltration of kiwifruit juice: Operating parameters, juice quality and membrane fouling. J Food Eng. 2007;79:613-621. 27. Diaz-Reinoso B, Moure A, Dominiguez H,
Parajo J. Ultra- and nanofiltration of aqueous extracts from distilled fermented grape pomace. J Food Eng. 2009;91:587-593.
28. Cassano A, Conidi C, Ruby-Figueroa R.
Recovery of flavonoids from orange press liquor by an integrated membrane process. Membranes. 2014; 4:509-524.
29. Nwuha V. Novel studies on membrane extraction of bioactive components of green tea in organic solvents: Part I. J Food Eng. 2000;44:233-238.
30. Tylkwoski B, Trusheva B, Bankova V, Giamberini M, Peev G, Nikolova A. Extraction of biologcally active compounds from propolis and concentration of extract by nanofiltration. J Membr Sci. 2010; 348:124-130.
31. Peshev D, Peeva L, Peev G, Baptista I, Boam A. Application of organic solvent nanofiltration for concentration of antioxidant extracts of rosemary (Rosmarinus officinallis L.). Chem Eng Res Des. 2011;89:318-327.
32. Murakami N, De Mello D, Prudêncio S, Amante R, De Moraes L, Maraschin M, Cunha Petrus C, Teófilo F. Concentration of phenolic compounds in aqueous mate (Ilex paraguariensis A. St. Hil) extract through nanofiltration. LWT – Food Sci. Technol. 2011;44:2211–2216.
33. Pinto P, Mota I, Loureiro J, Rodrigues A. Membrane performance and application of ultrafiltration and nanofiltration to ethanol/ water extract of Eucalyptus bark. Sep Purif Technol. 2014;132(1):234-243.
34. Vaillant C, Mady C, Chaverri M, Perez A, Dornier M, Viquez F, et al. Clarification and concentration of melon juice using membrane processes. Innov Food Sci Emerg Technol. 2005;6:213-220.
35. Vincze I, Banyai-Stefanovits E, Vatai G. Concentration of sea buckthorn (Hippophae rhanoides L.) juice with membrane separation. Sep Purif Technol. 2007;57(1):455-460.
36. Saidi S, Deratani A, Ben Amar R, Belleville M-P. Fractionation of tuna dark muscle hydrolysate by a two-step membrane process. Sep Purif Technol. 2013;108:28-36.
37. Koffi E, Le Guernevé C, Lozano P, Meudec E, Adjé F, Bekro YA, et al. Polyphenol extraction and characterization of Justicia secunda Vahl leaves for traditional medicinal uses. Ind Crops Prod. 2013;49:682-689.
38. Al Mamum A, Bhattacharjee S, Pernitsky D, Sadrzadeh M. Colloidal fouling of nanofiltration membranes: Development of a standard operating procedure. Membranes. 2017;7(4):19.
39. Nyamien Y, Chatigre O, Koffi E, Adima A, Biego H. Optimization of polyphenols extraction method from kola nuts (Cola nitida Vent. Schott & Endl.) using experimental design. Br Biotechnol J. 2015;7(1):40-50.
40. Bras T, Guerreiro O, Duarte M, Neves L. Impact of extraction parameters and concentration by nanofiltration on the recovery of phenolic compounds from
Cynara cardunculus var. altilis:
Assessment of antioxidant activity. Ind Crops Prod. 2015;67:137-142.
41. Singleton V, Rossi J. Colorimetry of total phenolics with phosphomolybdicphos-photungstic acid reagents. Am. J. Enol. Viticult.1965;16:144-158.
42. Wood J, Senthilmohan S, Peskin A. Antioxidant activity of procyanidin-containing plant extracts at different pHs. Food Chem. 2002;77(2):155-161.
43. Lowry O, Rosebrough J, Farr N, and Randall J. J Biol Chem.1951;193:265-275. 44. El Rayess Y, Albasi C, Bacchin P,
Taillandier P, Mietton-Peuchot M, Devatine A. Cross-flow microfiltration of wine: Effect of colloids on critical fouling conditions. J Membr Sci. 2011;385-386:177-186. 45. Nourbakhsh H, Alemi A, Emam-Djomeh Z,
Mirsaeedghazi H. Effect of processing parameters on fouling resistances during microfiltration of red plum and watermelon juices: a comparative study. J Sci Technol. 2014;51(1):168-172.
Nyamien et al.; EJNFS, 7(1): 84-100, 2017; Article no.EJNFS.2017.005
47. Vladisavljevic G, Vukosavjevic P, Bukvic B. Permeate flux and fouling resistance in ultrafiltration of depectinized juice using ceramic membranes. J Food Eng. 2011; 60(3):241-247.
48. Pagliero C, Ochoa N, Marchese J. Orange juice clarification by microfiltration: Effect of operational variables on membrane fouling. Lat Am Appl Res. 2015;41:279-284.
49. Azarte A. Procédés de séparation membranaire et leur application dans l'industrie alimentaire. In; French. 2008;56. 50. De Bruijn J, Venegas A, Borquez R.
Influence of crossflow ultrafiltration on membrane fouling and apple juice quality. In: Desalination; 2002:131-136.
51. Vernhet A, BellonFontaine M, Brillouet J, Roesink E, Moutounet M. Wetting properties of microfiltration membrane: determination by means of the capillary rise technique and incidence on the adsorption of wine polysaccharide and tannins. J Membr Sci. 1997;128:163–174. 52. Güell C, Czekaj P, Davis R. Microfiltration
of proteun mixtures and the effects oy yeast on membrane fouling. J Membr Sci. 1999;155:113-122.
53. Meireles M, Molle C, Clifton J, Aimar P. The origin of high hydraulic resistance for filter cakes of deformable particles: cell-bed deformation or surface layer effect? Chem Eng Sci. 2004;59:5819–5829. 54. Tarleton S, Wakeman R. Understanding
flux decline in crossflow microfiltration. Part 2 - Effects of process parameters. Chem Eng Res Des. 1994;72(3):431-440.
55. Arza S, Menachem E. Coupling between chemical and physical interactions in natural organic matter (NOM) fouling of nanofiltration membranes: implications for fouling control. J Membr Sci. 2002;203: 245-255.
56. Tarleton E, Wakeman R. Understanding flux decline in crossflow microfiltration -
Part I: Effects of particle and pore
size. Chem Eng Res Des. 1993;71(4):399-410.
57. Lu WM, Ju SC. Selective particle deposition in crossflow filtration. Sep Sci Tech. 1989;24(7-8):517.
58. Cardoso de Olivera R, Docê R, Davantel de Baros S. Clarification of passion fruit juice by microfiltration: Analyses of operating parameters, study of membrane fouling and juice quality. J Food Eng. 2012; 111:432-439.
59. Akdemir E, Ozer A. Application of a statistical technique for olive oil mill wastewater treatment using ultrafiltration process. Sep Purif Technol. 2008;62:222-227.
60. Ahmad A, Ismail S, Bhatia S. Ultrafiltration behavior in the treatment of agro-industry effluent: Pilot scale studies. 2005.
61. Nandi B, Uppaluri R, Purkait M. Identification of optimal membrane morphological parameters during microfiltration of mosambi juice using low cost ceramic membranes. LWT- Food Sci Technol. 2011;44:214-223.
62. Aimar P. Filtration membranaire (OI, NF, UF) - Mise en oeuvre et performances. In: Techniques de l'Ingénieur; 2006:18. French.
63. Cassano A, Conidi C, Figueroa R, Munoz R. A two-step nanofiltration process for the product of phenolic-rich fractions from artichoke aqueous extracts. Int J Mol Sci. 2015;16:8968-8987.
64. Paraskeva C, Papadakis G, Tsarouchi E, Kanellopoulou G, Koutsoukos G. Membrane processing for olive mill wastewater fractionation. Desalination. 2007;213:218-229.
65. Prudêncio A, Prudêcio E, Amboni R, Murakami A, Maraschin M, Petrus J, et al. Phenolic composition and antioxidant activity of the aqueous exract of bark from residues from mate tree (Ilex paraguariensis St. Hil.) bark harvesting concentrated by nanofiltration. Food Bioprod Process. 2012;90:399-405.
© 2017 Nyamien et al.; This is an Open Access article distributed under the terms of the Creative Commons Attribution License (http://creativecommons.org/licenses/by/4.0), which permits unrestricted use, distribution, and reproduction in any medium, provided the original work is properly cited.