University of Kentucky University of Kentucky
UKnowledge
UKnowledge
Theses and Dissertations--Economics Economics
2019
POLICY, AGGREGATE PRODUCTIVITY AND MISALLOCATION
POLICY, AGGREGATE PRODUCTIVITY AND MISALLOCATION
Guowen Chen
University of Kentucky, [email protected]
Digital Object Identifier: https://doi.org/10.13023/etd.2019.318
Right click to open a feedback form in a new tab to let us know how this document benefits you. Right click to open a feedback form in a new tab to let us know how this document benefits you.
Recommended Citation Recommended Citation
Chen, Guowen, "POLICY, AGGREGATE PRODUCTIVITY AND MISALLOCATION" (2019). Theses and Dissertations--Economics. 42.
https://uknowledge.uky.edu/economics_etds/42
STUDENT AGREEMENT: STUDENT AGREEMENT:
I represent that my thesis or dissertation and abstract are my original work. Proper attribution has been given to all outside sources. I understand that I am solely responsible for obtaining any needed copyright permissions. I have obtained needed written permission statement(s) from the owner(s) of each third-party copyrighted matter to be included in my work, allowing electronic distribution (if such use is not permitted by the fair use doctrine) which will be submitted to UKnowledge as Additional File.
I hereby grant to The University of Kentucky and its agents the irrevocable, non-exclusive, and royalty-free license to archive and make accessible my work in whole or in part in all forms of media, now or hereafter known. I agree that the document mentioned above may be made available immediately for worldwide access unless an embargo applies.
I retain all other ownership rights to the copyright of my work. I also retain the right to use in future works (such as articles or books) all or part of my work. I understand that I am free to register the copyright to my work.
REVIEW, APPROVAL AND ACCEPTANCE REVIEW, APPROVAL AND ACCEPTANCE
The document mentioned above has been reviewed and accepted by the student’s advisor, on behalf of the advisory committee, and by the Director of Graduate Studies (DGS), on behalf of the program; we verify that this is the final, approved version of the student’s thesis including all changes required by the advisory committee. The undersigned agree to abide by the statements above.
POLICY, AGGREGATE PRODUCTIVITY AND MISALLOCATION
DISSERTATION
A dissertation submitted in partial fulfillment of the requirements for the degree of Doctor of Philosophy in the
College of Business and Economics at the University of Kentucky
By
Guowen Chen
Lexington, Kentucky
Director: Dr. Ana María Herrera, Professor of Economics
Lexington, Kentucky
ABSTRACT OF DISSERTATION
POLICY, AGGREGATE PRODUCTIVITY AND MISALLOCATION
This dissertation explores the effects of factors such as industrial policy and listing on the stock market on manufacturing firms’ profitability and productivity.
The second chapter investigates the effect of industrial policies on misallocation using a rich data-set of Chinese firms. Using a difference-in-difference approach, I provide evidence that government policies (i.e. the 10th Five Year Plan) favoring particular industries lead to increased misallocation (i.e., an increase in the dispersion of revenue productivity across firms in four-digit industries). Moreover, the differential changes between industries supported and not supported by the 10th Five Year Plan are quantitatively large and indicative of a substantial negative impact on aggregate TFP. Using a changes-in-changes model, I find evidence that the Five Year Plan had a positive and significant effect for most of the TFPR distribution while the effect was negative for the lowest quintile of TFPQ and positive for the highest TFPQ quintile. The results suggest increased misallocation is related to the way in which the Chinese government doled out support through the increase of subsidies and the improvement of credit conditions for a subset of firms.
In the third chapter, I study the heterogeneous effects of an industrial policy -the 10th Five Year Plan on misallocation, profitability and real technology in Chinese provinces with different mix of supported intensities. I find that the 10th Five Year Plan increased misallocation, profitability and technology of supported industries in provinces with higher supporting intensities. After controlling the effects of China’s state-owned enterprise (SOE) reforms and joining into World Trade Organization (WTO), the results are still robust and consistent.
liability and capital structure.
KEYWORDS: Misallocation, Industrial Policy, Listing, Profitability, Technology
Author’s signature: Guowen Chen
POLICY, AGGREGATE PRODUCTIVITY AND MISALLOCATION
By Guowen Chen
Director of Dissertation: Dr. Ana María Herrera
Director of Graduate Studies: Dr. Josh Ederington
I dedicate this dissertation to my parents, Naiyou Chen and Tian’ai Qiao, and my
ACKNOWLEDGEMENTS
I would like to express my sincere appreciation and thanks to my advisor, Dr.
Ana María Herrera, for her unwavering support and guidance throughout the duration
of my doctoral studies at the University of Kentucky. I am extremely thankful for Dr.
Herrera’s encouragement and patience with me during the challenging process of
writing this dissertation. I would also like to thank the rest of my committee members,
Dr. Steven Lugauer, Dr. Jenny Minier and Dr. Mark Liu, for their invaluable advice,
insightful comments, and guidance. I would also like to thank Dr. Leonce Bargeron for
serving as the outside examiner to my dissertation defense.
I am thankful to Dr. William Hoyt for having faith in me and giving me the
opportunities to be a teaching assistant at the University of Kentucky. I would also like
to thank Dr. Adib Bagh, Dr. Felipe Benguria, Dr. Charles Courtemanche, Dr. Josh
Ederington, Dr. William Hoyt, and Dr. Carlos Lamarche for their helpful advice and
comments during the writing of the dissertation. I would also like to thank Dr. Bob
Gillette, Dr. Alejandro Dellachiesa, Dr. Gail Hoyt and Dr. Darshak Patel for their useful
teaching advice.
Last but not the least, I would like to thank my parents, Naiyou Chen and Tian’ai
Qiao, for their unconditional love all the time. I would like to thank my brother Zhao
Chen. And I would also like to thank Heyuan Wang, Weifeng Ma, Guomao Sun, and
TABLE OF CONTENTS
ACKNOWLEDGEMENTS ··· iii
LIST OF TABLES ··· vi
LIST OF FIGURES ··· viii
Chapter 1 Introduction ··· 1
Chapter 2 Policy and Misallocation ··· 4
2.1 Introduction ··· 4
2.2 Industrial Policy, Measurement, and Data ··· 9
2.2.1 China's Five Year Plans ··· 9
2.2.2 Measuring Misallocation ··· 11
2.2.3 Data ··· 13
2.3 The Effect of Industrial Policy on Misallocation ··· 15
2.3.1 Descriptive Evidence of the Impact of the 10th Five Year Plan on Misallocation ··· 15
2.3.2 Estimation Strategy ··· 16
2.3.3 Estimation Results ··· 18
2.4 Digging Deeper into the Distributional Effects of the 10th Five Year Plan ··· 19
2.4.1 The Effect of the 10th Five Year Plan on Average TFPR and TFPQ ··· 20
2.4.2 Heterogeneous Effects of the 10th Five Year Plan ··· 21
2.4.3 Mechanism: Taxes, Subsidies or Access to Credit? ··· 24
2.5 Key Findings ··· 28
2.6 Tables ··· 29
2.7 Figures ··· 37
Chapter 3 Unequal Effects of Industrial Policy ··· 42
3.1 Introduction ··· 42
3.2 Five Year Plan and Supporting Intensity ··· 43
3.2.1 The Five Year Plan ··· 43
3.2.2 The 10th Five Year Plan ··· 44
3.2.3 Supporting Intensity ··· 46
3.3 Regional Misallocation and Productivities ··· 47
3.3.1 Measurement of Misallocation, Profitability and Technology··· 47
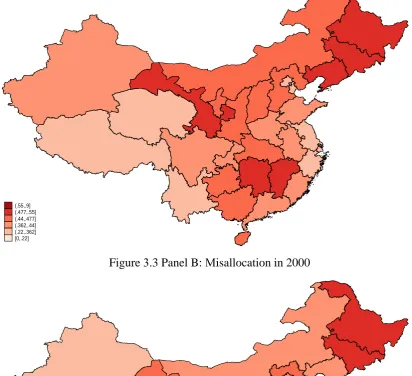
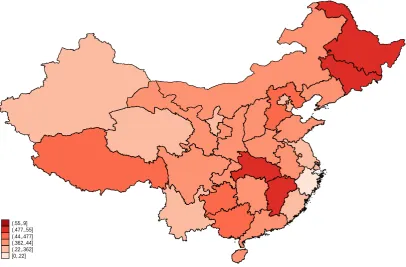
3.3.2 Quantifying Misallocation across Regions ··· 49
3.4 Empirical Analysis ··· 51
3.4.1 Method ··· 51
3.4.2 Results ··· 52
3.4.3 Concerns about Effects of the Five Year Plan on Intensity ··· 54
3.4.4 SOE Reform and WTO Joining ··· 55
3.4.5 Other Robustness Checks ··· 57
3.5 Key Findings ··· 58
3.6 Tables ··· 60
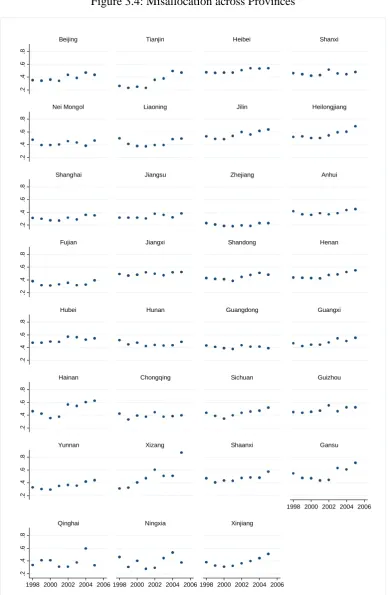
3.7 Figures ··· 68
Chapter 4 Listing, Profitability and Productivity ··· 74
4.1 Introduction ··· 74
4.2 Data ··· 77
4.3 Empirical Strategy ··· 78
4.4 Results ··· 80
4.5 Robustness Results ··· 82
4.5.1 Potential Selection Bias ··· 82
4.5.2 Spillover Effects of Large Cities ··· 84
4.5.3 SOE Reforms ··· 85
4.5.4 Requirements of Listing on a Stock Exchange ··· 86
4.6 Potential Channels ··· 87
4.7 Key Findings ··· 88
4.8 Tables ··· 90
Appendix A··· 107
A.1 Chapter 1 Appendix ··· 107
Bibliography ··· 135
LIST OF TABLES
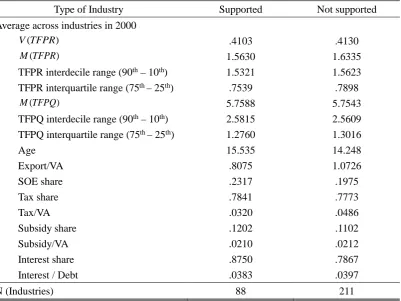
Table 2.1, Characteristics of Supported and Non-Supported Industries ... 29
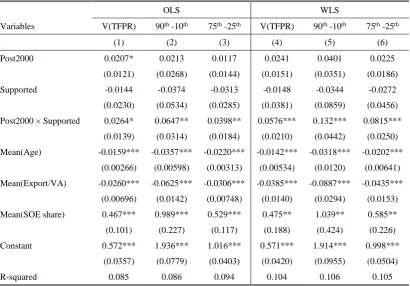
Table 2.2, Effect of the 10th Five Year Plan on the Dispersions of TFPR... 30
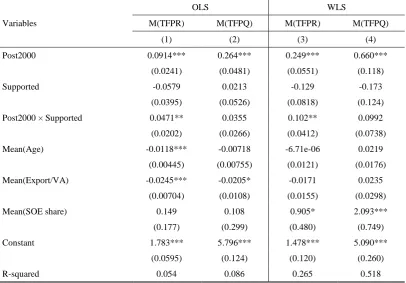
Table 2.3, Effects of the 10th Five Year Plan on Mean of TFPR and TFPQ ... 31
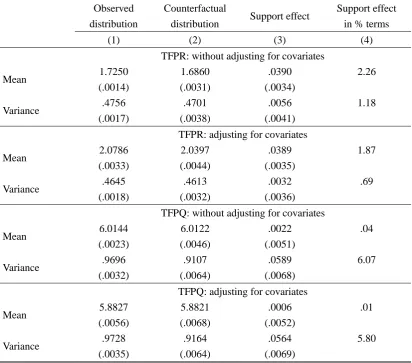
Table 2.4, Support Effects of the Five Year Plan on TFPR and TFPQ Dispersion ... 32
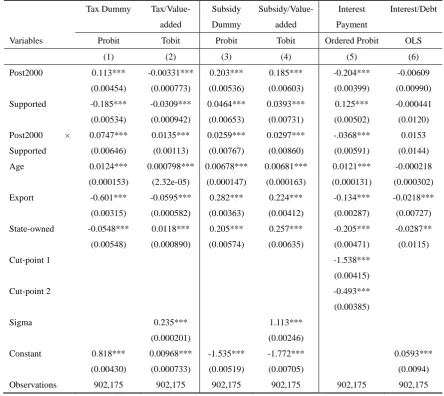
Table 2.5, Effects of the Five Year Plan on Taxes, Subsidies and Interest Payments ... 33
Table 2.6, Effects of the Five Year Plan on Tax Payments ... 34
Table 2.7, Effects of the Five Year Plan on Subsidies ... 35
Table 2.8, Effects of the Five Year Plan on Interest Payments ... 36
Table 3.1, Effects of the Five Year Plan on the Variance of TFPR ... 60
Table 3.2, Effects of the Five Year Plan on the Mean of TFPR ... 61
Table 3.3, Effects of the Five Year Plan on the Mean of TFPQ ... 62
Table 3.4, Effects of the Five Year Plan on the Variance of TFPR ... 63
Table 3.5, Effects of the Five Year Plan on the Mean of TFPR and TFPQ ... 64
Table 3.6, Effects of the Five Year Plan on the Variance of TFPR ... 65
Table 3.7, Effects of the Five Year Plan on the Mean of TFPR and TFPQ ... 66
Table 3.8, Effects of the Five Year Plan on the Variance or Mean of TFPR and TFPQ ... 67
Table 4.1, Summary Statistics of Listing and Non-Listing Firms ... 90
Table 4.2, First Stage Regressions Result of Listing on the Number of Investment Banks ... 91
Table 4.3, Effects of Listing on a Stock Exchange on Firm’s TFPR ... 92
Table 4.4, Effects of Listing on a Stock Exchange on Firm’s TFPQ ... 93
Table 4.5, Robustness Check of Effects of Listing on Firm’s TFPQ... 94
Table 4.6, First Stage Results of Listing on the Number of Investment Banks at Specific Early Years ... 95
Table 4.7, Effects of Listing on TFPR with the Number of Investment Banks at Early Years as Instrument ... 96
Table 4.8, Effects of Listing on TFPQ with the Number of Investment Banks at Early Years as Instrument ... 97
Table 4.9, Robustness Check of Effects of Listing on TFPQ with the Number of Investment Banks at Early Years as Instrument ... 98
Table 4.10, Effects of Listing on TFPR with Controlling Geographic Effects ... 99
Table 4.11, Effects of Listing on TFPQ with Controlling Geographic Effects ... 100
Table 4.12, Effects of Listing on TFPR with Controlling SOE Reforms ... 101
Table 4.13, Effects of Listing on TFPQ with Controlling SOE Reforms ... 102
LIST OF FIGURES
Figure 2.1, Normalized Mean or Variance of TFPR and TFPQ ... 37
Figure 2.2, Quantile Treatment Effects of the 10th Five Year Plan on TFPR... 38
Figure 2.3, Quantile Treatment Effects of the 10th Five Year Plan on Supported Firms’ TFPR ... 39
Figure 2.4, Quantile Treatment Effects of the 10th Five Year Plan on Supported Firms’ TFPQ ... 40
Figure 2.5, Quantile Treatment Effects of the 10th Five Year Plan on Supported Firms’ TFPR ... 41
Figure 3.1 Panel A, Value-added of Supported Firms to that of All Firms in 1998 ... 68
Figure 3.1 Panel B, Value-added of Supported Firms to that of All Firms in 2000 ... 68
Figure 3.1 Panel C, Value-added of Supported Firms to that of All Firms in 2001 ... 69
Figure 3.1 Panel D, Value-added of Supported Firms to that of All Firms in 2005 ... 69
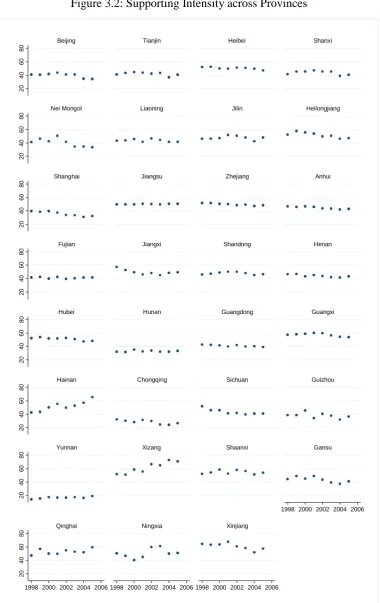
Figure 3.2, Supporting Intensity across Provinces ... 70
Figure 3.3 Panel A, Misallocation in 1998 ... 71
Figure 3.3 Panel B, Misallocation in 2000 ... 71
Figure 3.3 Panel C, Misallocation in 2001 ... 72
Figure 3.3 Panel D, Misallocation in 2005 ... 72
Chapter 1 Introduction
Misallocation will affect the differences in living standards between rich and poor
countries by lowering aggregate productivity. When labor and capital are not put to
their best or most efficient use, total production is, quite obviously, lower. Government
industrial policy can influence productivity across firms and misallocation across
industries. In the second chapter, I focus on the effects of government policy on
misallocation.
As to government policy, I focus on the most important industrial policy in China, the
Five Year Plan, to examine the effects of the Plan on misallocation. The Five Year Plans
are made by the central government every 5 years to guide economic and investment
activities. I use the 10th Five Year Plan because the data is from 1998 to 2005, and the
10th Five Year Plan is from 2001 to 2005. The official document allows us to match
narrowly defined supported industries with the corresponding 4-digit industry code. As
to why are these industries supported, we could not be able to infer all the reasons. For
example, the Plan intended to improve socialist, spiritual civilization, ensure stability,
and so on.
I follow Hsieh and Klenow (2009) to measure misallocation, which misallocation is
measured by the variance of revenue productivity. Revenue productivity should be
equal across firms within industry. Therefore, the smaller of the variance of revenue
productivity, the higher of total factor productivity of the industry.
The data used in the chapter is from the Annual Surveys of Chinese Manufacturing
from 1998 to 2005. It includes all state-owned and non-state-owned firms with nominal
revenues exceeding 5 million yuan. The number of observations ranges from about
165,000 in 1998 to 269,000 in 2005. I used firm’s value-added, wage payments, and
capital stock to compute revenue productivity and misallocation.
With a difference-in-difference approach, I test the effects of the 10th Five Year Plan on
industries, which in specific the 10th Five Year Plan increases misallocation by around
6.4% after 2000. Moreover, empirical results show that the Five Year Plan increases
profitability of supported industries, but has no significant effects on technology of
supported industries. As profitability is equal to price times technology, which means
the Five Year Plan only increases the markup of supported industries.
I further examine the heterogeneous effects of the Five Year Plan on the distributions
of revenue and physical productivity. The results show that the Five Year Plan increases
firm’s revenue productivity at most distributions, but only have negative effects on
technology of firms at the bottom percentiles, and positive effects on technology of
firms at the top percentiles, which one possible reason is that the governments support
firms with lower technology level to keep them survive. In addition, I investigate the
mechanism of how does the Five Year Plan work on misallocation. Starting with the
three most commonly used methods by government, which they are tax reduction,
subsidy and access to credit, I find evidence that the Five Year Plan increases
misallocation by direct subsidies and better credit condition.
I take a new approach by focusing on the unequal effects of industrial policy across
provinces in the third chapter. A large and growing literature has investigated the effects
of industrial policies on economic outcomes such as growth and productivity. However,
the effects of the same industrial policy might vary across different regions. Using
Chinese manufacturing firm-level data, I examine whether there are unequal effects of
the most important industrial policy in China, the Five Year Plan, on misallocation,
profitability and real technology.
Consistent with chapter 2, I use the variance of revenue productivity within an industry
to measure misallocation, revenue productivity to measure profitability and physical
productivity to measure technology. As local governments are the executors of the
industrial policy, local governments might support the targeting industries differently
due to different economic status of the supported industries. I introduce supporting
intensity, which it is the share of value-added of supported industries in a province to
denote supporting intensity in that province, to capture the difference of the same
confirm the findings of the former chapter. Industrial policy increases misallocation and
profitability. However, the Five Year Plan has a positive effect on the technology levels
of provinces with higher supporting intensities.
I address the question what changes do listing on a stock market bring to firms’
productivity and profitability in the fourth chapter. However, the decision to be listed
on the stock market for firms can be endogenous due to reverse causality and
unobserved variables. I use the number of investment bank in a city as the instrument
variable to tackle the endogenous effects. The number of investment banks in a city has
no correlation with firms’ profitability or technology except via listing.
The data about firm’s information is from Chinese firm-level data from the Annual
Surveys of Industrial Production, and the information about listing is from WIND data
base. With propensity score match method and a difference-in-difference model, I find
that listing on a stock exchange increases firm’s profitability and technology. The
Chapter 2 Policy and Misallocation
2.1 Introduction
A large and growing literature has argued that misallocation contributes substantially
to the differences in living standards between rich and poor countries1. When labor and
capital are not put to their best or most efficient use, total production is, quite obviously,
lower. Misallocation can happen for a variety reasons including constraints on factor
mobility from financial frictions or employment restrictions, taxes or trade policy, or
the government explicitly fostering certain industries for political or other reasons. Our
analysis concerns the last of these: direct government intervention.
We provide evidence that government policies favoring particular industries or firms
lead to misallocation. In particular, we estimate the effect of China's Five Year Plans
using micro-level data on Chinese firms. The misallocation of resources within
industries supported by the 10th Five Year Plan increases relative to not supported
industries. We measure misallocation as the dispersion of revenue productivity (price
times total factor productivity) across firms in an industry; the differential changes in
this dispersion for supported industries versus not supported industries is quantitatively
large, indicating that this type of misallocation is important for understanding
productivity differences both within and across countries.
Since the foundation of the People's Republic of China, the central government has
controlled economic activity by making explicit policies to direct the deployment of
resources. The plans are usually updated every five years. Although almost all countries
have some policies favoring certain firms or industries, China's economy-wide
re-shuffling of economic priorities makes for a poignant case study. We use information
from the Annual Survey of Industrial Production, which contains data on Chinese firms
from 1998 to 2005, to estimate the misallocation due to the centralized planning in
1
China. The survey covers a large sample of firms included in the manufacturing
industries that were the target of the 10th Five Year Plan, and it also includes industries
that were neither targeted by this plan, nor by the 9th Five Year Plan. Hence, the data is
well-suited to our needs, as it allows us to identify the effects of the 10th Five Year Plan
by comparing differences in misallocation between supported and not supported
industries.
Our work is closely related to that of Hsieh and Klenow (2009) who use the same data
to quantify productivity losses from misallocation in China (and India) relative to the
United States. We build from the empirical approach developed in Hsieh and Klenow;
however, our analysis is more disaggregated and seeks to answer a question only
tangentially addressed in their paper. Whereas Hsieh and Klenow focus on the degree
of misallocation across all manufacturing firms in China, we estimate the increase in
misallocation within the specific industries supported by the Five Year Plan. In this
sense, we provide the details, or a concrete very large example (the Five Year Plan), of
how the country-wide misallocation documented by Hsieh and Klenow may result from
a particular policy intervention. However, as we will explain below, we depart from
Hsieh and Klenow in that we exploit the firm-level data to investigate the distributional
effect of the Five Year Plan on productivity. We believe that tracing the effects out to
the firm-level and mapping the cause to specific policies are important contributions.
The literature has debated whether the type of country-wide comparisons used by Hsieh
and Klenow (2009) really measure misallocation or instead capture other differences
between countries. Our empirical strategy and results are consistent with the
misallocation interpretation, lending strong support to Hsieh and Klenow (2009)2.
To measure misallocation, we calculate revenue productivity (the product of physical
productivity and a firm's output price) for each firm. In the absence of firm-level
distortions, according to the theory laid out in Hsieh and Klenow (2009), revenue
productivity will be equated across firms. In other words, capital and labor will be
employed where their marginal value is highest. If, instead, there exists dispersion in
2
the revenue productivity across a set of firms, then this dispersion indicates the degree
to which distortions are keeping capital and labor from finding their most efficient uses.
These distortions mean that resources are misallocated, which lowers both total factor
productivity (TFP) and the total output produced by a given set of inputs. Thus, we use
the variance of total revenue productivity (the dispersion of TFPR) across firms in an
industry as our primary measure of misallocation.
The data allow us to categorize firms into industries according to the Chinese National
Bureau of Statistics classification codes. We use codes at the finest (4-digit) level to
group firms into highly disaggregated industries and calculate the variance of TFPR in
each industry. Importantly, the official documents of the 9th and the 10th Five Year Plans
enable us to distinguish which 4-digit industries each plan supported. Our empirical
approach, then, is to use a difference-in-difference (DID) regression model to estimate
the impact on the variance of TFPR. To identify policy effects, we compare differences
in the variance of TFPR between industries newly supported by the 10th Five Year Plan
and those industries receiving no support in either the 9th or 10th Five Year Plan. This
DID approach offers several advantages. First, it fits well with our data, which consists
of repeated cross-sections rather than a panel of firms. We can directly account for
observed differences across industries and over time through a series of control
variables, but the DID model also allows us to net out remaining differences in
misallocation between supported and not supported industries, as well as to control for
the aggregate upward trend in misallocation. We interpret the resulting regression
estimates as evidence that the centralized plans increased misallocation, especially for
the supported industries. Our results suggest that the Five Year Plan increased
misallocation by at least 6 percent and probably by much more. This large and
statistically significant impact on misallocation leads us to the second part of our paper
- exploring how the policies worked to increase misallocation.
We begin by showing that the average TFPR of firms in supported industries increased
relative to firms in not supported industries, but average physical productivity (TFPQ)
was unchanged. This finding suggests that the policies impacted average prices more
changed. In other words, the average effect masks heterogeneity across firms with
different levels of TFPR and / or TFPQ. To show this, we deviate from Hsieh and
Klenow and employ the firm-level data (rather than aggregating to the four-digit
industry level as with the DID approach) to estimate the quantile treatment effect of the
Five Year Plan on the supported firms. Specifically, we estimate the non-linear
difference-in-difference model, commonly known as the changes-in-changes (CIC)
model proposed by Athey and Imbens (2006). This approach enables us to investigate
how the policies affected the full TFPR and TFPQ distributions. The results indicate
that the Five Year Plan had a positive and significant effect on most of the TFPR
distribution, yet the quantile treatment effect is somewhat larger for the extreme right
tail. As for the TFPQ distribution, the effect is negative and significant for the lower
quintile (the least productive firms), positive and significant for the highest quintile,
and insignificant for the middle quintiles. In short, while the implemented industrial
policies caused the most productive firms to become more productive, firms in the
extreme left tail of the distribution became even less productive. This set of results is
consistent with the idea that the Five Year Plan tended to support large, low productivity
firms, reducing their productivity even further.
The heterogeneous effect on the distribution of TFPR and TFPQ, thus poses the
question: what mechanisms were used by the Chinese government to promote the
supported industries? After all, if increased dispersion in TFPR is a result of
government policies, then we should be able to relate changes in the distribution of
TFPR to explicit support mechanisms used by the government. To tackle this question,
we first inquire whether the 10th Five Year Plan impacted the probability that firms in
the supported industries would pay taxes, receive subsidies or pay/receive interest
relative to the not supported firms. We also examine whether these policies affected the
ratio of taxes to value added, the ratio of subsidies to value added, and the ratio of
interest payments to debt. Second, we partition the firms into three groups according to
the terciles of the TFPR distribution for each four-digit industry. Splitting the firms into
groups allows us to examine whether the Five Year Plan had a heterogeneous effect on
number of firms in each group. Intuitively, TFPR will increase more for firms that face
larger disincentives in the form of higher taxes, worse credit conditions, or smaller
subsides. Our estimation results suggest that the Chinese government doled out support
to industries via direct subsidies and improved credit conditions. Moreover, the
differential treatment in terms of the probability of receiving support through taxes and
subsidies (as well as in the magnitude of the support) for different parts of the TFPR
distribution suggest that the two mechanisms may have increased the wedge between
the observed and the efficient level of TFPR and decreased aggregate TFP. As a result
of the Five Year Plan, high-TFPR firms in supported industries experienced a relative
increase in taxes; whereas the least productive firms received larger subsidies. The 10th
Five Year Plan appears to have diverted resources away from high productive firms
towards low productive firms, within the supported industries.
Our results are in line with the theory and empirics from Restuccia and Rogerson (2008)
who find that distortions at the firm level, stemming from tax and subsidy policies,
reduce aggregate productivity. In addition to the Restuccia and Rogerson (2008) and
Hsieh and Klenow (2009) papers, our work is related to several other studies on
misallocation. Foster, Haltiwanger, and Syverson (2008) use revenue and physical
productivity to measure firm profitability. Melitz (2003) argues that capital
misallocation results in lower total factor productivity growth. Song and Wu (2015)
find that capital misallocation decreases output, and Alfaro et al. (2008) find that it
results in lower income. Aghion et al. (2008) find the effects of industrial policy reform
are unequal across Indian states because the labor market environments differ. Guner et
al. (2008) also find the effects of policies on productivity vary due to different firm
characteristics. Bartelsman et al. (2010) argue that firm size affects firm productivity.
Finally, Dollar and Wei (2007) find that state-owned firms in China have lower
efficiency.
The paper proceeds as follows. Section 2.2 details how we use the firm-level data to
measure misallocation and offers a brief overview of China's Five Year Plans. Section
2.3 discusses the empirical strategy, presents our main empirical results as well as
average TFPR and TFPQ, tests whether the effects were heterogeneous across the TFPR
and TFPQ distributions, and examines the mechanisms used to provide support. Section
2.5 concludes.
2.2Industrial Policy, Measurement, and Data
Our regressions exploit the variation in which industries were supported by China's
Five Year Plans in order to estimate the policy's effect on the misallocation of resources.
In this section, we first discuss the Five Year Plans and which industries received
support. We then review the theory on how to measure misallocation. Finally, we detail
the firm-level information used to compute misallocation by industry.
2.2.1 China's Five Year Plans
Many countries implement industrial policies aimed at encouraging the development
and growth of certain industries. In China, these policies take the form of Five Year
Plans developed by the State Council (the central Communist government). The
Chinese central government issued the first Five Year Plan in 1953. The objective of
the earlier Five Year Plans was to establish and promote different industries by making
specific investments and establishing growth objectives for each particular industry.
The first Five Year Plans sought to establish a variety of industries in China during a
period when the economy was centrally controlled and closed. However, since the
policy of "grasping the large and letting go of the small" was enacted in 1997, a
movement towards privatization has taken place. Moreover, the Five Year Plans have
shifted from delineating investment and growth objectives for each industry towards
establishing macroeconomic objectives and identifying particular industries to
strengthen.
As mentioned in the introduction, we focus on the 10th Five Year Plan because its onset
and implementation (2001-2005) are covered by the available data, which begins in
1998. The general objectives, according to the Report on the Outline of the 10th Five
First, achieve an average economic growth rate of about 7%. Second, adjust
development patterns across different industries and regions, as well as between urban
and rural areas. This objective required strengthening agriculture, developing the
service industry, and reinforcing infrastructure. Third, increase openness and prioritize
the development of science, technology, and education. Fourth, raise living standards
by creating more jobs, increasing personal income, making the income distribution
more equitable, and improving the social security system. Lastly, coordinate sustainable
economic, social, and environmental development.
More specifically, the 10th Five Year Plan --as with all Five Year Plans-- lays out the
industries (or whole sectors) to be supported over the following five years. The
documentation thus allows us to match narrowly defined supported industries with the
corresponding 4-digit industry code. For example, alumina manufacturing (3316), gas
turbine manufacturing (3513), integrated circuit (4035), paper making (3641), and
many others were specifically targeted for support. However, in several cases, the 10th
Five Year Plan promotes the development of more broadly defined industries, such as
‘plastic manufacturing’. In these cases, we treat the corresponding two-digit industry
as supported. Industries supported in the 10th Five Year Plan cover a large number of
establishments in agricultural products processing, textile, textile products processing,
leather related products manufacturing, paper and paper products, chemical products,
pharmaceutical manufacturing, chemical fiber, rubber, plastic manufacturing,
non-metallic mineral products, ferrous and nonferrous metal smelting, transportation and
electrical equipment, communications and computers, and instrumentation
manufacturing. Yet, a large number of industries such as chemicals, rubber and plastics,
and motor vehicles received no support. For the sake of brevity, we refer the reader to
the Appendix for a complete list of supported industries.
We conclude this section by noting that we are not able to infer all the reasons why
some industries are featured in the 10th Five Year Plan from the available documentation.
The stated justification is not only economic; the policies also were intended to
"improve socialist, spiritual civilization, democracy and the legal system, balance
undertakings, and ensure social stability". Nevertheless, our hypothesis is that the
resources used for supporting firms within an industry (however these industries were
selected) are not necessarily put toward their most efficient use. Specific firms may
receive support to accomplish any number of objectives and especially for political
expediency. Moreover, while the policy is formulated at the national level, local party
officials often decide which firms to target. In particular, as we will show, there appears
to be a tendency for low productivity to receive subsidies. Thus, resources may be
directed to less efficient firms in supported sectors, distorting certain industries. How
much the Five Year Plans worsen (or improve) misallocation is an empirical question.
2.2.2 Measuring Misallocation
We measure misallocation based on the theory developed in Hsieh and Klenow (2009).
They posit that revenue productivity (TFPR), the product of physical productivity and
output price, should be equal across firms in the absence of distortions. The intuition is
as follows. If firms operating in the same industry have access to the same technology
and face the same input (capital and labor) prices, then, in the absence of firm-level
distortions, TFPR should be equalized across firms. Thus, the greater the dispersion in
TFPR, the greater is the misallocation of resources3.
Following Hsieh and Klenow (2009), we consider an environment of monopolistic
competition. Each specific firm i in industry s produces differentiated output Ysi. Total
industry output Ys is a constant elasticity of substitution (CES) aggregate of output
from the Ms firms in the industry
1 1
1 s M
s si
i
Y Y
σ
σ σ
σ
− −
=
=
∑
where σ is the elasticity of substitution between varieties within the industry's CES
3
The idea of using dispersion across firms to study misallocation also can be traced to Restuccia
and Rogerson (2008). Foster, Haltiwanger, and Syverson (2008) first used physical productivity
aggregator. Each individual firm uses a Cobb-Douglas production technology
1
s s
si si si si
Y =A K Lα −α
where Asi is the firm specific technology level, K is capital, L is labor, and the capital
and labor shares (αs) are allowed to vary across industries. An individual firm's TFPR
is given by
1
( )
s s
si si
si si si
si si
P Y
TFPR P A
Kα wL −α
= = (2.1)
where firm i sets price Psi and all firms face wage w . Hsieh and Klenow (2009)
provide further details on the model's economic environment and for the derivation of
TFPR. We also examine total factor physical productivity (TFPQ). TFPR equals Psi
times TFPQ: 1 ( ) s s si si si si si Y TFPQ A
Kα wL −α
= = (2.2)
We take Equation (2.1) as the definition of firm specific TFPR, and we use the
dispersion or variance of TFPR across firms in an industry as our measure of
misallocation. Again, theoretically, there should be no dispersion in TFPR in the
absence of distortions4.
Furthermore, Hsieh and Klenow (2009) show that industry specific total factor
productivity (TFPs) can be written as
1
1
1
log log( ) var(log )
1 2
s M
s si si
i
TFP Aσ σ TFPR
σ
−
=
= −
−
∑
(2.3)where the summation is over the Ms firms in industry s, σ is the elasticity of
substitution, and var takes the variance across the logged TFPR of firms in the industry5.
4
As noted in the Introduction, the literature has suggested other factors that could impact the dispersion of TFPR, which are not captured by this model and are not necessarily misallocation. See Feng (2018), for example. However, in our empirical approach below, we rely on differential changes in the dispersion of TFPR that are unlikely to affected by any other factor other than the misallocation of resources.
5
Note, the variance of TFPR is a sufficient statistic to measure the decrease in TFP due
to the dispersion in TFPR. The larger an industry's TFPR dispersion, the lower the
sector's aggregate total factor productivity. If resources could be reshuffled to firms
with a higher marginal productivity, then the dispersion of TFPR would decrease and
output would be higher. Thus, the dispersion in TFPR constitutes a suitable way to
measure misallocation. Moreover, although there are many mechanisms by which
misallocation could manifest itself, an increase in misallocation will result in larger
dispersion in TFPR6.
2.2.3 Data
To calculate the degree of misallocation within each industry, we use repeated
cross-sections of firm-level data from the Annual Surveys of Industrial Production, which
was collected by China's National Bureau of Statistics from 1998 to 2005. The survey
includes non-state-owned firms with nominal revenues exceeding 5 million yuan
(around $700,000) and all state-owned firms. The non-state-owned firms contain
private, foreign and hybrid firms (local collectives, local government owned, etc.). The
number of observations (firms) ranges from about 165,000 in 1998 to about 269,000 in
2005. The data set includes information on the firm's industry (at the 4-digit level),
value-added, export revenues, capital stock, the number of employees, wage payments,
ownership, age, interest payment, liabilities, and taxes paid and subsidies received.
We compute TFPR for each firm-level observation from Equation (2.1) using data on
value-added, wage payments, and capital stock. Because prices, Psi , and non-wage
compensation are not available in the survey, we follow Hsieh and Klenow (2009) and
compute them as follows. First, we equate P Ysi si to the firm's value-added. Second, we
define Ksi as the book value of fixed capital net of depreciation. Third, we assume
that the sum of the imputed benefits and wages --the non-wage compensation absent
6
from the survey-- equals 50% of the value-added. We then map industry specific labor
shares, 1−αs, obtained from the NBER Productivity Database for the United States
(based on the Census and Annual Survey of Manufacturers), into our data set7. After
obtaining TFPR for each firm, we calculate the mean and the variance of TFPR for each
4-digit industry (separately for each year). Recall that the latter corresponds to our
measure of misallocation.
To further explore how total factor productivity is affected by the 10th Five Year Plan
we compute annual TFPQ for each firm i in the following manner. Given that data on
firm-level output, Ysi, is not available from the survey, we follow Hsieh and Klenow
(2009) and raise the firm's value-added, P Ysi si , to the power σ/(σ-1) to obtain an
estimate of Ysi. Replacing this estimate in Equation (2.4) we obtain
1 1 ( ) ( ) s s si si si si si si P Y TFPQ A K wL σ σ α α − −
= = (2.4)
where σ is the elasticity of substitution as defined above. Estimates of σ range from
three to ten in the literature (Broda and Weinstein, 2006; Hendel and Nova, 2006). We
set σ equal to three in the benchmark estimation and check the robustness of the results
to using other values.
As mentioned earlier, our sample spans some --but not all-- years covered by the 9th
Five Year Plan as well as the years when the 10th Five Year Plan was in place. Of the
482 four-digit industries included in the Chinese Industrial Classification code, 117
were supported by the 9th Five Year Plan. We exclude these industries from the sample
in order to avoid confounding the effect of the 10th Five Year Plan with that of its
predecessor. In addition, there are a few industries where the number of firms is too
small to obtain a meaningful measure of misallocation. Thus, we retain only the
industries that have 10 or more firms in each year. The resulting sample has a 902,175
establishments across the eight years grouped in 299 industries. Of these industries, 88
were supported by the 10th Five Year Plan. This group of industries constitutes our
7
"treatment" group and we will refer to it as the supported group. The remaining 70% of
the industries in the sample comprise our "control" or not supported group. The
regressions below exploit the differential changes in the variance of TFPR across
supported and not supported industries in order to estimate the impact of China's Five
Year Plan on misallocation.
2.3The Effect of Industrial Policy on Misallocation
This section provides descriptive evidence showing the effect of the 10th Five Year Plan
on the variance of TFPR, explicitly details our difference-in-difference regression
approach, and then presents our main results.
2.3.1 Descriptive Evidence of the Impact of the 10th Five Year Plan on Misallocation
The evolution of the variance of the logarithm of TFPR (var(logTFPR)) provides
preliminary evidence that indicates the industrial policy leads to an increase in
misallocation. Figure 2.1 plots the average var(logTFPR) for supported (solid line) and
unsupported (dashed line) industries for each year in our sample. In the figure, we
normalize our measure of misallocation to be 1 in 1998; the Appendix contains an
un-normalized version of Figure 2.1. Both groups had similar trends in misallocation prior
to the enactment of the 10th Five Year Plan. Before 2001, misallocation for both groups
was trending down. After 2001, misallocation increased for both groups. However, the
increase was much larger for the supported industries. Relative to its nadir in 2001,
misallocation in supported industries increased by 25 percent by 2005, about a 16
percent increase relative to 1998. For industries not supported by the 10th Five Year
Plan, misallocation increased by only 10 percent relative to 1998. This pattern suggests
that the 10th Five Year Plan had a differential, and very large, impact on misallocation
within supported industries. Since the average var(logTFPR) increased for both groups,
it is also consistent with the notion that the 10th Five Year Plan increased misallocation
overall.
across different industries. This goal suggests the possibility that the Chinese
government decided to support particular industries because it prioritized industries
where misallocation was greater. If this were true, then this `reverse causality' might
bias our estimates and change the interpretation of our results. However, we see no
evidence that industries were targeted for support based on the misallocation observed
prior to the 10th Five Year Plan. Table 2.1 reports the average variance of log TFPR, the
mean of TFPR, and the mean of TFPQ broken down by supported and not supported
industries in 2000. The average misallocation (dispersion of TFPR) exhibited within
supported industries (0.410) was almost identical to the misallocation in not supported
industries (0.413). Nevertheless, the firms supported by the 10th Five Year Plan were,
on average, older and less export oriented and had greater government ownership.
2.3.2 Estimation Strategy
Our difference-in-difference (DID) regression approach allows us to adjust the raw
comparison in Figure 2.1 by other covariates that could affect misallocation. This
estimation strategy fits well with the fact that the data used in this paper consists of
repeated cross-sections of firms sampled from the same aggregate industries, s, and not
of a panel of firms. Misallocation within industries selected for support could differ
from those industries not selected, and the period following the 10th Five Year Plan
(after 2000) could have had a different level of misallocation for all industries. The DID
lets us directly control for both of these concerns. We estimate the following regression:
0
(log )st * 2000t * s ( 2000 * )st st st
Var TFPR =α φ+ Post +η Supported +β Post Supported +X γ ε+
(2.5)
where Var(logTFPR)st is the variance of log TFPR across firms in industry s in year t,
2000t
Post is a dummy variable equal to 1 if the year is after 2000, Supporteds is a
dummy equal to one if the industry was supported by the 10th Five Year Plan, Xst is
a vector of covariates, and εst represents the error term.
average firm age, the average share of revenues from exports relative to value-added,
and the proportion of state-owned enterprises (SOE) in the industry. The motivation for
including these controls is as follows. Several studies have documented a relationship
between productivity and observable characteristics of the firm such as their age and
size (see, e.g. Doms, Dune and Roberts 1995; Jensen, McGuckin and Stiroh 2001).
These variables are commonly used to capture differences in efficiency that stem from
different levels of experience, managerial ability and production technologies. Here,
because we use a measure of volatility at the industry level, we control for the average
age in the industry. As for exports, empirical evidence from firm-level data suggests a
positive relationship between the share of exporting firms and productivity. For instance,
Wagner's (2007) survey of micro-economic studies finds that exporting firms are more
productive than non-exporters and "more productive firms self-select into export
markets". Hence we control for the average ratio of exports to value added in each
industry, export/VA. The export/VA ratio is also intended to control for the increased
participation of China in world trade8. Finally, starting in 1996 the Chinese government
implemented a series industrial policies known as "grasping the large and letting go of
the small" intended to privatize and reduce the size of the state sector. Curtis (2016)
suggests that total factor productivity increased with the growth of the private sector
and the closing of the least productive SOEs. Hence, the dispersion of TFPR may vary
across industries depending on the share of SOEs.
The coefficients δ and η account for fixed differences in misallocation before and after
2000 and between supported and not supported industries, respectively. Thus, the
coefficient β captures how being supported by the 10th Five Year Plan affects
misallocation. This is the key parameter of interest. It compares Var(logTFPR)st, our
measure of misallocation, in the supported industries, before and after the plan was put
in place, with Var(logTFPR)st of the not supported group over the same period. In this
8
manner we are able to exploit cross-section and time series variation in the data while
avoiding confounding the effect of the policy with that of unobserved variables that
could have affected all industries at the same time.
2.3.3 Estimation Results
Table 2.2 reports the estimation results for Equation (2.5). Column (1) reports OLS
estimates, with the control variables. Column (4) reports WLS estimates, also with the
controls, where industries are weighted by value-added. Each regression is based on the
full panel of 8 yearly observations for the 299 industries in our sample, or 2,392
observations in total. Robust standard errors clustered by industry are in parentheses.
The estimate of β (on Post2000×Supported) is statistically significant at the 10% level
or better in all specifications. This represents our main empirical finding. Supported
industries experienced a greater increase in misallocation than industries that were not
supported by the 10th Five Year Plan. We take this as strong evidence that the process
used to carry out China's centralized industrial plan did not deliver more resources to
the firms in which the resources could be put to their best use, at least not over the Five
Year time horizon included in our analysis.
Moreover, the impact on misallocation is quantitatively large. Consider the most
conservative result; in column (1), the estimate of β equals 0.026. One way to interpret
this number is to look back at Table 2.1. The variance of TFPR in supported industries
averaged about 0.41 in 2000. Thus, supported industries had about a 6.4 percent
increase in misallocation (relative to being in the not supported group) after 2000,
directly attribute to the Five Year Plan. This 6.4 percent increase accounts for a large
portion of the overall increase in misallocation over time (about 25 percent in Figure
2.1) and for nearly all the difference between supported and unsupported industries.
Another way to interpret β is to look back at Equation (2.3). The increase in the variance
of TFPR reduced overall TFP within supported industries. The exact magnitude of this
effect depends on the parameter σ, but even at moderate values (e.g. 3), the effect is
(4) of Table 2.2, the WLS estimate for β is larger (0.058 versus 0.026). The policy
appears to have had a strong impact on the misallocation of resources within large
industries. Thus, the impact on the overall Chinese economy (rather than the impact for
the average industry) may have been very big because the larger industries, quite
obviously, make up a large share of the economy. If the 10th Five Year Plan increased
misallocation by 15 percent or more within the large supported industries, then this
greatly reduced overall TFP growth.
It is also worth noting that misallocation went up for both supported and not supported
industries over time. This pattern can be seen in Figure 2.1, and is reflected in the
positive and significant estimate of δ (see Table 2.2). The coefficient estimate (η) for
Supported is negative, although not statistically significant (possibly due to the fact that
misallocation actually becomes larger for supported industries after 2001). In columns
(1) and (4), the coefficient estimates for the other covariates have their expected sign.
Older industries are more homogeneous in terms of TFPR. The coefficients of the mean
of export revenues to value added are negative and significant in each specification,
which indicates that industries with a higher share of export revenues to value added
have less misallocation. Finally, industries with more State-Owned Enterprises exhibit
much greater misallocation.
While the use of the variance of log(TFPR) to measure misallocation follows naturally
from the work of Hsieh and Klenow (2009), other measures of dispersion also provide
useful information regarding the effect of industrial policies. We have re-estimated
Equation (2.5) using the interdecile and interquartile range as dependent variables. The
estimation results reported in Columns (2), (3), (5), and (6) of Table 2.2 confirm our
previous findings: industrial policies resulted in a significant increase in misallocation.
Indeed, the effect appears to have been larger for firms further away in the tails of the
distribution, a topic we return to shortly.
2.4Digging Deeper into the Distributional Effects of the 10th Five Year Plan
and misallocation. First, we present evidence that the 10th Five Year Plan increased
average TFPR for supported firms but had little or no effect on average TFPQ. Two
alternative, but not mutually exclusive, explanations for the increase in misallocation
(dispersion of TFPR), the increase in average TFPR, and the insignificant effect on
average TFPQ are as follows. First, government policies may have had a heterogeneous
effect on firms with different TFPR levels, so that the distortions introduced by the
policies drove a larger wedge between the marginal products of capital and labor across
firms, while leaving average productivity unaffected. Second, the support given to high-
and low- productive firms might have been different. Both these possibilities have merit.
We first show that the effect of the policy was heterogeneous across firms with different
levels of revenue (TFPR) or physical (TFPQ) productivity. Then, we show that high-
and low- productivity firms within supported industries received different levels of
support. In particular, low-productivity firms in supported industries received tax
breaks and direct subsidies.
2.4.1 The Effect of the 10th Five Year Plan on Average TFPR and TFPQ
The results presented in the previous section revealed that the 10th Five Year Plan
increased misallocation as measured by the variance of TFPR. What was the effect of
this industrial policy on the mean of TFPR and TFPQ? This section addresses this
question by re-estimating Equation (2.5) where we replace the variance of TFPR with
the industry mean of log TFPR. Columns (1) and (3) in Table 2.3 report the results.
Again, we focus on the estimated coefficient for the interaction term
(Post2000 *Supported)st . Across all specifications, the estimate of β is positive and
statistically significant at the 5% level. The 10th Five Year Plan tended to increase TFPR
for firms in supported industries. These firms became more profitable relative to firms
in not supported industries.
Columns (2) and (4) in Table 2.3 report the results using mean log TFPQ as the
dependent variable. In these regressions, the null of no average treatment effect (β=0)
average TFPQ. We find no evidence that supported firms experienced an increase in the
average physical productivity or technology level. Recall from Equations (2.1) and
(2.2), TFPR equals TFPQ times price9. Thus, the support obtained through the 10th Five
Year Plan appears to have primarily increased the price that firms in supported
industries charged, rather than their average productivity.
2.4.2 Heterogeneous Effects of the 10th Five Year Plan
In Section 2.3.3, we described how the DID strategy uncovers significant effects of the
10th Five Year Plan on misallocation. In Section 2.4.1, we showed that the 10th Five
Year Plan also leads to an increase in the mean of TFPR. Supported industries became
more profitable on average but misallocation increased. However, the standard linear
DID model recovers only the average treatment effect. Yet, the support provided by
these industrial policies could be heterogeneous and depend on the pre-treatment
covariates. In this section, we use the methodology developed by Athey and Imbens
(2006) to estimate the quantile treatment effect for the supported firms in the
difference-in-difference setting and to check whether there exists evidence of heterogeneous
effects. For this approach, we use the firm-level data, rather than aggregating
observations into industries.
We first use the original changes-in-changes (CIC) method proposed by Athey and
Imbens (2006) to construct the counterfactual TFPR distribution that firms in the
supported industries would have exhibited in the absence of the support provided by
the 10th Five Year Plan and compare it with the observed TFPR distribution. We do this
by estimating a CIC regression without including the covariates (see Figure 2.2, Panel
A). Then we follow Garlick's (2018) methodology and redo the computation controlling
for the same covariates as in Section 2.3.3 (see Figure 2.2, Panel B).
The horizontal distance between the observed and the counterfactual TFPR distribution
at each quantile represents the quantile treatment effect of the 10th Five Year Plan on
9
firms in the supported industries. This distance, without and with adjustment for
covariates, is plotted in Figure 2.3 along with the 95% confidence intervals constructed
using a percentile bootstrap. Regardless of the adjustment, the point estimates are small
and statistically insignificant for the lowest percentile. Yet, for the rest of the
distribution the point estimates are positive and significant, albeit small (≤0.1 standard
deviations). The largest point estimates are observed for TFPR percentiles that slightly
exceed the median and for the extreme right tail. These results suggest that China's
industrial policies lead to higher TFPR and increased misallocation because they raised
revenue productivity for the highly productive firms while having no significant impact
on the least productive firms.
We also compute the counterfactual TFPQ distribution for the supported firms (Figure
2.4) and estimate the quantile treatment effect on TFPQ (Figure 2.5). The point
estimates are negative and significant, yet small (≤0.1 standard deviations) for the
bottom quintile; positive and significant for the top quintile and insignificant for the
rest of the distribution. The largest increase is observed at the extreme right tail where
the point estimates exceed 0.1 standard deviations. These results reinforce our
conclusion that, on average, industrial policies in China increased the price charged by
supported firms but did not affect physical productivity for most of those firms.
Nevertheless, significant heterogeneity in the effect on TFPQ is revealed in the graphs.
The insignificant average effect of the support on TFPQ found with the
difference-in-difference model masks a negative effect for the physical productivity of the least
productive firms and a positive effect for more productive firms.
These results point towards three important distributional effects of the Chinese
government policies. First, the 10th Five Year Plan appears to have driven a larger wedge
between the marginal products of capital and labor for the supported firms over most
of the TFPR distribution and especially for the most productive firms. Second, the fact
that these policies resulted in higher (lower) physical productivity for the supported
firms in the top (bottom) quintile suggest resources were reshuffled away from
high-productivity firms and toward less productive firms. Finally, for most of the supported
remained unchanged. In brief, given that TFPR=P*TFPQ, our results suggest supported
firms in all but the top quintile faced greater barriers to reallocation as a result of the
10th Five Year Plan.
It is important to note here that whereas the nonlinear DID model provides more
information than the DID model, it requires stronger identification assumptions. More
specifically, the quantile treatment effects are identified under the assumption that the
distribution of the unobserved firm-level TFPR (TFPQ) determinants for supported or
not supported firms does not change over time. Both the policy of "grasp the large and
let go of the small" as well as the increased participation of China in world trade would
suggest the distribution of the covariates might have changed over time. However, the
fact that the quantile estimates are quantitatively very similar with and without
controlling for covariates suggests that this is not a great concern.
Finally, Table 2.4 reports summary statistics for the observed and counterfactual TFPR
and TFPQ distributions. In other words, the reports measures of TFPR (TFPQ)
dispersion for the observed distribution of supported firms and the counterfactual TFPR
(TFPQ) for the same firms in the absence of the support. On the one hand, the mean
and variance of TFPR are somewhat higher for the observed than the counterfactual
distribution, regardless of the adjustment. The support provided by the 10th Five Year
Plan increased the mean of TFPR by about 2% and the variance by approximately 1%
for the supported firms. This is a result of the positive but small effect of the support on
most quantiles of the TFPR distribution. On the other hand, the mean of TFPQ is
essentially identical under the observed and under the counterfactual distribution,
whereas the variance is approximately 6% higher. The support doled out by the 10th
Five Year Plan thus appears to have left the mean of TFPQ unchanged while increasing
the dispersion of TFPQ for the supported firms. This increase in dispersion is reflective
of the negative effect of the support on the lower quintile and the positive effect on the
upper quintile. Our results suggest industrial policies implemented by the Chinese
government resulted not only in increased misallocation but in greater dispersion on the
2.4.3 Mechanism: Taxes, Subsidies or Access to Credit?
Three of the most common ways the Chinese government supports firms are tax breaks,
direct subsidies, and access to credit. Each of these, when handed out to only a subset
of firms, can distort the allocation of resources. The official documentation on the 10th
Five Year Plan does not contain information regarding the mechanism used to support
firms. So, we first turn to the data to inquire about the mechanisms used by the Chinese
government to provide support and then investigate whether these mechanisms had a
heterogeneous impact for firms with different initial levels of revenue productivity. In
other words, could a differential treatment via taxes, subsidies or access to credit
explain the heterogeneous impact of the plan on the distribution of TFPR and TFPQ?
2.4.3.1Descriptive Evidence of the Support Mechanisms
Table 2.1 reports the share of firms that paid taxes and the average tax to value-added
ratio broken down by supported and not supported industries in 2000, the year prior to
the 10th Five Year Plan. Similarly, the also reports the share of firms in an industry that
received subsidies, the average subsidy to value-added ratio, the percentage of firms
that paid/received interest and the average interest to debt ratio split down by supported
and not supported industries in 2000.
In 2000, the percentage of firms that paid taxes was almost identical among supported
(78.41%) and not supported (77.73%) industries. The average tax to value added ratio
observed among supported industries was lower (0.032) than the rate for firms in the
not supported industries (0.048). In addition, while the percentage of firms that received
subsidies was slightly higher among supported industries (12.02% instead of 11.02%),
the average subsidy to value added ratio for the supported firms (0.0210) was almost
identical to that of the not supported industries (0.0212). Differences in the ratio of
interest payments to debt among supported (0.0383) and not supported (0.0397)
industries in 2000 also appears to be minimal. However, in 2000, firms in the supported
industries were more likely to pay/receive interest (87.5%) than firms in the not
among the former and 70.6% among the latter, these numbers suggest supported firms
were somewhat more likely to receive interest payments.
2.4.3.2A First Look into the Effects of the 10th Five Year Plan on Taxes, Subsidies and
Credit Conditions
To inquire into the possible mechanisms used to support firms by the 10th Five Year
Plan, we follow a two pronged approach. First, we use a Probit difference-in-difference
model to estimate the effect of the plan on the probability that a firm pays taxes:
Pr(Yist = =1) φ α δ[ + Post2000ist +ηSupportedist +β(Post2000×Supported)ist +εist] (2.6)
where Yist =1 if firm i in industry s paid taxes at time t. We use a similar regression to
estimate the impact of the plan on the probability that a firm receives subsidies and an
ordered Probit regression to model the probability of receiving or paying interest.
Second, we inquire into the effect of these industrial policies on the expected ratio of
the latent taxes (subsidies) to value added, which we interpret as a proxy for the impact
on the average tax (subsidy) rate faced by the supported firms. We employ a Tobit model,
with the same control variables as before, to tackle this question.
Column (1) of Table 2.5 reports the estimation results for the probability of paying taxes,
whereas Column (2) reports the estimation results for the Tobit. Before discussing the
results, note that while the coefficient on the interaction term in the Probit/Tobit model
does not equal the treatment effect, the sign of the treatment in a Probit or Tobit model
does equal the sign of the interaction term (see Puhani, 2012). Thus, the positive
coefficient on the interaction term Post2000×Supported suggests that the probability of
paying taxes and the tax rate increased for the supported firms during the 10th Five Year
Plan. At a first glance, on average, tax breaks do not appear to have been used to provide
support to firms in the targeted industries.
Estimation results reported in Columns (3) and (4) of Table 2.5 suggest support was
doled out in the form of subsidies. First, the 10th Five Year Plan increased the probability
of receiving subsidies as well as the expected ratio of subsidies to value added. The