1
Iranian Journal of Energy & Environment
Journal Homepage: www.ijee.net
IJEE an official peer review journal of Babol Noshirvani University of Technology, ISSN:2079-2115
Sequestration of Copper (II) and Iron (II) Ions from Electroplating Effluent Using Crab
Shells Chitosan Stabilized Silver Nanocomposite
1 Department of Chemistry, Federal University of Technology Minna, Niger State
2 Department of Chemical Engineering, Federal University of Technology Minna, Niger State
P A P E R I N F O
Paper history: Received 05 Febrary 2019
Accepted in revised form 10 March 2019
Keywords:
Adsorption
Nanocomposite
A B S T R A C T
This work presents the green preparation of chitosan stabilized silver nanocomposite using aqueous leaf extracts of Nicotiana tobaccum. The prepared chitosan – silver nanocomposite was characterized by the ultraviolet-visible (UV-Vis) spectroscopy, X-ray diffraction (XRD), high resolution scanning electron microscopy (HRSEM) and Fourier transform infrared (FTIR) spectroscopy. The nanocomposite was employed to remove copper and iron metal ions from electroplating effluent via batch adsorptions as a function of contact time, adsorbent dosage and temperature. The XRD results of the nanocomposite showed reflections at 2θ of 38.04°, 44.650 and 64.45° for the presence of silver nanoparticles and 9.29° and 19.300 for chitosan. The HRSEM image of the nanocomposite shows the silver nanoparticles embedded in the chitosan polymer matrix, to create pores on the surface of the chitosan. The maximum percentage removal of copper and iron by chitosan – silver nanocomposite were 94.76 and 98.8%, respectively at temperature of 363 K in 60 minutes using adsorbent dosage of 25 mg. The results were well fitted by all the tested isotherm models but the best fit into jovanovic isotherm models. Kinetic data for Cu and Fe ions followed Elovich model which implies multilayer adsorption. The result of this study showed that chitosan - silver nanocomposite has been prepared and it exhibit high adsorption efficiency for copper and iron from electroplating effluent.
doi: 10.5829/ijee.2019.10.01.01
INTRODUCTION1
The contamination of environment due to the presence of heavy metals is one of the foremost issues threaten the effort to sustain environment. This called for urgent attentions because of their hazardous threat to human life [1]. Heavy metals build up in living tissues through the food chain which has human at its top [2, 3]. The presence of these toxic metals in human body can cause series of health disorderliness like liver damage, kidney failure, cancer, and brain damage when found above the permissible levels [3]. For this reason, it is very imperative that these metal ions be removed from industrial effluent before being discharged into the water bodies.
A number of conventional techniques are available for the removal of heavy metals from industrial effluent. These techniques include precipitation, membrane separation, chemical coagulation, ion-exchange and electrodialysis. Nevertheless, these methods often involve high cost of operation [5].
Adsorption using biomaterials as a wastewater treatment technique for heavy metals removal from industrial effluent is an efficient technology in field of environmental
*Corresponding author: Sumaila Abdulmum, E-mail: [email protected]
sustainability [6]. Numerous studies have shown the feasibility of using biomaterials to remove heavy metal ions from industrial effluent. The main advantages of biomaterials as adsorbents are their effectiveness, inexpensive, biodegradability and large scale applications [7].
Chitosan, a biodegradable polymer and component of sea shells is a nitrogenous polysaccharide which can be obtained from crab shells usually generated in large amount as shell waste globally [8]. These shells even though are biodegradable, their dumping in large quantities slow down the breakdown process resulting in build up of waste after a while which is also a major environmental concern [9]. Thus, the shell wastes can be treated to prepare chitosan which in turn can be employed to develop nanocomposite with silver nanoparticles via environmentally friendly method for the removal of heavy metals from electroplating effluent
This study was therefore carried out to determine the effectiveness of the chitosan – silver nanocomposite to remove copper and iron from electroplating effluent and to examine the mechanisms of adsorption onto chitosan – silver nanocomposite by batch experimental process. The present work was aimed to study the effects of contact time, adsorbent dosage and temperature for the removal of copper and iron A. Sumaila1*, M. M. Ndamitso1, A. S. Ambali2, Y. A. Iyaka1, J. O. Tijani1
ions from electroplating effluent using the chitosan – silver nanocomposite.
MATERIALS AND METHODS Materials
Leaves of Nicotiana tabacum wereobtained from a vegetable farm in Tunga Awaje area of Paiko, Niger State Nigeria. Chitosan was extracted from crab shells via the methods reported by Hajji et al., [1]. Silver nitrate (AgNO3) and glacial acetic acid with high purity of 99% were obtained from Sigma Aldrich Chemicals Limited (USA). All chemicals and reagents used in this work were of analytical grade and used as received without further purification. Electroplating effluent was obtained from waste treatment section of Science Equipment and Development Institute (SEDI), Minna, Nigeria.
Method
Preparation of aqueous leaf extract The fresh leaves
of Nicotiana tabacum were washed with distilled water, sun
dried and later ground to fine powder. To 10 g of the leaves, 100 ml distilled water, was added and boiled at 80° C in water bath for 15 minutes. This was allowed to cool and subsequently filtered through Whatmann no.1 filter paper and stored at room temperature for further use.
Preparation of chitosan - silver nanocomposite For the preparation of chitosan – silver stabilized nanocomposite, 40 ml of 1.0 wt% chitosan solution and the 40 ml of 1M AgNO3 solution were mixed in the 100 ml conical flasks. To this mixture, 5 ml of aqueous leaf extract from Nicotiana
tabacum was then added. The mixture was stirred on a
magnetic stirrer at 250 rpm for 2 hours and subsequently allowed to age for 24 hours. The changes in colour from colourless to pale brown then to dark brown, signifies the formation of nanosilver. The reduction of silver nitrate into nanosilver was observed with UV-visible spectrophotometer. The obtained chitosan – silver nanocomposite was freeze dried at - 420C and then further characterized.
Characterization of prepared chitosan – silver
nanocomposite The UV-visible spectral measurement was done using Shidmadzu UV-visible spectrophotometer from 300 to 700 nm. The structures of the prepared nanocomposite produced were studied using XRD - 6000 Shimadzu Scientific Instruments. The surface morphologies of the composite produced was observed using MEL-30000 SCOTECH (Germany). The Fourier Transform infrared (FTIR) spectra were recorded with a Frontier FT-IR Perkin Elmer (UK) over the range of 400 - 4000 cm−1.
Batch adsorption studies Batch adsorption studies were carried out using 50 mlof the digested electroplating effluent and stirring speed of 200 rpm. The contact time, adsorbent dose and temperature were assessed in the course of study. Samples were collected from the flasks at predetermined time intervals for analyzing the residual Cu and Fe amounts in the filtrate. The adsorbent was removed by filtration through Whatmann filter paper no. 4. The residual
concentration of Cu and Fe ions in the filtrate were determined by atomic absorption spectroscopy (AAS).
The amount of Cu and Fe ions adsorbed were determined by using the following mass balance equation:
qe =(Co−Ce)V
m (1)
where Co and Ce are the amounts (mg/l) of Cu and Fe ions before and after adsorption, respectively, V is the volume of effluent in mland m is the weight of the adsorbent in grams. The percentage of removal of Cu and Fe ions were calculated from the following equation:
Removal (%) =Co−Ce
Co x 100 (2)
RESULTS AND DISCUSSIONS
UV–visible spectroscopy analysis of chitosan – silver nanocomposite
The formation of the nanosilver by reduction of AgNO3 in the acetic acid solution of chitosan in the presence of aqueous leaf extract of Nicotiana tabacum ion was monitored by UV– visible spectroscopy. During the reduction process, colourless solution of chitosan containing AgNO3 gradually changed to brown, which signifies the conversion of Ag+ into Ag0 [2-10]. The presence of nanosilver in the composite was confirmed by UV–visible spectrum (Figure 1) with a maximum absorption band at 426.5 nm, which corresponds to the typical plasmon resonance band of nanosilver [11].
FTIR of chitosan - silver nanocomposite
FTIR analysis was carried out to identify the functional groups developed for the interaction between the chitosan polymer matrix and the nanosilver. The FTIR spectra for the chitosan stabilized silver nanocomposite are shown in Figure 2. As shown in Figure 2, a characteristics absorption band was observed at 1621.63 cm−1 which was assigned as C - N stretch while N - H was at observed at 3265.02 cm-1. The C–H bond interaction due to Amide II band was at 1463.86 cm−1 and the C–O skeletal stretch characteristic of polysaccharides was observed at 1102.24 cm−1. The bands at 1739.95cm-1 and 2870.61 cm-1 were assigned to the carbonyl stretch and alkane C-H-stretching, respectively [12]. The single peak at 3265.02 cm−1 corresponds to N – H is in agreement with the previous studies result reported [13].
XRD study of the prepared chitosan – silver nanocomposite
The phase structure of the prepared chitosan – silver nanocomposite was investigated using XRD technique.
Figure 1. UV–visible spectra of chitosan-silver
Figure 3 shows the diffractogram of the prepared nanocomposite. The presence of chitosan and nanosilver were apparent from the diffractogram, while other peaks may be attributed to the impurity phases due to biomolecules of the leaf extract [14].
The diffraction peaks observed at 2θ values of 9.29° and 19.300 with crystal plane (020) and (110) correspond to a diffractogram of a typical chitosan, while the diffractogram at 2θ of 38.04°, 44.650 and 64.45° indexed (111), (200) and (220) miller indices are assigned to silver nanoparticles [15]. The particle size of silver nanoparticles in the prepared nanocomposite determined using Scherrer formula was 8.86 nm.
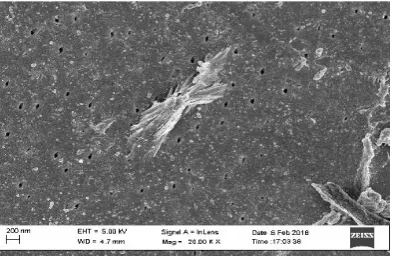
High resolution scanning electron microscope (HRSEM) of chitosan silver nanocomposite
Surface morphology of prepared chitosan stabilized silver nanocomposite was analyzed using the HRSEM technique. The HRSEM image of the nanocomposite in Figure 4 showed distribution of silver nanoparticles on the chitosan surface and embedment of some of the nanoparticles into chitosan to create pores.
Batch adsorption of heavy metals in electroplating effluent
Batch adsorption studies of the percentage removal of Cu and Fe from electroplating effluent were performed by changing the contact time, adsorbent dosage and temperature. The results obtained with respect to each parameter are presented as follows.
Effect of contact time on adsorption
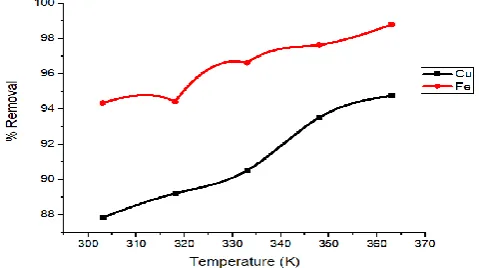
Figure 5 shows the effect of contact time on the percentage removal of Cu and Fe respectively from electroplating effluent using chitosan – silver nanocomposite (volume = 50 ml, adsorbent dosage = 25 mg, temperature = 300C, stirring speed = 200 rpm).
Keeping temperature, adsorbent dosage and stirring speed constant, the percentage removal of Cu ions on chitosan – silver nanocomposite depends on contact time. The effect of contact time on percentage removal of Cu ions at optimum adsorbent is shown in Figure 5. Figure 5 shows that Cu ions removal increases with increasing contact time at all the temperatures and approximately 71.75 % of Cu ions on chitosan – silver nanocomposite were attained within 30 minutes and the maximum percentage removals were attained in about 75 minutes. The early rapid rate of percentage removal of the metal ions may be due to the large availability of the charged surface of the adsorbents for Cu ions present in the effluent, while later slow removal rate may be as a result of electrostatic interference caused by the adsorbed metal ions and the slow pore diffusion of the ions [16].
The relationship between the percentage removals of Fe ions with contact time, as shown in Figure 5, indicates that the chitosan – silver nanocomposite - metal ion solution system have high rapid uptake of Fe ions from the effluent. The adsorptions were done using 25 mg of chitosan – silver nanocomposite. The percentage removal of Fe ions increased with contact time until equilibrium was established. It is thus obvious from Figure 5 that at short contact time the
Figure 2. FTIR of the Synthesized Chitosan – Silver Nanocomposite
Figure 3. XRD pattern of chitosan–silver nanocomposite
Figure 4. HRSEM image of chitosan stabilized silver
nanocomposite
Figure 5. Effect of Contact Time on Cu and Fe Removal
The effect of adsorbent dosage
The dosage of adsorbent has a significant consequence on the adsorption process and it describes the capacity of the adsorbent through the number of active binding sites accessible to remove heavy metal ions.
Figure 6 shows the effect of adsorbent dosage on the adsorption of Cu ions using chitosan – silver nanocomposite. In this case percentage removal of Cu ions increased with adsorbent dose in the range from 5 – 25mg and showed some variation. This trend may be as a result of saturation of active sites at higher adsorbent dosage. This shows that percentage removal is determine by the number of accessible active sites [18]. Figure 6 shows that the percentage removal increased from 69.42 to 74.92 % on chitosan – silver nanocomposite with increase in the adsorbents dosages from 5 – 25mg. This outcome conforms with the reported data in literature [19] on the adsorption of Pb (II), Cu (II), and Zn (II) Ions onto Urtica
dioica leaves as a low cost adsorbent.
The result for the Fe ions uptake using various dosages of chitosan – silver nanocomposite (5 – 25mg/50ml) is shown in Figure 6. The percentage of Fe ions removal was found to increase with increase in the dosages of the adsorbents. The increase in Fe ions uptake value may be to the absence of splitting effect of the concentration gradient between the Fe ions and adsorbents [20].
Effect of temperature on adsorption
The effect of temperature on the removal of Cu and Fe, by chitosan – silver nanocomposite was studied. The temperature of the electroplating effluent was varied in the range of 300 – 363 K while other parameters (adsorbent dosage and contact time) were kept constant at 25 mg and 60 minutes respectively at stirring speed 200 rpm. The results of effects of temperature with respect to the percentage removal of each metal are as shown in Figure 7.
The effect of temperature on the adsorption of Cu ions on chitosan –silver nanocomposite from the electroplating effluent was also examined. Figure 7 shows the plot of
Figure 6. Effect of Adsorbent Dosage on Cu and Fe Removal
Figure 7. Effect of Temperature on Cu and Fe Removal
percentage removal of Cu ions against temperature. The percentage removal of Cu ions by chitosan – silver nanocomposite increased from to 87.84 – 94.76 % respectively as temperature rise from 303 to 363 K for the equilibrium time of 60 minutes. These outcomes correspond to the findings reported in literature [21] on adsorption of copper (II) from aqueous solutions by activated carbon prepared from grape bagass.
Figure 7 demonstrates the effect of temperature changes on the percentage removal of iron, it can be noticed that there was continuous increases in the percentage removal of iron by chitosan – silver nanocomposite to temperature of 363 K with percentage removal of 98.80 %. This may be attributed to large surface area of chitosan – silver nanocomposite due to the presence of silver ions.
Generally, the temperature of the electroplating effluent plays a critical role on the adsorption of metal ions, which was seen to increase with the increase of temperature. The initial rates of Cu and Fe ions adsorption by chitosan – silver nanocomposite were fast which later became slow. This trend indicates that the adsorption of the metal ions onto chitosan – silver nanocomposite was not significantly influence by the increased temperature. This is consistent with the result reported in literature [22] on heavy metal adsorption onto
Kappaphycus sp. from aqueous solutions. It can be concluded
that, with increase in temperature, the activation of the adsorbent surfaces is improved easing more active sites for adsorption of the metal ions. In addition, an ease diffusion of the metal ions from the effluent to the active sites of the adsorbent (chitosan – silver nanocomposite) may also be responsible for the initial higher adsorption of metal ions [23].
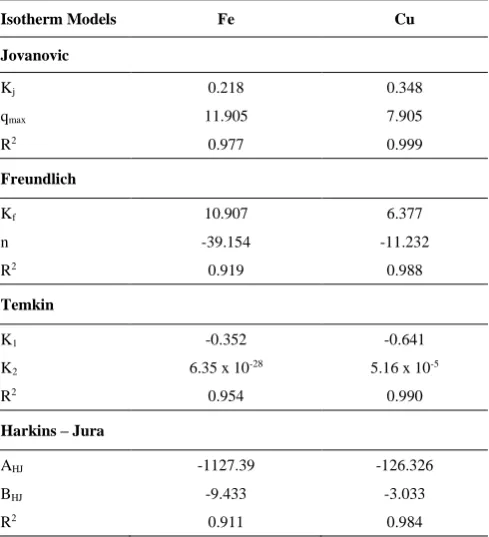
Adsorption isotherm models
Jura and Temkin isotherm models. At constant temperature the amount of the metal ions varied to obtain the equilibrium data. The obtained data was used to plot isotherms in their liner form to calculate the model constants and correlation coefficients (R2). The applicability of the isotherm model to explain the adsorption process was criticised by the correlation coefficients (R2) values.
For the Freundlich isotherm, the plot of Inqe versus InCe gives a straight line with slope of 1/n and intercept of InKF. For Jovanovic isotherm, when Inqe is plotted against Ce, a straight line with slope of - Kj and intercept of Inqmax is obtained. A plot of 1/qe2 versus LogCe for Harkin – Jura isotherm yields a linear line with slope of -1/AHJ and intercept of BHJ/AHJ. For Temkin isotherm, a plot of qe versus InCe enables the constants K1 and K2 to be determined.
Freundlich isotherm models for the removal of cu and fe ions from electroplating effluent
From Table 1, the order of increasing in values of Freundlich constant (Kf) as adsorption capacities of Chitosan – Silver nanocomposite for the metal ions is Fe>Cu. The lower adsorption capacity of chitosan – silver nanocomposite for Cu ions may be attributed to the lower concentrations of these ions in the effluent. Meanwhile, the presence of Ag ions in the chitosan polymer matrix might have reduced the number available functional groups as active sites for metal ions adsorption; this could responsible for the lower adsorption capacity of the chitosan – silver nanocomposite. The values of Kf obtained in this study for chitosan – silver nanocomposite were compared with some low – cost adsorbents reported in the other studies (Table 2).
TABLE 1. Isotherm Models Parameters for the Adsorption of
Cu and Fe ions from Electroplating Effluent using Chitosan- Silver Nanocomposite
Isotherm Models Fe Cu
Jovanovic
Kj 0.218 0.348
qmax 11.905 7.905
R2 0.977 0.999
Freundlich
Kf 10.907 6.377
n -39.154 -11.232
R2 0.919 0.988
Temkin
K1 -0.352 -0.641
K2 6.35 x 10⁻²⁸ 5.16 x 10⁻⁵
R2 0.954 0.990
Harkins – Jura
AHJ -1127.39 -126.326
BHJ -9.433 -3.033
R2 0.911 0.984
TABLE 2. A comparison of the Kf of chitosan – silver nanocomposite with those of low – cost adsorbents reported in the literatures
Metal ion Adsorbent Kf (mg/g) Reference
Cu Microfibrillated cellulose 3.150 [26]
Collagen/cellulose hydrogel beads 1.06 [27]
Locally Developed Chitosan 1.45 [28]
Chitosan – silver nanocomposite 6.009 This study
Fe Chitosan 4.522 [29]
Modified Orange Peels 0.838 [30]
Glutaraldehyde Crosslinked
Chitosan–coated Cristobalite 0.159 [31]
Chitosan – silver nanocomposite 10.91 This study
Freundlich isotherm (1/n) which stands for the adsorption efficiency is a parameter related to the surface heterogeneity and the energies linked in the adsorption process, it also indicates a favourable adsorption of the adsorbate on the given adsorbent [32]. The values of 1/n for the adsorption of Cu and Fe ions on chitosan – silver nanocomposite by Freundlich adsorption isotherm are shown in Table 2. According to literature [33] for an adsorption, 1/n =0 indicate an irreversible adsorption, 0<1/n<1 shows a favourable adsorption and 1/n >1 indicates an unfavourable isotherm. This implies that the adsorption of Cu and Fe ions on chitosan – silver nanocomposite in this study is favourable and beneficial. Also, the smaller the value of 1/n the better adsorption mechanism and formation of relatively stronger bond between the metal ions and chitosan – silver nanocomposite [34]. The values of 1/n < 1 show that there is significant adsorption at low concentration of the metal ions. The correlation coefficients (R2) for Freundlich adsorption isotherms for copper and iron removal from electroplating effluent by chitosan – silver nanocomposite is presented in Table 1. For adsorption of Cu and Fe ions on chitosan – silver nanocomposite the correlation coefficients are 0.988 and 0.919, respectively. This indicates that the experimental data for the adsorption of the metal ions fitted well to Freundlich isotherm model. By comparing the correlation coefficients, it was observed that Freundlich isotherm gives a better model for the adsorption of Cu ions than Fe ions on chitosan – silver nanocomposite, which is based on heterogeneous surface adsorption of exponential distribution of active sites and their energies. Due to this, it may be concluded that the adsorptive surfaces of chitosan – silver nanocomposite are made up of minute heterogeneous adsorption active sites that are homogeneous themselves. Thus, application of Freundlich model for the experimental data indicates monolayer coverage on heterogeneous adsorbent surface by both metal ions.
Harkin – jura isotherm model for the removal of cu and fe ions from electroplating effluent
experimental isotherm data in the adsorption of both metal ions onto chitosan – silver nanocomposite. This result also showed that the adsorption of Cu and Fe ions onto chitosan – silver nanocomposite can be explained by multilayer adsorption phenomena.
Jovanovich isotherm model for the removal of cu and fe ions from electroplating effluent
Jovanovich isotherm model predicates monolayer adsorption onto a surface with a limited number of identical sites in addition to likelihood of some mechanical contacts between the adsorbate and adsorbent. At high concentrations of adsorbate, Jovanovich isotherm becomes Langmuir isotherm. The correlation coefficients (R2) values for Jovanovich model were 0.999 and 0.977 for Cu and Fe adsorption on chitosan – silver nanocomposite (Table 1) which very high for the metal ions tested. This result showed the adsorption of the selected metal ions can be better explained by approximation of monolayer localized adsorption with surface binding vibrations of an adsorbed species. Thus, Jovanovic isotherm models could explain the adsorption of the metal ions onto chitosan – silver nanocomposite adequately.
Temkin isotherm model for the removal of cu and fe ions from electroplating effluent
Temkin isotherm model is a kind of isotherm model which takes into account the existence of interactions between adsorbents and adsorbates like metal ions and also assumed that the free energy of adsorption is a function of the surface coverage [35]. From the linear form of the Temkin model (qe = K1lnK2 + K1lnCe), a plot of qe versus lnCe make possible the calculation of constants K2 and K1. The constant K1 is associated to the heat of adsorption in J/mol. If K1 has a negative value that means the adsorption process is exothermic one. Otherwise (if it has a positive value), it is endothermic. Negative K1 values in Table 1 show that the removal of Cu and Fe ions in this study is an exothermic adsorption processes. Order of decrease in K1 by chitosan – silver nanocomposite is Fe>Cu. This implies that Fe ions adsorption by chitosan – silver nanocomposite involves release of greater energy compare to Cu ions.
K2 is the equilibrium binding constant equivalent to the maximum binding affinity, which is the strength of the binding interaction between a single individual molecule and ligands. The larger the K2 value, the more strongly the target species and ligands are attracted to and bind to one another. In this study, the orders of decrease in K2 of chitosan – silver nanocomposite are Cu>Fe. This shows that chitosan – silver nanocomposite have higher binding affinity for Cu ions as compare to Fe ions. This higher binding affinity constant observed for Cu ions imply that chitosan - silver nanocomposite have more stronger interaction and attraction for Cu ions due to their higher electronegativity [36].
From Table 3, regression coefficients (R2) for all four isotherm models show that the best fitted model for the removal of Cu and Fe ions under investigation using chitosan – silver nanocomposite is Jovanovich isotherm model. Other isotherm models Freundlich, Harkin- Jura and Temkin) also were fitted to a convinced extent with high R2 values. Jovanovich isotherm model best explained the adsorption behaviour of these metal ions more than other isotherm
models due its higher R2 values (0.977 and 0.999). Thus, the adsorptions of the metal ions in this study can be said to have took place more on homogenous site with monolayer coverage of metal ions on the outer surfaces of the chitosan – silver nanocomposite along with some mechanical contacts between the metal ions and adsorbent without interaction between adsorbed metal ions.
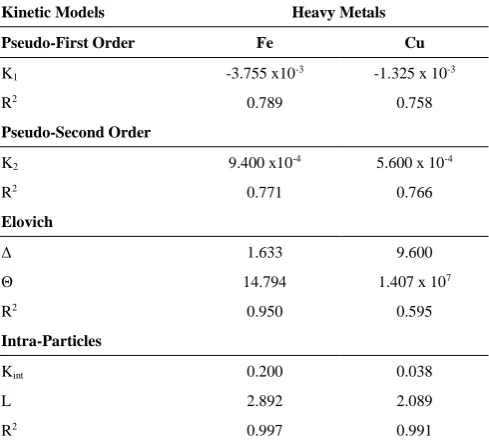
Kinetic model of cu and fe ions adsorption
The rate of adsorption and possible adsorption mechanism of Cu and Fe ions onto chitosan – silver nanocomposite were analyzed by applying adsorption kinetics models to the experimental data. In this, study, adsorption kinetic models were studied by different models to explain the kinetic of adsorption. These include pseudo first order, pseudo second order, Elovich –Types and intra-particles models. The values of the rate constants and other parameters obtained from the slopes and intercepts of the plots are shown in Table 4.
Pseudo-first-order kinetic model
The pseudo-first order equation has been used to portray reactions. Though, it is usually expressed in a range of reaction only. The data for the adsorption of metal ions using chitosan – silver nanocomposite were plotted as in pseudo – first order equation and the parameters obtained are shown in Table 4. From Table 4, it can be observed that pseudo –first order model gave the linear regression coefficients of 0.758 and 0.789 for Cu and Fe metal ions adsorption on
TABLE 3. Regression coefficients of adsorption isotherm models for the heavy metal ions under study
Heavy Metal Freundlich Javonovic Harkins - Jura Temkin
Cu 0.988 0.999 0.984 0.990
Fe 0.919 0.977 0.911 0.954
TABLE 4. Kinetic Parameters for the adsorption of selected heavy metals on Chitosan – Silver Nanocomposite
Kinetic Models Heavy Metals
Pseudo-First Order Fe Cu
K1 -3.755 x10⁻³ -1.325 x 10⁻³
R2 0.789 0.758
Pseudo-Second Order
K2 9.400 x10⁻⁴ 5.600 x 10⁻⁴
R2 0.771 0.766
Elovich
Δ 1.633 9.600
Θ 14.794 1.407 x 10⁷
R2 0.950 0.595
Intra-Particles
Kint 0.200 0.038
L 2.892 2.089
chitosan – silver nanocomposite. This shows that the pseudo – first order model do not fits the adsorption of Cu and Fe on chitosan – silver nanocomposite. These lower values of the R2 further suggest that the kinetics of adsorption of Cu and Fe ions on chitosan – silver nanocomposite could not therefore be described by pseudo – first order model. However, adherence of Cu ions adsorption data to first order kinetics have earlier been reported in the literature [37, 38].
Pseudo-second-order kinetic model
The regression coefficients (0.766 and 0.771) of the linearized pseudo – second order kinetic model as shown in Table 4 were low for the adsorption of Cu and Fe ions on chitosan – silver nanocomposite, respectively. Thus, it can be implied that the kinetic data for the metal ions does not perfectly support the best fit of the pseudo – second order model for the adsorption of the metal ions. Therefore, the adsorption of these metal ions was not only by chemisorption and also, pseudo-second order model is not the only model that influence the rate-determining step in the chitosan – silver nanocomposite [39, 40].
The pseudo-second-order rate constants K2 (g /mg/ min), were found to be appreciable, which supports that the Cu and Fe ions uptake onto the chitosan – silver nanocomposite from electroplating effluent was fast and favourable. Similar observation was reported in literature [23, 41]. This trend shows that the pseudo – second order model is part of the rate-determining step in the adsorption process [40].
Elovich model
The values of the regression coefficients R2 ≥ 0.90 of Elovich kinetic model for the adsorption of Cu and Fe ions on chitosan – silver nanocomposite (Table 4) showed that kinetic data for the mentioned metal ions followed Elovich model. This suggests that part of adsorption of these metal ions was multilayer adsorption. Furthermore, the higher values of Elovich constants, δ (mg g−1 min−1) and θ (g mg−1), as shown in Table 4 are indicative of an increased rate of chemical adsorption. Also, the fitness of the kinetic data on elovich model signifies that the adsorption of these metal ions took on heterogeneous surfaces of chitosan – silver nanocomposite [39].
Intraparticle diffusion kinetic models
The nonlinear regression data of qt were plotted against t1/2 for
the selected heavy metal ions to determine the intraparticle diffusion rate constant and other parameters. The intraparticle diffusion rate constant (kd) as shown in Table 4 was
determined from the slope of the second linear sections of the graph of qt against t1/2 for the metal ions. Actually intraparticle
diffusion plays a major role in the adsorption of Cu metal ions (R 2 ≥ 0.95) and Fe (R2 ≥ 0.90) onto the chitosan – silver nanocomposite, signifying a very good relationship between
qt and t1/2 for the metal ions at the experimental conditions.
Nevertheless, the L values in all the cases > 0 implies that qt
against t1/2 plots did not pass through the origin, indicating that even though the intraparticle diffusion was part of the adsorption process, it did not determined rate-controlling step alone [39, 42] and also that external mass transfer had as well contributed a lots in the metal ions adsorption on chitosan- silver nanocomposite [39].
Thermodynamic of heavy metal ions adsorption
The nature of adsorption process can be obtained from thermodynamic study. The parameters to determine are the changes in Gibbs energy (ΔGº), enthalpy (ΔHº), and entropy (ΔSº). The change in ΔGº indicates the spontaneity of a chemical reaction. Reactions only occur spontaneously if ΔGº at a given temperature is negative.
The Van't Hoff equation can be used to calculate Gibbs free energy change ΔG of the adsorption process [43]:
ΔG°= -RTInK (3)
The relationship between enthalpy change (ΔH) of adsorption, entropy change (ΔS) and Gibbs free energy is presented in the following equations:
ΔG°= -RTInK = ΔH - T ΔS (4)
InK = −ΔH
RT +
ΔS
R (5)
where K is equilibrium constant of Van't Hoff equation. A plot log In K against 1/T is a straight line, ΔH and ΔS can be determined from intercept and slope, respectively. In this study, Table 5 shows the thermodynamic parameters for adsorption of heavy metal ions on chitosan – silver nanocomposite.
Generally, the negative values of ΔH° for the adsorption of the heavy metals by chitosan – silver nanocomposite showed that the adsorption of these metals is exothermic [44]. The randomness during adsorption process can be described using the value of ΔS°. The negative values of ΔS obtained for the heavy metals adsorption using chitosan – silver nanocomposite shown in Table 5 suggest decreased randomness at the solid/solution interface and no significant changes occur in the internal structure of the adsorbent through the adsorption of metal ions onto chitosan – silver nanocomposites [45, 46].
In general, from Table 6, the values of ΔG° for adsorption of both Cu and Fe ions on chitosan – silver nanocomposite at all tested temperatures were positives which indicate that adsorption processes were feasible but not spontaneous in nature. It was noticed that the ΔG° values become more positive with increase in temperature. This indicates that the adsorption process becomes less favourable at high temperatures [47].
TABLE 5. Enthalpy and Entropy Changes for the adsorption
of Cu and Fe ions on Chitosan – Silver Nanocomposite (CHS-Ag)
Heavy Metals
Adsorbent Item Cu Fe
CHS-Ag ΔH -0.290 -0.347
ΔS -26.198 -34.106
TABLE 6. Gibbs free energy for the adsorption of Cu and Fe ions on Chitosan – Silver Nanocomposite (CHS-Ag)
Adsorbent Temperature (K) Cu Fe
CHS - Ag 303 0.4952 0.6766
318 0.8881 1.1882
333 1.2811 1.6998
348 1.6741 2.2113
CONCLUSIONS
Chitosan – silver nanocomposite was successfully prepared by the green synthesis method with the use of green agents (chitosan and leaves of Nicotiana tobaccum) at room temperature. The formation of the nanocomposite was actually confirmed by all instruments employed in this work. The removal of Cu and Fe ions in electroplating effluent by chitosan – silver nanocomposite has been studied. The prepared nanocomposite exhibited efficient removal of Cu and Fe ions from the electroplating effluent.
ACKNOWLEDGMENTS
The authors would like to acknowledge the financial support from TET Fund through Institution Based Research (IBR) of Federal University of Technology, Minna, Nigeria.
REFERENCE
1. Hajji, Sawssen, Islem Younes, Olfa Ghorbel-Bellaaj, Rachid Hajji, Marguerite Rinaudo, Moncef Nasri, and Kemel Jellouli. "Structural differences between chitin and chitosan extracted
from three different marine sources." International Journal of
Biological Macromolecules, 65 (2014): 298-306.
2. Paul, B. T., Clement, G. Y., Anita K. P., Dwayne, J. S (2012). Heavy Metals Toxicity and Environment, National Institute of Health Public Access 101: 133–164.
3. Ezzat, A. K., Algharib, A .M (2013). Removal of Strontium from Industrial Wastewater using Capsules and Leaves of Castor Been and Jojoba Plants. Zagazig Journal of Agricultural Reasearch, 40, 2, 10 -22.
4. Yao –Jen, T., Chen-Feng, Y., Zhonghao, Z., Yanping, D., Jing, F., Di, X. U (2014). Strontium Removal in Seawater by emans of Composite Magnetic Nanoparticles Derived from Industrial Sludge, Water, 8, 357.
5. Ibrahim, U., Akpa, T.C., Daniel, I.H. (2013). Assessment of Radioactivity Concentration in Soil of some |Mining Areas in Central Nasarrawa State, Nigeria, Science World Journal, 8, 2. 1597 – 1623.
6. Akolo, S.A., Kovo, A.S. (2015) Comparative Study of Adsorption of Copper Ion onto Locally Developed and
Commercial Chitosan. Journal of Encapsulation and Adsorption
Sciences, 5, 21-37.
7. GangSeob, J., Zhao, Q., Markus, J. B, (2015). Mechanical Properties and Failure of Biopolymers: Atomistic Reactions to Macroscale Response. Top Current Chemistry, 369: 317–343. 8. Maduka, H.C.C., Ugwu, C.E., Okpogba, A.N., Oguechel, P.N.,
Otokpa, J. A., Okonkwo, C. O (2015). The Efficacy of Chitosan Obtained from Nigerian Snail Shell for the Treatment of Wastewater Effluent, Journal of Biodiversity and Environmental Sciences, 7,4,9 -15.
9. Zhitong Y., Meisheng X., Haiyan, L., Tao, C., Ying, Y., Hao, Z (2014). Bivalve Shell: Not an Abundant Useless Waste but a Functional and Versatile Biomaterial, Critical Reviews in Environmental Science and Technology, 44:2502–2530. 10. Ge, L., Li, Q., Wang, M., Ouyang, J., Li, X., and Xing, M. M
(2014). Nanosilver particles in Medical Applications: Synthesis,
Performance, and Toxicity, International Journal of
Nanomedicine, 9: 2399–2407.
11. Sotiriou, G. A. Sannomiya, T. Teleki, A. Krumeich, F. Vörös, J., Pratsinis, S.E. (2010). Non-toxic dry-coated nanosilver for
Plasmonic Biosensors, Advanced Functional Material, 21, 20, 24, 4250 – 4257.
12. Wang, Y., Pitto-Barry, A., Habtemariam, A., Romero-Canelon, I., Sadler, P. J., Barry, N. P. E. (2016). Nanoparticles of Chitosan Conjugated to Organo-Ruthenium Complexes, Inorganic Chemistry Frontier, 3, 1058 - 1064.
13. Ahmad, M. B., Lim, J. J., Shameli, K., Ibrahim, N. A., Tay, M.Y. (2011). Synthesis of Silver Nanoparticles in Chitosan, Gelatin and Chitosan/Gelatin Bionanocomposites by a Chemical Reducing Agent and Their Characterization, Molecules, 16, 7237 - 7248.
14. Astalakshmi, A., Nima, P., and Ganesan, V. (2013) A green approach in the synthesis of silver nanoparticles using bark of
Eucalyptus globulus, Labill, International Journal
Pharmaceutical Scientic Research, 23, 1, 47 - 52.
15. Shameli, K., Ahmad, M.B. Zargar, M., Yunus, W.M., Ibrahim, N.A., Shabanzadeh, P., Moghaddam, M.G. (2011). Synthesis and Characterization Silver/ Montmorillonite/ Chitosan Bionanocomposites by Chemical Reduction Method and their Antibacterial activity, International Journal Nanomedicine, 6, 271 - 284.
16. Gunatilake S.K., (2015). Methods of Removing Heavy Metals from Industrial Wastewater, Journal of Multidisciplinary Engineering Science Studies, 1, 1, 1 -7.
17. Arivoli, S., Marimuthu, V., Mohamed, A. R. J (2013). Kinetics of Batch Adsorption of Iron (II) ions from Aqueous Solution using Activated carbon from Strychnos Nux-Vomica – L, International Journal of Scientific and Engineering Research, 4, 12, 407 -417.
18. Murthy, C. R., Ramesh, P., Ramesh, A (2011). Study of Biosorption of Cu (II) from Aqueous Solutions by Coconut Shell
Powder. Chemical ScienceJournal, 17: 1 - 15.
19. Priyanka T., Mahesh C. V., Sushil K. J., Harish S., Narendra S. B. (2017). Adsorption of Pb (II), Cu (II), and Zn (II) Ions onto Urtica dioica Leaves (UDL) as a Low Cost Adsorbent: Equilibrium and Thermodynamic Studies, Modern Chemistry, 5 (1).
20. Vijayakumar, A., Tamilarasan, R., Dharmendirakumar, M (2012). Adsorption, Kinetic, Equilibrium and Thermodynamic studies on the removal of basic dye Rhodamine-B from aqueous solution by the use of natural adsorbent perlite, Journal Material Environmental Science 3, 1, 157 - 170.
21. Hakan, D., Cihan, G. (2016). Adsorption of copper (II) from aqueous solutions on activated carbon prepared from grape bagass, Journal of Cleaner Production, 124, 103-113.
22 Md. Sayedur R., Kathiresan, V. S (2015). Heavy Metal
Adsorption onto Kappaphycus sp. From Aqueous Solutions:
The Use of Error Functions for Validation of Isotherm and Kinetics Models. Hindawi Publishing Corporation, BioMed
Research International Volume 2015, 13 pages,
http://dx.doi.org/10.1155/2015/126298.
23. Arshadi, M., M. J. Amiri, and Sajjad Mousavi. "Kinetic, equilibrium and thermodynamic investigations of Ni (II), Cd (II),
Cu (II) and Co (II) adsorption on barley straw ash." Water
Resources and Industry, 6 (2014): 1-17.
24. Foo, K. Y., Hameed, B. H. (2010). Insights into the modeling of adsorption isotherm systems, Chemical Engineering Journal. 156 (1): 2–10
25. Tan, I.A.W. and Hameed, B. H. (2010). Adsorption Isotherms, Kinetics, Thermodynamics and Desorption Studies of Basic Dye on Activated Carbon Derived from Oil Palm Empty Fruit Bunch, Journal of Applied Sciences, 10, 21, 2565 – 2571.
nanostructured microfibrillated cellulose. Cellulose, 21 (3):1471-1487.
27. Wang J, Wei L, Ma Y, Li K, Li M, Yu Y, Wang L, QiuH (2013). Collagen/cellulose hydrogel beads reconstituted from ionic liquid solution for Cu (II) adsorption. Carbohydrate Polymer, 98 (1):736 - 43.
29. Radnia, Hamideh, Ali Asghar Ghoreyshi, and Habibollah Younesi. "Isotherm and kinetics of Fe (II) adsorption onto
chitosan in a batch process." Iranica Journal of Energy and
Environment 2, no. 3 (2011): 250-257.
30. Adebayo, G. B., Mohammed, A. A., Sokoya, S. O (2016). Biosorption of Fe (II) and Cd (II) ions from aqueous solution using a low cost Adsorbent from Orange Peels, Journal of Applied Science and Environmental Management, 20 (3): 702-714.
31. Rahmi, F. I., Arie Purnaratrie (2015). Comparative Adsorption of Fe (III) and Cd(II) ions on Glutaraldehyde Cross-linked Chitosan–coated Cristobalite. Oriental Journal of Chemistry, 31 (4); 2071 – 2076.
32. Kose, T. D., Gharde, B. D., Gholse, S. B. (2012) Studies on Albizia procera legumes for effective removal of Fe (II) and Mn (II) from aqueous solution. Journal of Chemical and Pharmaceutical Research, 4 (4): 2021-2028
33. Areco, M. M., Afonso, M. S. (2010), Copper, zinc, cadmium and lead biosorption by Gymnogongrus torulosus: thermodynamics
and kinetics studies, Biointerfaces, 81, 620–628.
34. Al-Sultani, K.F., Al-Seroury, F.A (2012). Characterization the Removal of Phenol from Aqueous Solution in Fluidized Bed Column by Rice Husk Adsorbent. Revised Journal of Recent Science, 1:145-151.
35. Das, B., Mondal, N. K., Bhaumik, R., Roy, P. (2014). Insight into adsorption equilibrium, kinetics and thermodynamics of lead onto alluvial soil. International Journal Environmental Science Technology, 11, 1101–1114.
36. Weiner, E. R. (2012). Applications of Environmental Aquatic Chemistry: A Practical Guide; CRC Press: Boca Raton, FL, USA, 2012.
37. Gupta, V.K., Agarwal, S., Saleh, T. A. (2011). Synthesis and characterization of alumina-coated carbon nanotubes and their application for lead removal. Journal of Hazard Material, 185, 17– 23.
38. Enos W. W., Stephen, A., Paul, M. S., John W. (2018). Removal of Heavy-Metals from Wastewater using a Hydrous Alumino-Silicate Mineral From Kenya, Bulletin of Chemical Society of Ethiopia, 32(1), 39-51.
39. Rathod M., Mody K., Basha S. (2014). Efficient removal of
phosphate from aqueous solutions by red seaweed, Kappaphycus
alverezii,Journal of Cleaner Production, 84 (1): 484–493.
40. Plaza Cazón J, Viera M, Donati E, Guibal E (2013). Zinc and cadmium removal by biosorption on Undaria pinnatifida in batch
and continuous processes, Journal of Environmental
Management, 15 (129): 423-434.
41. Meitei M. D., Prasad M. N. V. (2014). Adsorption of Cu (II), Mn
(II) and Zn (II) by Spirodela polyrhiza (L.) Schleiden:
equilibrium, kinetic and thermodynamic studies. Ecological
Engineering, 71: 308–317.
42. Maksin D. D., Kljajević S. O., Dolić M. B., (2012). Kinetic modelling of heavy metal sorption by vinyl pyridine based
copolymer. Hemijska Industrija, 66 (6):795–804.
43. Somasundaram, S., Sekar, K., Gupta, V. K., & Ganesan, S. (2013). Synthesis and characterization of mesoporous activated carbon from rice husk for adsorption of glycine from alcohol-aqueous mixture. Journal of Molecular Liquids, 177, 416-425. 44. Surchi, K.M.S., (2011). Agricultural Wastes as Low Cost
Adsorbents for Pb Removal: Kinetics, Equilibrium and Thermodynamics, International Journal of Chemistry, 3(3): 103-112
45. Radnia, Hamideh, Ali Asghar Ghoreyshi, Habibollah Younesi, and Ghasem D. Najafpour. "Adsorption of Fe (II) ions from aqueous phase by chitosan adsorbent: equilibrium, kinetic, and
thermodynamic studies." Desalination and Water Treatment 50,
no. 1-3 (2012): 348-359.
46. Sharma, Deepali, Suvardhan Kanchi, and Krishna Bisetty.
"Biogenic synthesis of nanoparticles: A review." Arabian
Journal of Chemistry (2015).