Available Online at www.ijpret.com
1138
INTERNATIONAL JOURNAL OF PURE AND
APPLIED RESEARCH IN ENGINEERING AND
TECHNOLOGY
A PATH FOR HORIZING YOUR INNOVATIVE WORK
AN OVERVIEW OF DIFFERENT ANALYSIS ALGORITHM AND DATABASE FOR EARLY
DETECTION OF DIABETIC RETINOPATHY
PROF. S. V. PATTALWAR1, MR. L. S KALKONDE2
Department of Electronics and Telecommunication Engineering, Prof Ram Meghe Institute of Technology & Research, Badnera.
Accepted Date: 27/02/2014 ; Published Date: 01/05/2014
\
Abstract: Diabetic Retinopathy (DR) is one of the major problems of diabetic patients. Typically there are no salient symptoms in early stage of diabetics until it is too late for effective treatment. It entail screening assessment of the retina with attention to a series of indicative features, i.e., blood vessels, optic disk and macula etc. Automatic screening test facilitate early detection of diabetic retinopathy through implementation of different analysis algorithm also these experimental test depends upon well formatted database. In this paper we have focused on different database that will help researchers to contribute in this context. Ophthalmologists can detect DR early since we are providing processed image. Keywords: Diabetic Retinopathy; Retina; Blood Vessels; Algorithm; Database.
Corresponding Author: PROF. S. V. PATTALWAR
Access Online On:
www.ijpret.com
How to Cite This Article:
Available Online at www.ijpret.com
1139 INTRODUCTION
Early detection and diagnosis of retinal fundus images for diabetic patients are necessary steps for the Diabetic Retinopathy treatment to prevent vision loss in diabetic patients. Here we are focusing on different analysis algorithms & database available for research.
According to survey done for global prevalence of diabetes some numerical data is to be highlighted here so that we can understand about impact level for early detection of DR. Diabetics was the fourth most frequently managed chronic disease in general practice during year 2009, and the projections go as high as the second most frequent disease by the year 2030 [2].The global burden of diabetic patients is expected to rise from 171 million in 2000 to 366 million in 2030 [2]. In europe more than 52.8 million people are diagnosed with diabetes with the number expected to rise to 64 million by 2030.
Automatic screening is important as up to one third of people with diabetes may have progressive DR changes without symptoms will lid to vision loss [3], thus allowing the disease to progress and making treatment difficult. Systematic screening programs for diabetic eye disease have been developed in many countries.
To build a proper database for detection of DR, capture of retinal image by fundus camera has got massive importance with accurate and robust image processing and analysis algorithms for detection of abnormalities due to DR.
The main contribution of this work is to present an overview of algorithms for early detection of diabetic retinopathy in fundus photographs. In Section II typical symptoms of diabetic retinopathy are explained. In Section III an overview of image processing algorithms for early detection diabetic retinopathy is given. In Section IV currently available databases for image processing algorithms are discussed and finally in Section V we give a short conclusion.
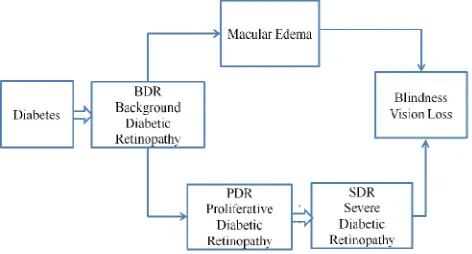
Diabetic Retinopathy And It’s Classification
Available Online at www.ijpret.com
1140 A. Classification
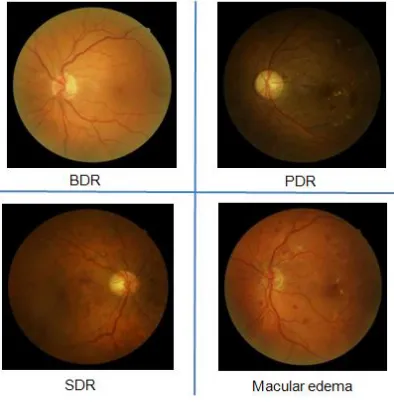
i. BDR-Background Diabetic Retinopathy
The earliest stage of diabetic retinopathy. With this condition, damaged blood vessels in the retina begin to leak extra fluid and small amounts of blood into the eye. Sometimes, deposits of cholesterol or other fats from the blood may leak into the retina.
ii. PDR- Proliferative Diabetic Retinopathy
Mainly occurs when many of the blood vessels in the retina close, preventing enough blood flow.
iii. SDR- Severe Diabetic Retinopathy
Continuous abnormal vessel growth & scare tissue, which lead to retinal detachment & hence loss of vision.
iv. Macular Edema
Diabetic macular edema may be asymptomatic at first. As the edema moves in to the fovea (the center of the macula) the patient will notice blurry central vision. The ability to read and recognize faces will be compromised.
Fig 1 Classification of diabetic retinopathy
Available Online at www.ijpret.com
1141 Fig 3 Unhealthy eye patterns
IMAGE PROCESSING ALGORITHM
An overview of image processing algorithm known to us are focused here also we have divided execution steps as
B. Image Preprocseeing
Available Online at www.ijpret.com
1142
i. Colour Normalization
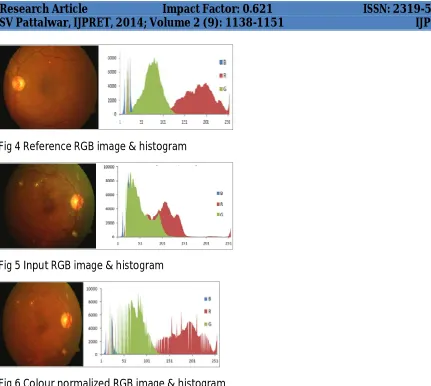
This step is includes in image preprocessing because intra & inter retinal colour image variation observes in different patients. Also we can include difference on retinal image contributed by skin pigmentation, aging of the patient and iris colour. Colour normalization provides image invariance w.r.t background pigmentation. As per [1], colour normalization is executed using histogram matching.
In the adaptive algorithms each pixel is modified based on the pixels that are in a region surrounding that pixel. This region is called contextual region. The adaptive histogram equalization is computationally intense, locally adaptive, and usually produces superior images and for this reason we are implementing this step to increase the speed of the basic non-adaptive method. If we have an image of n x n pixels, with k intensity levels and the size of contextual region is m x m, then time required is calculated as
Computation Time = o(n2(mk)) (1)
A standard retinal image is used as a reference for histogram specification technique in agreement with the expert ophthalmologist. This method is applied to normalize the values of only those images in the database that varies in colour with reference to the standard image. The histogram specification technique is independently applied to each individual RGB channel to match the shapes of three specific histograms of the reference image. Figure 4 show the reference retinal image and its RGB histogram. To demonstrate the colour normalization effect, a different colour retinal image and its RGB histograms are shown in Figure 5. The image normalized version and the relevant RGB histogram can be seen in Figure 6. It can be seen that normalization process modifies the colour distributions of the considered image to match the reference image’s distribution. This can be seen from comparison of the normalized image histograms with the reference image’s histograms. In [6] authors proposed a multilevel histogram equalization method as a preprocessing step in the detection of drusen. The approach is based on the sequential application of histogram equalization to progressively smaller non-overlapping neighbour hoods.
Available Online at www.ijpret.com
1143 Fig 4 Reference RGB image & histogram
Fig 5 Input RGB image & histogram
Fig 6 Colour normalized RGB image & histogram
ii .Contrast Enhancement
This step is applied in a preprocessing after colour normalization. By using contrast enhancement we can change the visual characteristic that can help to distinguish an object from background. It can be seen that retinal image contrast is decreased as the distance of a pixel from the centre of the image increases [6].
Here first RGB component of original image is transformed to HSI stands for Hue, Saturation & intensity. Among all HSI component, Hue represents dominant colour as perceived by an observer. Saturation refers to relative purity or the amount of white light mixed with hue.
Intensity reflects the brightness. So such representation of an image provides better result of
Available Online at www.ijpret.com 1144 ) ( 3 1 B G R
I
(2) )] , , [min( ) ( 3
1 R G B
B G R S (3) } ) )( ( ) ( )] ( ) [( 5 . 0 { cos 2 1 B G B R G R B R G R H (4)
C. Localization and segmentation of the optic disk
The optic disk (OD) centre and margin are typically requisite landmarks in establishing a frame of reference for classifying retinal and optic nerve pathology. Reliable and efficient OD localization and segmentation are important tasks in automatic eye disease screening.
Optic disk localization consist mainly of finding the approximate centre of the optic disk or placing the disk within a specific region such as a circle or square. In either way, many distractors like blood vessel edges or large exudate lesions complicate the process of optic disk localization. In early papers the optic disk was localized by identifying the largest cluster of bright pixels [8].
Advancement for OD localization is done in [7] by using a new, fast, and fully automatic OD localization and segmentation algorithm developed for retinal disease screening First, OD location candidates are identified using template matching. The template is designed to adapt to different image resolutions. Then, vessel characteristics (patterns) on the OD are used to determine OD location. Initialized by the detected OD centre and estimated OD radius, a fast, hybrid level-set model, which combines region and local gradient information, is applied to the segmentation of the disk boundary. Morphological filtering is used to remove blood vessels and bright regions other than the OD that affect segmentation in the peripapillary region.
D. Segmentation of the retinal vasculature
Available Online at www.ijpret.com
1145 identification of the retinal anatomy and pathology. Segmentation of blood vessels is important for image registration or spatial alignment of images.
Matched filtering for the detection of the vasculature convolves a 2D kernel with the retinal image. In [8] authors proposed a two-dimensional linear kernel with a Gaussian profile for segmentation of the vasculature. The profile of the filter is designed to match that of a blood vessel, which typically has a Gaussian or a Gaussian derivative profile. The kernels are typically rotated in 30–45 degree increments to fit into vessels of different orientations. The highest response filter is selected for each pixel and is typically threshold to provide a vessel image. Further post processing is then applied to identify vessel segments. Matched filtering performs well when used in conjunction with additional processing techniques but there are some problems. Convolution kernels may be quite large and need to be applied in several orientations which can be very computationally expensive. Kernel responds optimally to vessels that have the same standard deviation of the underlying Gaussian function specified by the kernel. Retinal background and low contrast of smaller vessels increase the number of false responses around bright objects. Several authors have proposed refinements and extensions which address many of these problems [10]. In [11] many authors experimented with vessel tracking algorithms. Vessel tracking algorithms segment a vessel between two points. A vessel tracking algorithm typically steps along the vessel. The centre of the longitudinal cross section of vessel is determined with various properties of the vessel including average width. The main advantage of vessel tracking methods is that they provide highly accurate vessel widths, and can provide information about individual vessels that is usually unavailable using other methods. Unfortunately, they require the starting point and sometimes vessel tracking techniques may be confused by vessel crossings and bifurcations.
The Gabor wavelet transform has some impressive mathematical and biological properties. We have learned that the wavelet transform could perform multi-resolution & multi-orientation time-frequency analysis. It consists of a group of Gabor filters at different frequencies and directions. Gabor wavelets were produced by a Gabor kernel that is a product of an elliptical Gaussian and a complex plane wave [13].
It has been observed that wavelet transforms are not capable of reconstructing curved images perfectly; hence we switch over concept, called Contourlet Transform, proposed by Do and Vetterli [12].
Image Databases
Available Online at www.ijpret.com
1146 anything. Fundus image consist retina, optic disc, macula & posterior pole.Image databases are very important because all image processing algorithms developed have to be tested and verified. An overview of all publicly available retinal image databases known to us is given in this section.
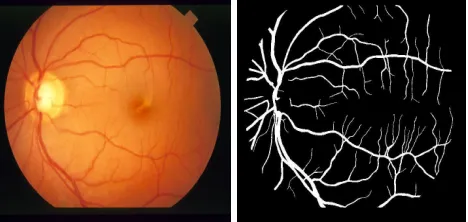
A. DRIVE (Digital Retinal Images for Vessel Extraction) Database
The database consists of 40 colour fundus photographs & their ground truth images. Each image is JPEG compressed. All images in DRIVE database are digitized using a Cannon CR5 non-mydriatic 3CCD camera with a 45 degree field of view (FOV). Each image is captured using 24-bits per pixel at the image size of 768×584. These images were labeled by hand, to produce ground truth vessel segmentation. Below figure shows a sample of the input image from this database [14].
Fig 7 Retinal images from DRIVE database (left), hand labeled ground truth vessel segmentation
B. STARE (Structured Analysis of Retina) Database
Here there are twenty retinal fundus slides and their ground truth images. The images are digitized slides captured by a Top Con TRV-50 fundus camera with 35 degree FOV. Each slide was digitized to produce a 605 x 700 pixel image with 24-bits per pixel (RGB image). All the twenty images were carefully labeled by hand to produce ground truth vessel segmentation by an expert. Below figure shows a sample of the input image from this database [15].
Available Online at www.ijpret.com
1147
C. ARIA online Database
This database was created in 2006, in a research collaboration between St. Paul’s Eye Unit, Royal Liverpool University Hospital Trust, Liverpool, UK and the Department of Ophthalmology, Clinical Sciences, University of Liverpool, Liverpool, UK .The trace of blood vessels, the optic disc and fovea location was marked by two image analysis experts as the reference standard. The images were captured at a resolution of 768×576 pixels in RGB color with 8-bits per color plane with a Zeiss FF450+ fundus camera at a 50 degree FOV and stored as uncompressed TIFF files [16].
D. Image Ret
The Image Ret database was made publicly available in 2008 and is subdivided into two sub-databases, DIARETDB0 and DIARETDB1. DIARETDB0 contains 130 retinal images of which 20 are normal and 110 contain various signs of diabetic retinopathy. DIARETDB1 contains 89 images out of which 5 images represent healthy retinas while the other 84 have some diabetic retinopathy signs. The images were acquired with a 50 degree FOV using a fundus camera at a size of 1500×1152 pixels in PNG format. The images were annotated by four experts for the presence of micro aneurysms, haemorrhages, and hard and soft exudates [17].
E. Messidor
The Messidor-project database, with 1200 retinal images, is the largest database currently available on the Internet and is provided by the Messidor program partners [18]. The images were acquired by 3 ophthalmologic departments using a color video 3CCD camera on a Topcon TRC NW6 non-mydriatic camera with a 45 degree FOV. The images were captured using 8 bits per colour plane at 1440×960, 2240×1488, or 2304×1536 pixels. 800 images were acquired with pupil dilation and 400 without dilation. The reference standard provided contains the grading for diabetic retinopathy and the risk of macular edema in each image.
F. Review
The Retinal Vessel Image set for Estimation of Widths (REVIEW) [19] was made available online in 2008 by the Department of Computing and Informatics at the University of Lincoln, Lincoln, UK. The dataset contains 16 mydriatic images with 193 annotated vessel segments consisting of 5066 profile points manually marked by three independent experts.
G. ROC micro aneurysm set
Available Online at www.ijpret.com
1148 [20]The set of data used for the competition consisted of 50 training images with available reference standard and 50 test images where the reference standard was withheld by the organizers. The images were captured using a Topcon NW100, a Topcon NW200 or a Canon CR5-45NM non-mydriatic camera at 45 degree FOV and were JPEG compressed in the camera. There are three different image sizes present in the database; 768×576, 1058×1061 and 1389×1383 pixels.
H. HEI-MED
The Hamilton Eye Institute Macular Edema Dataset (HEI-MED) is a collection of 169 fundus images to train and test image processing algorithms for the detection of exudates and diabetic macular edema [21].The dataset is composed of 169 JPEG images compressed at highest quality. Each image of the dataset was manually segmented by Dr. Edward Chaum (an expert ophthalmologist from HEI). He identified all the exudation areas and other bright lesions such as cotton wool spots, clearly visible fluid occurring on the fundus.
I. DRiDB
Diabetic Retinopathy Image Database is a new database developed in cooperation between Faculty of Electrical Engineering and Computing, University of Zagreb and Clinical Hospital Centre “Sestre Milosrdnice” from Zagreb. The images were captured at a resolution of 720×576 pixels in RGB color with 8-bits per color plane with a Zeiss VISUCAM 200 fundus camera at a 45 degree FOV and stored as uncompressed BMP files. A set of ground truth images accompanies every color fundus image from the database. For each image from the database five experts independently marked diabetic retinopathy findings (micro aneurysms, haemorrhages, hard exudates, soft exudates). The experts were asked to mark the blood vessels, optic disc and macula alongside marked diabetic retinopathy findings and finally experts performed annotation of neo vascularisations.
Benchmarking Parameters
Available Online at www.ijpret.com 1149 FN TP TP y Sensitivit (5) FP TN TN y Specificit (6)
TP FN TN FP
TN TP Accuracy ( ) (7)
Here TP denotes true positive, FP denotes false positive, FN is false positive & TN is true negative. True Positive refers to the correctly identified vessel pixels, True Negative refers to the wrongly identified vessel pixels, False Positive refers to the correctly identified background pixels and False Negative refers to the wrongly identified background pixels.
CONCLUDING REMARKS
To develop an automatic retinal image processing system, the first important thing is to obtain an effective database. To realize this and also for facilitating comparison with the existing methods, nine sets of retinal databases with their specifications are focused. Main aim is to incorporate types of available databases for researchers.
ACKNOWLEDGMENT
The authors would like to thank to database designers & making their databases publicly available. The authors also would like to thank Dr. Chetan Videkar (LV Prasad, Eye Institute, Bhubaneswar, India) for his constant help and support .
REFERENCES
1. Rafael C. Gonzalez and Richard E. Woods, “Digital Image Processing”. New Jersey:
Prentice-Hall, Inc., rd
III Edition.
2. S. Wild, G. Roglic, A. Green, R. Sicree, and H. King, “Global prevalence of diabetes: estimates
for the year 2000 and projections for 2030,” Diabetes Care, vol. 27, no. 5, pp. 1047–1053, 2004.
3. NEHEP American Public Health Association Annual Meeting Fall-2010.
4. Advances and emerging opportunities in diabetes research: a Strategic Planning report of the
Available Online at www.ijpret.com
1150 5. C. A. McCarty, C. W. Lloyd-Smith, S. E. Lee, P. M. Livingston, Y. L. Stanislavsky, and H. R. Taylor, “Use of eye care services by people with diabetes: the Melbourne Visual Impairment Project,” Br J Ophthalmol, vol. 82, no. 4, pp. 410–414, 1998.
6. K. Rapantzikos, M. Zervakis, and K. Balas, “Detection and segmentation of drusen deposits on
human retina: Potential in the diagnosis of age-related macular degeneration,” Medical image analysis, vol. 7, no. 1, pp. 95–108, 2003.
7. Mahfouz, A.E.; Fahmy, A.S “Fast Localization of the Optic Disc Using Projection of Image
Features” IEEE Journals & Magazines - July 2012.
8. S. Chaudhuri, S. Chatterjee, N. Katz, M. Nelson, and M. Goldbaum, “Detection of blood
vessels in retinal images using two-dimensional matched filters,” IEEE Transactions on medical imaging, vol. 8, no. 3, pp. 263–269, 1989.
9. S.Jayaraman,”Digital Image Processing”TMH publicati-on ,IIIrd Edition. B. Zhang, L. Zhang, L.
Zhang, and F. Karray, “Retinal vessel extraction by matched filter with first-order derivative of gaussian,” Computers in biology and medicine, vol. 40, no. 4, pp. 438–445, 2010.
10.Y. Yin, M. Adel, and S. Bourennane, “Retinal vessel segmentation using a probabilistic
tracking method,” Pattern Recognition, vol. 45, no. 4, pp. 1235–1244, 2012.
11.M. Do, M. Vetterli, The contourlet transform: an efficient directional multi resolution image
representation, IEEE Trans. Image Process., 14 (12), 2091-2106 (2005).
12.J. V. B. Soares, J. J. G. Leandro, R. M. Cesar, H. F. Jelinek, and M. J. Cree, Retinal vessel segmentation using the 2D Gabor wavelet and supervise classification, IEEE Transactions on Medical Imaging, vol. 25, no. 9, pp. 12141222, 2006.
13.M. Niemeijer, J. J. Staal, M. Ginneken B. v., Loog, and M. D. Abramoff. (2004) DRIVE: digital
retinal images for vessel extraction. [Online]. Available:
http://www.isi.uu.nl/Research/Databases/DRIVE
A.Hoover, V. Kouznetsova, and M. Goldbaum, “Locating blood vessels in retinal images by
piecewise threshold probing of a matched filter response,” Medical Imaging, IEEE Transactions on, vol. 19, no. 3, pp. 203–210, 2000.
14.(2006) ARIA online, retinal image archive. Online. Available at :
15.http://www.eyecharity.com/doe/aria_online
16.T. Kauppi, V. Kalesnykiene, J. K. Kamarainen, L. Lensu, I. Sorri, A. Raninen, R. Voutilainen, H.
Available Online at www.ijpret.com
1151 evaluation protocol,” Proc Medical Image Understanding and Analysis MIUA, vol. 1, pp. 3–7, 2007.
17.(2004) MESSIDOR: Methods for evaluating segmentation and indexing techniques dedicated
to retinal ophthalmology. Online Available At: http://messidor.crihan.fr/index-en.php
18.B. Al-Diri, A. Hunter, D. Steel, M. Habib, T. Hudaib, and S. Berry, “REVIEW-a reference data
set for retinal vesse lprofiles,” Engineering in Medicine and Biology Society,30thAnnual International Conference of the IEEE, vol. 2008, pp. 2262–2265, 2008.
19.M. Niemeijer, “Retinopathy online challenge: Automatic detection of microaneurysms in
digital color fundus photographs,” IEEE Trans. Med. Imaging, vol. 29, p. 185–195,2009.
20.L. Giancardo, F. Meriaudeau, T. P. Karnowski, Y. Li, S. Garg, K. W. Tobin, and E. Chaum,
“Exudate-based diabetic macular edema detection in fundus images using publicly available datasets,” Med Image Anal, vol. 16, no. 1, pp. 216–226, 2012.
21.P. Prentasic, S. Loncaric, Z. Vatavuk, G. Bencic, Suba si c,T. Petkovi´c, L. Dujmovi´c, M.
Malenica-Ravli´c, N. Budimlija, and R. Tadic, “Diabetic Retinopathy Image Database(DRiDB): a new database for diabetic retinopathy screening programs research,” 8th International Symposium on Image and Signal Proc ssing and Analysis (ISPA 2013), 2013
22.http://www.mathworks.in/help/images/ref/adapthisteq. html .